Estimated zip code population in 2022: 41,354
Zip code population in 2010: 35,990
Zip code population in 2000: 36,889
Houses and condos: 15,019
Renter-occupied apartments: 4,415
% of renters here:
32%State:
38%
March 2022 cost of living index in zip code 78221: 86.5
(less than average, U.S. average is 100)
Land area: 30.4
sq. mi.
Water area: 1.7
sq. mi.
Population density: 1,359 people per square mile (low).
OSM Map
General Map
Google Map
MSN Map
OSM Map
General Map
Google Map
MSN Map
OSM Map
General Map
Google Map
MSN Map
OSM Map
General Map
Google Map
MSN Map
Please wait while loading the map...
Real estate property taxes paid for housing units in 2022:
This zip code:
1.6% ($2,531)Texas:
1.5% ($4,050)
Median real estate property taxes paid for housing units with mortgages in 2022: $3,418 (1.8%)
Median real estate property taxes paid for housing units with no mortgage in 2022: $1,722 (1.3%)
Profiles of local businesses
Business Search - 14 Million verified businesses
Males: 21,170 Females: 20,184
For population 25 years and over in 78221:
High school or higher: 72.4%Bachelor's degree or higher: 10.8%Graduate or professional degree: 3.6%Unemployed: 4.9%Mean travel time to work (commute): 26.5 minutes
For population 15 years and over in 78221:
Never married: 38.6%Now married: 43.8%Separated: 2.3%Widowed: 5.1%Divorced: 10.1%
Zip code 78221 compared to state average:
Median house value below state average. Black race population percentage significantly below state average. Hispanic race population percentage above state average. Length of stay since moving in significantly above state average. Percentage of population with a bachelor's degree or higher significantly below state average. 36,736 88.8% Hispanic or Latino 3,794 9.2% White 348 0.8% Asian 250 0.6% Black 134 0.3% Two or more races 90 0.2% Some other race
Data:
Median household income ($)
Median household income (% change since 2000)
Household income diversity
Ratio of average income to average house value (%)
Ratio of average income to average rent
Median household income ($) - White
Median household income ($) - Black or African American
Median household income ($) - Asian
Median household income ($) - Hispanic or Latino
Median household income ($) - American Indian and Alaska Native
Median household income ($) - Multirace
Median household income ($) - Other Race
Median household income for houses/condos with a mortgage ($)
Median household income for apartments without a mortgage ($)
Races - White alone (%)
Races - White alone (% change since 2000)
Races - Black alone (%)
Races - Black alone (% change since 2000)
Races - American Indian alone (%)
Races - American Indian alone (% change since 2000)
Races - Asian alone (%)
Races - Asian alone (% change since 2000)
Races - Hispanic (%)
Races - Hispanic (% change since 2000)
Races - Native Hawaiian and Other Pacific Islander alone (%)
Races - Native Hawaiian and Other Pacific Islander alone (% change since 2000)
Races - Two or more races (%)
Races - Two or more races (% change since 2000)
Races - Other race alone (%)
Races - Other race alone (% change since 2000)
Racial diversity
Unemployment (%)
Unemployment (% change since 2000)
Unemployment (%) - White
Unemployment (%) - Black or African American
Unemployment (%) - Asian
Unemployment (%) - Hispanic or Latino
Unemployment (%) - American Indian and Alaska Native
Unemployment (%) - Multirace
Unemployment (%) - Other Race
Population density (people per square mile)
Population - Males (%)
Population - Females (%)
Population - Males (%) - White
Population - Males (%) - Black or African American
Population - Males (%) - Asian
Population - Males (%) - Hispanic or Latino
Population - Males (%) - American Indian and Alaska Native
Population - Males (%) - Multirace
Population - Males (%) - Other Race
Population - Females (%) - White
Population - Females (%) - Black or African American
Population - Females (%) - Asian
Population - Females (%) - Hispanic or Latino
Population - Females (%) - American Indian and Alaska Native
Population - Females (%) - Multirace
Population - Females (%) - Other Race
Coronavirus confirmed cases (Apr 27, 2024)
Deaths caused by coronavirus (Apr 27, 2024)
Coronavirus confirmed cases (per 100k population) (Apr 27, 2024)
Deaths caused by coronavirus (per 100k population) (Apr 27, 2024)
Daily increase in number of cases (Apr 27, 2024)
Weekly increase in number of cases (Apr 27, 2024)
Cases doubled (in days) (Apr 27, 2024)
Hospitalized patients (Apr 18, 2022)
Negative test results (Apr 18, 2022)
Total test results (Apr 18, 2022)
COVID Vaccine doses distributed (per 100k population) (Sep 19, 2023)
COVID Vaccine doses administered (per 100k population) (Sep 19, 2023)
COVID Vaccine doses distributed (Sep 19, 2023)
COVID Vaccine doses administered (Sep 19, 2023)
Likely homosexual households (%)
Likely homosexual households (% change since 2000)
Likely homosexual households - Lesbian couples (%)
Likely homosexual households - Lesbian couples (% change since 2000)
Likely homosexual households - Gay men (%)
Likely homosexual households - Gay men (% change since 2000)
Cost of living index
Median gross rent ($)
Median contract rent ($)
Median monthly housing costs ($)
Median house or condo value ($)
Median house or condo value ($ change since 2000)
Mean house or condo value by units in structure - 1, detached ($)
Mean house or condo value by units in structure - 1, attached ($)
Mean house or condo value by units in structure - 2 ($)
Mean house or condo value by units in structure by units in structure - 3 or 4 ($)
Mean house or condo value by units in structure - 5 or more ($)
Mean house or condo value by units in structure - Boat, RV, van, etc. ($)
Mean house or condo value by units in structure - Mobile home ($)
Median house or condo value ($) - White
Median house or condo value ($) - Black or African American
Median house or condo value ($) - Asian
Median house or condo value ($) - Hispanic or Latino
Median house or condo value ($) - American Indian and Alaska Native
Median house or condo value ($) - Multirace
Median house or condo value ($) - Other Race
Median resident age
Resident age diversity
Median resident age - Males
Median resident age - Females
Median resident age - White
Median resident age - Black or African American
Median resident age - Asian
Median resident age - Hispanic or Latino
Median resident age - American Indian and Alaska Native
Median resident age - Multirace
Median resident age - Other Race
Median resident age - Males - White
Median resident age - Males - Black or African American
Median resident age - Males - Asian
Median resident age - Males - Hispanic or Latino
Median resident age - Males - American Indian and Alaska Native
Median resident age - Males - Multirace
Median resident age - Males - Other Race
Median resident age - Females - White
Median resident age - Females - Black or African American
Median resident age - Females - Asian
Median resident age - Females - Hispanic or Latino
Median resident age - Females - American Indian and Alaska Native
Median resident age - Females - Multirace
Median resident age - Females - Other Race
Commute - mean travel time to work (minutes)
Travel time to work - Less than 5 minutes (%)
Travel time to work - Less than 5 minutes (% change since 2000)
Travel time to work - 5 to 9 minutes (%)
Travel time to work - 5 to 9 minutes (% change since 2000)
Travel time to work - 10 to 19 minutes (%)
Travel time to work - 10 to 19 minutes (% change since 2000)
Travel time to work - 20 to 29 minutes (%)
Travel time to work - 20 to 29 minutes (% change since 2000)
Travel time to work - 30 to 39 minutes (%)
Travel time to work - 30 to 39 minutes (% change since 2000)
Travel time to work - 40 to 59 minutes (%)
Travel time to work - 40 to 59 minutes (% change since 2000)
Travel time to work - 60 to 89 minutes (%)
Travel time to work - 60 to 89 minutes (% change since 2000)
Travel time to work - 90 or more minutes (%)
Travel time to work - 90 or more minutes (% change since 2000)
Marital status - Never married (%)
Marital status - Now married (%)
Marital status - Separated (%)
Marital status - Widowed (%)
Marital status - Divorced (%)
Median family income ($)
Median family income (% change since 2000)
Median non-family income ($)
Median non-family income (% change since 2000)
Median per capita income ($)
Median per capita income (% change since 2000)
Median family income ($) - White
Median family income ($) - Black or African American
Median family income ($) - Asian
Median family income ($) - Hispanic or Latino
Median family income ($) - American Indian and Alaska Native
Median family income ($) - Multirace
Median family income ($) - Other Race
Median year house/condo built
Median year apartment built
Year house built - Built 2005 or later (%)
Year house built - Built 2000 to 2004 (%)
Year house built - Built 1990 to 1999 (%)
Year house built - Built 1980 to 1989 (%)
Year house built - Built 1970 to 1979 (%)
Year house built - Built 1960 to 1969 (%)
Year house built - Built 1950 to 1959 (%)
Year house built - Built 1940 to 1949 (%)
Year house built - Built 1939 or earlier (%)
Average household size
Household density (households per square mile)
Average household size - White
Average household size - Black or African American
Average household size - Asian
Average household size - Hispanic or Latino
Average household size - American Indian and Alaska Native
Average household size - Multirace
Average household size - Other Race
Occupied housing units (%)
Vacant housing units (%)
Owner occupied housing units (%)
Renter occupied housing units (%)
Vacancy status - For rent (%)
Vacancy status - For sale only (%)
Vacancy status - Rented or sold, not occupied (%)
Vacancy status - For seasonal, recreational, or occasional use (%)
Vacancy status - For migrant workers (%)
Vacancy status - Other vacant (%)
Residents with income below the poverty level (%)
Residents with income below 50% of the poverty level (%)
Children below poverty level (%)
Poor families by family type - Married-couple family (%)
Poor families by family type - Male, no wife present (%)
Poor families by family type - Female, no husband present (%)
Poverty status for native-born residents (%)
Poverty status for foreign-born residents (%)
Poverty among high school graduates not in families (%)
Poverty among people who did not graduate high school not in families (%)
Residents with income below the poverty level (%) - White
Residents with income below the poverty level (%) - Black or African American
Residents with income below the poverty level (%) - Asian
Residents with income below the poverty level (%) - Hispanic or Latino
Residents with income below the poverty level (%) - American Indian and Alaska Native
Residents with income below the poverty level (%) - Multirace
Residents with income below the poverty level (%) - Other Race
Air pollution - Air Quality Index (AQI)
Air pollution - CO
Air pollution - NO2
Air pollution - SO2
Air pollution - Ozone
Air pollution - PM10
Air pollution - PM25
Air pollution - Pb
Crime - Murders per 100,000 population
Crime - Rapes per 100,000 population
Crime - Robberies per 100,000 population
Crime - Assaults per 100,000 population
Crime - Burglaries per 100,000 population
Crime - Thefts per 100,000 population
Crime - Auto thefts per 100,000 population
Crime - Arson per 100,000 population
Crime - City-data.com crime index
Crime - Violent crime index
Crime - Property crime index
Crime - Murders per 100,000 population (5 year average)
Crime - Rapes per 100,000 population (5 year average)
Crime - Robberies per 100,000 population (5 year average)
Crime - Assaults per 100,000 population (5 year average)
Crime - Burglaries per 100,000 population (5 year average)
Crime - Thefts per 100,000 population (5 year average)
Crime - Auto thefts per 100,000 population (5 year average)
Crime - Arson per 100,000 population (5 year average)
Crime - City-data.com crime index (5 year average)
Crime - Violent crime index (5 year average)
Crime - Property crime index (5 year average)
1996 Presidential Elections Results (%) - Democratic Party (Clinton)
1996 Presidential Elections Results (%) - Republican Party (Dole)
1996 Presidential Elections Results (%) - Other
2000 Presidential Elections Results (%) - Democratic Party (Gore)
2000 Presidential Elections Results (%) - Republican Party (Bush)
2000 Presidential Elections Results (%) - Other
2004 Presidential Elections Results (%) - Democratic Party (Kerry)
2004 Presidential Elections Results (%) - Republican Party (Bush)
2004 Presidential Elections Results (%) - Other
2008 Presidential Elections Results (%) - Democratic Party (Obama)
2008 Presidential Elections Results (%) - Republican Party (McCain)
2008 Presidential Elections Results (%) - Other
2012 Presidential Elections Results (%) - Democratic Party (Obama)
2012 Presidential Elections Results (%) - Republican Party (Romney)
2012 Presidential Elections Results (%) - Other
2016 Presidential Elections Results (%) - Democratic Party (Clinton)
2016 Presidential Elections Results (%) - Republican Party (Trump)
2016 Presidential Elections Results (%) - Other
2020 Presidential Elections Results (%) - Democratic Party (Biden)
2020 Presidential Elections Results (%) - Republican Party (Trump)
2020 Presidential Elections Results (%) - Other
Ancestries Reported - Arab (%)
Ancestries Reported - Czech (%)
Ancestries Reported - Danish (%)
Ancestries Reported - Dutch (%)
Ancestries Reported - English (%)
Ancestries Reported - French (%)
Ancestries Reported - French Canadian (%)
Ancestries Reported - German (%)
Ancestries Reported - Greek (%)
Ancestries Reported - Hungarian (%)
Ancestries Reported - Irish (%)
Ancestries Reported - Italian (%)
Ancestries Reported - Lithuanian (%)
Ancestries Reported - Norwegian (%)
Ancestries Reported - Polish (%)
Ancestries Reported - Portuguese (%)
Ancestries Reported - Russian (%)
Ancestries Reported - Scotch-Irish (%)
Ancestries Reported - Scottish (%)
Ancestries Reported - Slovak (%)
Ancestries Reported - Subsaharan African (%)
Ancestries Reported - Swedish (%)
Ancestries Reported - Swiss (%)
Ancestries Reported - Ukrainian (%)
Ancestries Reported - United States (%)
Ancestries Reported - Welsh (%)
Ancestries Reported - West Indian (%)
Ancestries Reported - Other (%)
Educational Attainment - No schooling completed (%)
Educational Attainment - Less than high school (%)
Educational Attainment - High school or equivalent (%)
Educational Attainment - Less than 1 year of college (%)
Educational Attainment - 1 or more years of college (%)
Educational Attainment - Associate degree (%)
Educational Attainment - Bachelor's degree (%)
Educational Attainment - Master's degree (%)
Educational Attainment - Professional school degree (%)
Educational Attainment - Doctorate degree (%)
School Enrollment - Nursery, preschool (%)
School Enrollment - Kindergarten (%)
School Enrollment - Grade 1 to 4 (%)
School Enrollment - Grade 5 to 8 (%)
School Enrollment - Grade 9 to 12 (%)
School Enrollment - College undergrad (%)
School Enrollment - Graduate or professional (%)
School Enrollment - Not enrolled in school (%)
School enrollment - Public schools (%)
School enrollment - Private schools (%)
School enrollment - Not enrolled (%)
Median number of rooms in houses and condos
Median number of rooms in apartments
Housing units lacking complete plumbing facilities (%)
Housing units lacking complete kitchen facilities (%)
Density of houses
Urban houses (%)
Rural houses (%)
Households with people 60 years and over (%)
Households with people 65 years and over (%)
Households with people 75 years and over (%)
Households with one or more nonrelatives (%)
Households with no nonrelatives (%)
Population in households (%)
Family households (%)
Nonfamily households (%)
Population in families (%)
Family households with own children (%)
Median number of bedrooms in owner occupied houses
Mean number of bedrooms in owner occupied houses
Median number of bedrooms in renter occupied houses
Mean number of bedrooms in renter occupied houses
Median number of vehichles in owner occupied houses
Mean number of vehichles in owner occupied houses
Median number of vehichles in renter occupied houses
Mean number of vehichles in renter occupied houses
Mortgage status - with mortgage (%)
Mortgage status - with second mortgage (%)
Mortgage status - with home equity loan (%)
Mortgage status - with both second mortgage and home equity loan (%)
Mortgage status - without a mortgage (%)
Average family size
Average family size - White
Average family size - Black or African American
Average family size - Asian
Average family size - Hispanic or Latino
Average family size - American Indian and Alaska Native
Average family size - Multirace
Average family size - Other Race
Geographical mobility - Same house 1 year ago (%)
Geographical mobility - Moved within same county (%)
Geographical mobility - Moved from different county within same state (%)
Geographical mobility - Moved from different state (%)
Geographical mobility - Moved from abroad (%)
Place of birth - Born in state of residence (%)
Place of birth - Born in other state (%)
Place of birth - Native, outside of US (%)
Place of birth - Foreign born (%)
Housing units in structures - 1, detached (%)
Housing units in structures - 1, attached (%)
Housing units in structures - 2 (%)
Housing units in structures - 3 or 4 (%)
Housing units in structures - 5 to 9 (%)
Housing units in structures - 10 to 19 (%)
Housing units in structures - 20 to 49 (%)
Housing units in structures - 50 or more (%)
Housing units in structures - Mobile home (%)
Housing units in structures - Boat, RV, van, etc. (%)
House/condo owner moved in on average (years ago)
Renter moved in on average (years ago)
Year householder moved into unit - Moved in 1999 to March 2000 (%)
Year householder moved into unit - Moved in 1995 to 1998 (%)
Year householder moved into unit - Moved in 1990 to 1994 (%)
Year householder moved into unit - Moved in 1980 to 1989 (%)
Year householder moved into unit - Moved in 1970 to 1979 (%)
Year householder moved into unit - Moved in 1969 or earlier (%)
Means of transportation to work - Drove car alone (%)
Means of transportation to work - Carpooled (%)
Means of transportation to work - Public transportation (%)
Means of transportation to work - Bus or trolley bus (%)
Means of transportation to work - Streetcar or trolley car (%)
Means of transportation to work - Subway or elevated (%)
Means of transportation to work - Railroad (%)
Means of transportation to work - Ferryboat (%)
Means of transportation to work - Taxicab (%)
Means of transportation to work - Motorcycle (%)
Means of transportation to work - Bicycle (%)
Means of transportation to work - Walked (%)
Means of transportation to work - Other means (%)
Working at home (%)
Industry diversity
Most Common Industries - Agriculture, forestry, fishing and hunting, and mining (%)
Most Common Industries - Agriculture, forestry, fishing and hunting (%)
Most Common Industries - Mining, quarrying, and oil and gas extraction (%)
Most Common Industries - Construction (%)
Most Common Industries - Manufacturing (%)
Most Common Industries - Wholesale trade (%)
Most Common Industries - Retail trade (%)
Most Common Industries - Transportation and warehousing, and utilities (%)
Most Common Industries - Transportation and warehousing (%)
Most Common Industries - Utilities (%)
Most Common Industries - Information (%)
Most Common Industries - Finance and insurance, and real estate and rental and leasing (%)
Most Common Industries - Finance and insurance (%)
Most Common Industries - Real estate and rental and leasing (%)
Most Common Industries - Professional, scientific, and management, and administrative and waste management services (%)
Most Common Industries - Professional, scientific, and technical services (%)
Most Common Industries - Management of companies and enterprises (%)
Most Common Industries - Administrative and support and waste management services (%)
Most Common Industries - Educational services, and health care and social assistance (%)
Most Common Industries - Educational services (%)
Most Common Industries - Health care and social assistance (%)
Most Common Industries - Arts, entertainment, and recreation, and accommodation and food services (%)
Most Common Industries - Arts, entertainment, and recreation (%)
Most Common Industries - Accommodation and food services (%)
Most Common Industries - Other services, except public administration (%)
Most Common Industries - Public administration (%)
Occupation diversity
Most Common Occupations - Management, business, science, and arts occupations (%)
Most Common Occupations - Management, business, and financial occupations (%)
Most Common Occupations - Management occupations (%)
Most Common Occupations - Business and financial operations occupations (%)
Most Common Occupations - Computer, engineering, and science occupations (%)
Most Common Occupations - Computer and mathematical occupations (%)
Most Common Occupations - Architecture and engineering occupations (%)
Most Common Occupations - Life, physical, and social science occupations (%)
Most Common Occupations - Education, legal, community service, arts, and media occupations (%)
Most Common Occupations - Community and social service occupations (%)
Most Common Occupations - Legal occupations (%)
Most Common Occupations - Education, training, and library occupations (%)
Most Common Occupations - Arts, design, entertainment, sports, and media occupations (%)
Most Common Occupations - Healthcare practitioners and technical occupations (%)
Most Common Occupations - Health diagnosing and treating practitioners and other technical occupations (%)
Most Common Occupations - Health technologists and technicians (%)
Most Common Occupations - Service occupations (%)
Most Common Occupations - Healthcare support occupations (%)
Most Common Occupations - Protective service occupations (%)
Most Common Occupations - Fire fighting and prevention, and other protective service workers including supervisors (%)
Most Common Occupations - Law enforcement workers including supervisors (%)
Most Common Occupations - Food preparation and serving related occupations (%)
Most Common Occupations - Building and grounds cleaning and maintenance occupations (%)
Most Common Occupations - Personal care and service occupations (%)
Most Common Occupations - Sales and office occupations (%)
Most Common Occupations - Sales and related occupations (%)
Most Common Occupations - Office and administrative support occupations (%)
Most Common Occupations - Natural resources, construction, and maintenance occupations (%)
Most Common Occupations - Farming, fishing, and forestry occupations (%)
Most Common Occupations - Construction and extraction occupations (%)
Most Common Occupations - Installation, maintenance, and repair occupations (%)
Most Common Occupations - Production, transportation, and material moving occupations (%)
Most Common Occupations - Production occupations (%)
Most Common Occupations - Transportation occupations (%)
Most Common Occupations - Material moving occupations (%)
People in Group quarters - Institutionalized population (%)
People in Group quarters - Correctional institutions (%)
People in Group quarters - Federal prisons and detention centers (%)
People in Group quarters - Halfway houses (%)
People in Group quarters - Local jails and other confinement facilities (including police lockups) (%)
People in Group quarters - Military disciplinary barracks (%)
People in Group quarters - State prisons (%)
People in Group quarters - Other types of correctional institutions (%)
People in Group quarters - Nursing homes (%)
People in Group quarters - Hospitals/wards, hospices, and schools for the handicapped (%)
People in Group quarters - Hospitals/wards and hospices for chronically ill (%)
People in Group quarters - Hospices or homes for chronically ill (%)
People in Group quarters - Military hospitals or wards for chronically ill (%)
People in Group quarters - Other hospitals or wards for chronically ill (%)
People in Group quarters - Hospitals or wards for drug/alcohol abuse (%)
People in Group quarters - Mental (Psychiatric) hospitals or wards (%)
People in Group quarters - Schools, hospitals, or wards for the mentally retarded (%)
People in Group quarters - Schools, hospitals, or wards for the physically handicapped (%)
People in Group quarters - Institutions for the deaf (%)
People in Group quarters - Institutions for the blind (%)
People in Group quarters - Orthopedic wards and institutions for the physically handicapped (%)
People in Group quarters - Wards in general hospitals for patients who have no usual home elsewhere (%)
People in Group quarters - Wards in military hospitals for patients who have no usual home elsewhere (%)
People in Group quarters - Juvenile institutions (%)
People in Group quarters - Long-term care (%)
People in Group quarters - Homes for abused, dependent, and neglected children (%)
People in Group quarters - Residential treatment centers for emotionally disturbed children (%)
People in Group quarters - Training schools for juvenile delinquents (%)
People in Group quarters - Short-term care, detention or diagnostic centers for delinquent children (%)
People in Group quarters - Type of juvenile institution unknown (%)
People in Group quarters - Noninstitutionalized population (%)
People in Group quarters - College dormitories (includes college quarters off campus) (%)
People in Group quarters - Military quarters (%)
People in Group quarters - On base (%)
People in Group quarters - Barracks, unaccompanied personnel housing (UPH), (Enlisted/Officer), ;and similar group living quarters for military personnel (%)
People in Group quarters - Transient quarters for temporary residents (%)
People in Group quarters - Military ships (%)
People in Group quarters - Group homes (%)
People in Group quarters - Homes or halfway houses for drug/alcohol abuse (%)
People in Group quarters - Homes for the mentally ill (%)
People in Group quarters - Homes for the mentally retarded (%)
People in Group quarters - Homes for the physically handicapped (%)
People in Group quarters - Other group homes (%)
People in Group quarters - Religious group quarters (%)
People in Group quarters - Dormitories (%)
People in Group quarters - Agriculture workers' dormitories on farms (%)
People in Group quarters - Job Corps and vocational training facilities (%)
People in Group quarters - Other workers' dormitories (%)
People in Group quarters - Crews of maritime vessels (%)
People in Group quarters - Other nonhousehold living situations (%)
People in Group quarters - Other noninstitutional group quarters (%)
Residents speaking English at home (%)
Residents speaking English at home - Born in the United States (%)
Residents speaking English at home - Native, born elsewhere (%)
Residents speaking English at home - Foreign born (%)
Residents speaking Spanish at home (%)
Residents speaking Spanish at home - Born in the United States (%)
Residents speaking Spanish at home - Native, born elsewhere (%)
Residents speaking Spanish at home - Foreign born (%)
Residents speaking other language at home (%)
Residents speaking other language at home - Born in the United States (%)
Residents speaking other language at home - Native, born elsewhere (%)
Residents speaking other language at home - Foreign born (%)
Class of Workers - Employee of private company (%)
Class of Workers - Self-employed in own incorporated business (%)
Class of Workers - Private not-for-profit wage and salary workers (%)
Class of Workers - Local government workers (%)
Class of Workers - State government workers (%)
Class of Workers - Federal government workers (%)
Class of Workers - Self-employed workers in own not incorporated business and Unpaid family workers (%)
House heating fuel used in houses and condos - Utility gas (%)
House heating fuel used in houses and condos - Bottled, tank, or LP gas (%)
House heating fuel used in houses and condos - Electricity (%)
House heating fuel used in houses and condos - Fuel oil, kerosene, etc. (%)
House heating fuel used in houses and condos - Coal or coke (%)
House heating fuel used in houses and condos - Wood (%)
House heating fuel used in houses and condos - Solar energy (%)
House heating fuel used in houses and condos - Other fuel (%)
House heating fuel used in houses and condos - No fuel used (%)
House heating fuel used in apartments - Utility gas (%)
House heating fuel used in apartments - Bottled, tank, or LP gas (%)
House heating fuel used in apartments - Electricity (%)
House heating fuel used in apartments - Fuel oil, kerosene, etc. (%)
House heating fuel used in apartments - Coal or coke (%)
House heating fuel used in apartments - Wood (%)
House heating fuel used in apartments - Solar energy (%)
House heating fuel used in apartments - Other fuel (%)
House heating fuel used in apartments - No fuel used (%)
Armed forces status - In Armed Forces (%)
Armed forces status - Civilian (%)
Armed forces status - Civilian - Veteran (%)
Armed forces status - Civilian - Nonveteran (%)
Fatal accidents locations in years 2005-2021
Fatal accidents locations in 2005
Fatal accidents locations in 2006
Fatal accidents locations in 2007
Fatal accidents locations in 2008
Fatal accidents locations in 2009
Fatal accidents locations in 2010
Fatal accidents locations in 2011
Fatal accidents locations in 2012
Fatal accidents locations in 2013
Fatal accidents locations in 2014
Fatal accidents locations in 2015
Fatal accidents locations in 2016
Fatal accidents locations in 2017
Fatal accidents locations in 2018
Fatal accidents locations in 2019
Fatal accidents locations in 2020
Fatal accidents locations in 2021
Alcohol use - People drinking some alcohol every month (%)
Alcohol use - People not drinking at all (%)
Alcohol use - Average days/month drinking alcohol
Alcohol use - Average drinks/week
Alcohol use - Average days/year people drink much
Audiometry - Average condition of hearing (%)
Audiometry - People that can hear a whisper from across a quiet room (%)
Audiometry - People that can hear normal voice from across a quiet room (%)
Audiometry - Ears ringing, roaring, buzzing (%)
Audiometry - Had a job exposure to loud noise (%)
Audiometry - Had off-work exposure to loud noise (%)
Blood Pressure & Cholesterol - Has high blood pressure (%)
Blood Pressure & Cholesterol - Checking blood pressure at home (%)
Blood Pressure & Cholesterol - Frequently checking blood cholesterol (%)
Blood Pressure & Cholesterol - Has high cholesterol level (%)
Consumer Behavior - Money monthly spent on food at supermarket/grocery store
Consumer Behavior - Money monthly spent on food at other stores
Consumer Behavior - Money monthly spent on eating out
Consumer Behavior - Money monthly spent on carryout/delivered foods
Consumer Behavior - Income spent on food at supermarket/grocery store (%)
Consumer Behavior - Income spent on food at other stores (%)
Consumer Behavior - Income spent on eating out (%)
Consumer Behavior - Income spent on carryout/delivered foods (%)
Current Health Status - General health condition (%)
Current Health Status - Blood donors (%)
Current Health Status - Has blood ever tested for HIV virus (%)
Current Health Status - Left-handed people (%)
Dermatology - People using sunscreen (%)
Diabetes - Diabetics (%)
Diabetes - Had a blood test for high blood sugar (%)
Diabetes - People taking insulin (%)
Diet Behavior & Nutrition - Diet health (%)
Diet Behavior & Nutrition - Milk product consumption (# of products/month)
Diet Behavior & Nutrition - Meals not home prepared (#/week)
Diet Behavior & Nutrition - Meals from fast food or pizza place (#/week)
Diet Behavior & Nutrition - Ready-to-eat foods (#/month)
Diet Behavior & Nutrition - Frozen meals/pizza (#/month)
Drug Use - People that ever used marijuana or hashish (%)
Drug Use - Ever used hard drugs (%)
Drug Use - Ever used any form of cocaine (%)
Drug Use - Ever used heroin (%)
Drug Use - Ever used methamphetamine (%)
Health Insurance - People covered by health insurance (%)
Kidney Conditions-Urology - Avg. # of times urinating at night
Medical Conditions - People with asthma (%)
Medical Conditions - People with anemia (%)
Medical Conditions - People with psoriasis (%)
Medical Conditions - People with overweight (%)
Medical Conditions - Elderly people having difficulties in thinking or remembering (%)
Medical Conditions - People who ever received blood transfusion (%)
Medical Conditions - People having trouble seeing even with glass/contacts (%)
Medical Conditions - People with arthritis (%)
Medical Conditions - People with gout (%)
Medical Conditions - People with congestive heart failure (%)
Medical Conditions - People with coronary heart disease (%)
Medical Conditions - People with angina pectoris (%)
Medical Conditions - People who ever had heart attack (%)
Medical Conditions - People who ever had stroke (%)
Medical Conditions - People with emphysema (%)
Medical Conditions - People with thyroid problem (%)
Medical Conditions - People with chronic bronchitis (%)
Medical Conditions - People with any liver condition (%)
Medical Conditions - People who ever had cancer or malignancy (%)
Mental Health - People who have little interest in doing things (%)
Mental Health - People feeling down, depressed, or hopeless (%)
Mental Health - People who have trouble sleeping or sleeping too much (%)
Mental Health - People feeling tired or having little energy (%)
Mental Health - People with poor appetite or overeating (%)
Mental Health - People feeling bad about themself (%)
Mental Health - People who have trouble concentrating on things (%)
Mental Health - People moving or speaking slowly or too fast (%)
Mental Health - People having thoughts they would be better off dead (%)
Oral Health - Average years since last visit a dentist
Oral Health - People embarrassed because of mouth (%)
Oral Health - People with gum disease (%)
Oral Health - General health of teeth and gums (%)
Oral Health - Average days a week using dental floss/device
Oral Health - Average days a week using mouthwash for dental problem
Oral Health - Average number of teeth
Pesticide Use - Households using pesticides to control insects (%)
Pesticide Use - Households using pesticides to kill weeds (%)
Physical Activity - People doing vigorous-intensity work activities (%)
Physical Activity - People doing moderate-intensity work activities (%)
Physical Activity - People walking or bicycling (%)
Physical Activity - People doing vigorous-intensity recreational activities (%)
Physical Activity - People doing moderate-intensity recreational activities (%)
Physical Activity - Average hours a day doing sedentary activities
Physical Activity - Average hours a day watching TV or videos
Physical Activity - Average hours a day using computer
Physical Functioning - People having limitations keeping them from working (%)
Physical Functioning - People limited in amount of work they can do (%)
Physical Functioning - People that need special equipment to walk (%)
Physical Functioning - People experiencing confusion/memory problems (%)
Physical Functioning - People requiring special healthcare equipment (%)
Prescription Medications - Average number of prescription medicines taking
Preventive Aspirin Use - Adults 40+ taking low-dose aspirin (%)
Reproductive Health - Vaginal deliveries (%)
Reproductive Health - Cesarean deliveries (%)
Reproductive Health - Deliveries resulted in a live birth (%)
Reproductive Health - Pregnancies resulted in a delivery (%)
Reproductive Health - Women breastfeeding newborns (%)
Reproductive Health - Women that had a hysterectomy (%)
Reproductive Health - Women that had both ovaries removed (%)
Reproductive Health - Women that have ever taken birth control pills (%)
Reproductive Health - Women taking birth control pills (%)
Reproductive Health - Women that have ever used Depo-Provera or injectables (%)
Reproductive Health - Women that have ever used female hormones (%)
Sexual Behavior - People 18+ that ever had sex (vaginal, anal, or oral) (%)
Sexual Behavior - Males 18+ that ever had vaginal sex with a woman (%)
Sexual Behavior - Males 18+ that ever performed oral sex on a woman (%)
Sexual Behavior - Males 18+ that ever had anal sex with a woman (%)
Sexual Behavior - Males 18+ that ever had any sex with a man (%)
Sexual Behavior - Females 18+ that ever had vaginal sex with a man (%)
Sexual Behavior - Females 18+ that ever performed oral sex on a man (%)
Sexual Behavior - Females 18+ that ever had anal sex with a man (%)
Sexual Behavior - Females 18+ that ever had any kind of sex with a woman (%)
Sexual Behavior - Average age people first had sex
Sexual Behavior - Average number of female sex partners in lifetime (males 18+)
Sexual Behavior - Average number of female vaginal sex partners in lifetime (males 18+)
Sexual Behavior - Average age people first performed oral sex on a woman (18+)
Sexual Behavior - Average number of woman performed oral sex on in lifetime (18+)
Sexual Behavior - Average number of male sex partners in lifetime (males 18+)
Sexual Behavior - Average number of male anal sex partners in lifetime (males 18+)
Sexual Behavior - Average age people first performed oral sex on a man (18+)
Sexual Behavior - Average number of male oral sex partners in lifetime (18+)
Sexual Behavior - People using protection when performing oral sex (%)
Sexual Behavior - Average number of times people have vaginal or anal sex a year
Sexual Behavior - People having sex without condom (%)
Sexual Behavior - Average number of male sex partners in lifetime (females 18+)
Sexual Behavior - Average number of male vaginal sex partners in lifetime (females 18+)
Sexual Behavior - Average number of female sex partners in lifetime (females 18+)
Sexual Behavior - Circumcised males 18+ (%)
Sleep Disorders - Average hours sleeping at night
Sleep Disorders - People that has trouble sleeping (%)
Smoking-Cigarette Use - People smoking cigarettes (%)
Taste & Smell - People 40+ having problems with smell (%)
Taste & Smell - People 40+ having problems with taste (%)
Taste & Smell - People 40+ that ever had wisdom teeth removed (%)
Taste & Smell - People 40+ that ever had tonsils teeth removed (%)
Taste & Smell - People 40+ that ever had a loss of consciousness because of a head injury (%)
Taste & Smell - People 40+ that ever had a broken nose or other serious injury to face or skull (%)
Taste & Smell - People 40+ that ever had two or more sinus infections (%)
Weight - Average height (inches)
Weight - Average weight (pounds)
Weight - Average BMI
Weight - People that are obese (%)
Weight - People that ever were obese (%)
Weight - People trying to lose weight (%)
Urban population: 34,708
Rural population: 6,645
Estimated median house/condo value in 2022: $160,727
78221:
$160,727Texas:
$275,400
Median resident age: This zip code:
35.4 yearsTexas median age:
35.6 years
Average household size: This zip code:
3.0 peopleTexas:
2.6 people
Averages for the 2020 tax year for zip code 78221, filed in 2021:
Average Adjusted Gross Income (AGI) in 2020: $36,608 (Individual Income Tax Returns) Here:
$36,608State:
$77,054
Salary/wage: $35,256 (reported on 83.7% of returns )Here:
$35,256State:
$62,766
(% of AGI for various income ranges: 1134.9% for AGIs below $25k , 3411.6% for AGIs $25k-50k , 6309.1% for AGIs $50k-75k , 9117.9% for AGIs $75k-100k , 14562.4% for AGIs $100k-200k ) Taxable interest for individuals: $667 (reported on 10.1% of returns )This zip code:
$667Texas:
$2,665
(% of AGI for various income ranges: 3.5% for AGIs below $25k , 6.4% for AGIs $25k-50k , 9.2% for AGIs $50k-75k , 9.2% for AGIs $75k-100k , 19.1% for AGIs $100k-200k ) Ordinary dividends: $1,342 (reported on 2.7% of returns )(% of AGI for various income ranges: 1.6% for AGIs below $25k , 1.6% for AGIs $25k-50k , 3.4% for AGIs $50k-75k , 6.8% for AGIs $75k-100k , 63.8% for AGIs $100k-200k ) Net capital gain/loss in AGI: +$5,332 (reported on 2.9% of returns )Here:
+$5,332State:
+$39,590
(% of AGI for various income ranges: 0.8% for AGIs below $25k , 4.1% for AGIs $25k-50k , 20.6% for AGIs $50k-75k , 44.2% for AGIs $75k-100k , 310.2% for AGIs $100k-200k ) Profit/loss from business: +$6,718 (reported on 18.1% of returns )Here:
+$6,718State:
+$10,888
(% of AGI for various income ranges: 170.6% for AGIs below $25k , 86.0% for AGIs $25k-50k , 102.8% for AGIs $50k-75k , 122.1% for AGIs $75k-100k , 626.0% for AGIs $100k-200k ) Taxable individual retirement arrangement distribution: $8,835 (reported on 2.5% of returns )78221:
$8,835Texas:
$24,740
(% of AGI for various income ranges: 12.6% for AGIs below $25k , 20.4% for AGIs $25k-50k , 41.7% for AGIs $50k-75k , 95.8% for AGIs $75k-100k , 96.0% for AGIs $100k-200k ) Total itemized deductions: $28,779 (reported on 2.5% of returns )Here:
$28,779State:
$40,428
(% of AGI for various income ranges: 6.9% for AGIs below $25k , 53.7% for AGIs $25k-50k , 196.9% for AGIs $50k-75k , 331.8% for AGIs $75k-100k , 585.5% for AGIs $100k-200k ) Charity contributions: $7,800 (reported on 2.1% of returns )(% of AGI for various income ranges: 14.9% for AGIs $25k-50k , 32.6% for AGIs $50k-75k , 65.6% for AGIs $75k-100k , 179.6% for AGIs $100k-200k ) Taxes paid: $6,777 (reported on 2.5% of returns )(% of AGI for various income ranges: 14.7% for AGIs $25k-50k , 49.3% for AGIs $50k-75k , 71.5% for AGIs $75k-100k , 136.0% for AGIs $100k-200k ) Earned income credit: $2,713 (reported on 31.1% of returns )(% of AGI for various income ranges: 156.6% for AGIs below $25k , 97.7% for AGIs $25k-50k , 1.2% for AGIs $50k-75k ) Percentage of individuals using paid preparers for their 2020 taxes: 92.6%(% for various income ranges: 91.2% for AGIs below $25k , 94.2% for AGIs $25k-50k , 93.4% for AGIs $50k-75k , 93.4% for AGIs $75k-100k , 92.3% for AGIs $100k-200k , 83.3% for AGIs over 200k )
Averages for the 2012 tax year for zip code 78221, filed in 2013:
Average Adjusted Gross Income (AGI) in 2012: $29,581 (Individual Income Tax Returns) Here:
$29,581State:
$65,384
Salary/wage: $28,246 (reported on 85.7% of returns )Here:
$28,246State:
$52,524
(% of AGI for various income ranges: 77.1% for AGIs below $25k , 86.7% for AGIs $25k-50k , 84.4% for AGIs $50k-75k , 86.4% for AGIs $75k-100k , 79.6% for AGIs $100k-200k , 27.3% for AGIs over 200k ) Taxable interest for individuals: $573 (reported on 11.0% of returns )This zip code:
$573Texas:
$2,372
(% of AGI for various income ranges: 0.2% for AGIs below $25k , 0.2% for AGIs $25k-50k , 0.2% for AGIs $50k-75k , 0.2% for AGIs $75k-100k , 0.2% for AGIs $100k-200k , 1.0% for AGIs over 200k ) Ordinary dividends: $1,267 (reported on 2.7% of returns )(% of AGI for various income ranges: 0.1% for AGIs $25k-50k , 0.1% for AGIs $50k-75k , 0.2% for AGIs $100k-200k ) Net capital gain/loss in AGI: +$2,077 (reported on 1.7% of returns )Here:
+$2,077State:
+$35,319
(% of AGI for various income ranges: 0.1% for AGIs $50k-75k , 0.2% for AGIs $75k-100k , 0.4% for AGIs $100k-200k ) Profit/loss from business: +$9,831 (reported on 14.9% of returns )Here:
+$9,831State:
+$13,732
(% of AGI for various income ranges: 12.8% for AGIs below $25k , 2.4% for AGIs $25k-50k , 1.1% for AGIs $50k-75k , 1.1% for AGIs $75k-100k , 7.9% for AGIs $100k-200k ) Taxable individual retirement arrangement distribution: $9,359 (reported on 3.3% of returns )78221:
$9,359Texas:
$19,511
(% of AGI for various income ranges: 0.9% for AGIs below $25k , 0.7% for AGIs $25k-50k , 1.3% for AGIs $50k-75k , 1.5% for AGIs $75k-100k , 2.5% for AGIs $100k-200k ) Total itemized deductions: $17,110 (27% of AGI, reported on 8.0% of returns )Here:
$17,110State:
$24,724
Here:
27.0% of AGIState:
15.9% of AGI
(% of AGI for various income ranges: 1.9% for AGIs below $25k , 4.0% for AGIs $25k-50k , 6.4% for AGIs $50k-75k , 6.8% for AGIs $75k-100k , 10.2% for AGIs $100k-200k ) Charity contributions: $3,005 (reported on 5.0% of returns )(% of AGI for various income ranges: 0.1% for AGIs below $25k , 0.3% for AGIs $25k-50k , 0.8% for AGIs $50k-75k , 1.1% for AGIs $75k-100k , 1.1% for AGIs $100k-200k ) Taxes paid: $4,312 (reported on 7.5% of returns )(% of AGI for various income ranges: 0.3% for AGIs below $25k , 0.9% for AGIs $25k-50k , 1.4% for AGIs $50k-75k , 1.6% for AGIs $75k-100k , 3.5% for AGIs $100k-200k ) Earned income credit: $2,715 (reported on 39.0% of returns )(% of AGI for various income ranges: 11.5% for AGIs below $25k , 2.1% for AGIs $25k-50k ) Percentage of individuals using paid preparers for their 2012 taxes: 50.0%(% for various income ranges: 50.0% for AGIs below $25k , 48.7% for AGIs $25k-50k , 51.4% for AGIs $50k-75k , 52.8% for AGIs $75k-100k , 53.6% for AGIs $100k-200k , 100.0% for AGIs over 200k )
Averages for the 2004 tax year for zip code 78221, filed in 2005:
Average Adjusted Gross Income (AGI) in 2004: $23,472 (Individual Income Tax Returns) Here:
$23,472State:
$47,881
Salary/wage: $22,555 (reported on 87.3% of returns )Here:
$22,555State:
$41,947
(% of AGI for various income ranges: 87.2% for AGIs below $10k , 83.3% for AGIs $10k-25k , 86.4% for AGIs $25k-50k , 84.8% for AGIs $50k-75k , 79.9% for AGIs $75k-100k , 63.2% for AGIs over 100k ) Taxable interest for individuals: $985 (reported on 15.4% of returns )This zip code:
$985Texas:
$2,255
(% of AGI for various income ranges: 0.9% for AGIs below $10k , 0.4% for AGIs $10k-25k , 0.4% for AGIs $25k-50k , 0.6% for AGIs $50k-75k , 0.4% for AGIs $75k-100k , 4.6% for AGIs over 100k ) Taxable dividends: $734 (reported on 3.8% of returns )(% of AGI for various income ranges: 0.2% for AGIs below $10k , 0.1% for AGIs $10k-25k , 0.1% for AGIs $25k-50k , 0.2% for AGIs $50k-75k , 0.1% for AGIs $75k-100k , 0.1% for AGIs over 100k ) Net capital gain/loss: +$4,054 (reported on 2.9% of returns )Here:
+$4,054State:
+$16,110
(% of AGI for various income ranges: -0.2% for AGIs below $10k , 0.1% for AGIs $10k-25k , 0.2% for AGIs $25k-50k , 0.6% for AGIs $50k-75k , 1.0% for AGIs $75k-100k , 5.9% for AGIs over 100k ) Profit/loss from business: +$6,660 (reported on 13.1% of returns )Here:
+$6,660State:
+$11,013
(% of AGI for various income ranges: 10.7% for AGIs below $10k , 5.8% for AGIs $10k-25k , 2.3% for AGIs $25k-50k , 1.4% for AGIs $50k-75k , 4.6% for AGIs $75k-100k ) IRA payment deduction: $2,753 (reported on 0.6% of returns )Total itemized deductions: $13,402 (27% of AGI, reported on 4.9% of returns )Here:
$13,402State:
$19,631
Here:
27.2% of AGIState:
18.9% of AGI
(% of AGI for various income ranges: 1.3% for AGIs below $10k , 1.2% for AGIs $10k-25k , 2.8% for AGIs $25k-50k , 4.4% for AGIs $50k-75k , 5.6% for AGIs $75k-100k , 5.4% for AGIs over 100k ) Charity contributions deductions: $2,597 (5% of AGI, reported on 3.7% of returns )Here:
5.1% of AGIState:
4.2% of AGI
(% of AGI for various income ranges: 0.1% for AGIs below $10k , 0.2% for AGIs $10k-25k , 0.4% for AGIs $25k-50k , 0.7% for AGIs $50k-75k , 0.9% for AGIs $75k-100k , 1.0% for AGIs over 100k ) Total tax: $2,390 (reported on 58.6% of returns )(% of AGI for various income ranges: 2.9% for AGIs below $10k , 3.1% for AGIs $10k-25k , 5.6% for AGIs $25k-50k , 8.4% for AGIs $50k-75k , 11.2% for AGIs $75k-100k , 17.3% for AGIs over 100k ) Earned income credit: $2,125 (reported on 40.0% of returns )Percentage of individuals using paid preparers for their 2004 taxes: 59.6%(% for various income ranges: 56.9% for AGIs below $10k , 63.3% for AGIs $10k-25k , 57.5% for AGIs $25k-50k , 55.2% for AGIs $50k-75k , 54.4% for AGIs $75k-100k , 67.7% for AGIs over 100k )
Estimated median household income in 2022: This zip code:
$56,621Texas:
$72,284
Nearest zip codes: 78214 ,
78224 ,
78235 ,
78264 ,
78223 ,
78211 .
San Antonio Zip Code Map
Percentage of family households: This zip code:
52.8%Texas:
50.5%
Percentage of households with unmarried partners: This zip code:
5.0%Texas:
48.7%
Likely homosexual households (counted as self-reported same-sex unmarried-partner households)
Lesbian couples: 0.2% of all households Gay men: 0.1% of all households
Household received Food Stamps/SNAP in the past 12 months: 2,898Household did not receive Food Stamps/SNAP in the past 12 months: 10,925
Women who had a birth in the past 12 months: 611 (272 now married , 329 unmarried) Women who did not have a birth in the past 12 months: 9,303 (3,570 now married , 5,749 unmarried)
Housing units in zip code 78221 with a mortgage: 4,407 (81
second mortgage , 87
both second mortgage and home equity loan )
Houses without a mortgage: 96
Median monthly owner costs for units with a mortgage: $1,356
Median monthly owner costs for units without a mortgage: $460
Residents with income below the poverty level in 2022:
This zip code:
18.2%Whole state:
14.0%
Residents with income below 50% of the poverty level in 2022:
This zip code:
11.3%Whole state:
7.4%
Median number of rooms in houses and condos: Median number of rooms in apartments: Notable locations in this zip code not listed on our city pages
Click to draw/clear zip code borders Notable locations in zip code 78221: (A) , Creative Little Minds (B) , Harlandale Independent School District Police Department (C) , San Antonio Fire Department Station 2 (D) , South Bexar Volunteer Fire and Rescue Department (E) . Display/hide their locations on the map
Churches in zip code 78221 include: (A) , Southside Church of God (B) , Church of God of Prophecy (C) , Southside Church of God (D) , Thelma Church (E) , Jehovahs Witnesses Church (F) , Holy Cross Episcopal Church (G) , Pentecostal Home Missionary Church (H) , Bible Baptist Church (I) . Display/hide their locations on the map
Reservoirs: (A) , Mitchell Lake (B) , Canvasback Lake (C) , Blue Wing Lake (D) . Display/hide their locations on the map
Creeks: (A) , Losoya Creek (B) . Display/hide their locations on the map
Parks in zip code 78221 include: (1) , Bellaire Park (2) , Forge Park (3) , Kingsborough Park (4) , Southcross Park (5) , Southside Stadium (6) . Display/hide their locations on the map
Tourist attraction (not listed on the city page) : (1) . Display/hide its approximate location on the map
Year house built (houses)
261 2020 or later2,054 2010 to 20191,779 2000 to 2009770 1990 to 19991,366 1980 to 19891,957 1970 to 19792,129 1960 to 19692,920 1950 to 1959834 1940 to 1949352 1939 or earlier
Zip code 78221 household income distribution in 2022 787 Less than $10,000786 $10,000 to $14,999600 $15,000 to $19,999837 $20,000 to $24,999724 $25,000 to $29,999791 $30,000 to $34,999571 $35,000 to $39,999580 $40,000 to $44,999411 $45,000 to $49,9991,110 $50,000 to $59,9991,657 $60,000 to $74,9992,312 $75,000 to $99,9991,220 $100,000 to $124,999834 $125,000 to $149,999379 $150,000 to $199,999161 $200,000 or moreEstimate of home value of owner-occupied houses/condos in 2022 in zip code 78221 151 Less than $10,00049 $10,000 to $14,99941 $15,000 to $19,99959 $20,000 to $24,9996 $30,000 to $34,99946 $35,000 to $39,99959 $40,000 to $49,999172 $50,000 to $59,999306 $60,000 to $69,999417 $70,000 to $79,999608 $80,000 to $89,999486 $90,000 to $99,9991,078 $100,000 to $124,999466 $125,000 to $149,9991,181 $150,000 to $174,999739 $175,000 to $199,999874 $200,000 to $249,999688 $250,000 to $299,999204 $300,000 to $399,99984 $400,000 to $499,99981 $750,000 to $999,99991 $1,000,000 to $1,499,999126 $2,000,000 or moreRent paid by renters in 2022 in zip code 78221 13 Less than $10050 $100 to $149101 $150 to $199100 $200 to $2495 $250 to $29921 $350 to $39924 $400 to $44952 $450 to $49934 $500 to $549173 $550 to $599190 $600 to $649234 $650 to $699383 $700 to $749401 $750 to $799612 $800 to $899402 $900 to $999712 $1,000 to $1,249152 $1,250 to $1,499366 $1,500 to $1,99918 $3,500 or more172 No cash rent
Median gross rent in 2022: $1,076.
Median price asked for vacant for-sale houses and condos in 2022: $144,004.
Estimated median house (or condo) value in 2022 for: White Non-Hispanic householders: $166,706Black or African American householders: $193,435American Indian or Alaska Native householders: $203,634Asian householders: $209,613Some other race householders: $158,265Two or more races householders: $163,540Hispanic or Latino householders: $160,727Estimated median house or condo value in 2022: $160,727
78221:
$160,727Texas:
$275,400
Lower value quartile - upper value quartile: $108,570 - $221,358
Mean price in 2022: Detached houses: $257,450Here:
$257,450State:
$369,058
Townhouses or other attached units: $278,164Here:
$278,164State:
$327,631
In 2-unit structures: $323,201Here:
$323,201State:
$374,947
In 3-to-4-unit structures: $186,623Here:
$186,623State:
$209,652
In 5-or-more-unit structures: $209,743Here:
$209,743State:
$413,944
Mobile homes: $81,302Here:
$81,302State:
$124,413
Occupied boats, RVs, vans, etc.: $105,053Here:
$105,053State:
$73,921
Housing units in structures:
One, detached: 11,791One, attached: 130Two: 1263 or 4: 3975 to 9: 79710 to 19: 42520 to 49: 36250 or more: 314Mobile homes: 576Boats, RVs, vans, etc.: 38Unemployment : 4.9%
Means of transportation to work in zip code 78221 67.5% 12,745 Drove a car alone19.5% 3,686 Carpooled2.0% 370 Bus or trolley bus0.2% 38 Motorcycle1.6% 300 Walked1.5% 284 Other means5.9% 1,120 Worked at homeTravel time to work (commute) in zip code 78221 409 Less than 5 minutes1,462 5 to 9 minutes1,799 10 to 14 minutes2,554 15 to 19 minutes2,597 20 to 24 minutes1,443 25 to 29 minutes2,826 30 to 34 minutes500 35 to 39 minutes814 40 to 44 minutes1,286 45 to 59 minutes1,434 60 to 89 minutes184 90 or more minutes
Percentage of zip code residents living and working in this county: 94.6%
Household type by relationship:
Households: 41,354
Male householders: 6,428 (1,314 living alone ), Female householders: 7,344 (1,513 living alone )6,127 spouses (6,061 opposite-sex spouses ), 1,506 unmarried partners , (1,420 opposite-sex unmarried partners ), 14,325 children (13,349 natural , 115 adopted , 860 stepchildren ), 2,623 grandchildren , 492 brothers or sisters , 684 parents , 0 foster children , 1,044 other relatives , 660 non-relatives In group quarters: 147 (-1 institutionalized population )
Size of family households: 3,173 2-persons , 2,575 3-persons , 2,109 4-persons , 1,504 5-persons , 534 6-persons , 274 7-or-more-persons
Size of nonfamily households: 2,827 1-person , 624 2-persons , 27 3-persons , 46 4-persons
5,018 married couples with children. single-parent households (842 men , 2,488 women ).
44.6% of residents of 78221 zip code speak English at home. of residents speak Spanish at home (69% very well, 15% well, 9% not well, 7% not at all ).of residents speak other Indo-European language at home (45% very well, 55% well ).of residents speak Asian or Pacific Island language at home (92% very well, 5% not well, 3% not at all ).
Foreign born population: 6,620 (16.0%)
(42.8%
of them are naturalized citizens )
This zip code:
16.0%Whole state:
17.2%
84% Honduras 4% Guatemala 3% Bhutan 2% Costa Rica 1% Kazakhstan 1% El Salvador 1% Romania 8% American 2% German 1% English 1% Irish 0% French 0% Italian 0% European
Year of entry for the foreign-born population
1,415 2010 or later 1,570 2000 to 2009 1,210 1990 to 1999 2,635 Before 1990
There are
126 Medical Specialists in Zip Code 78221 .
Facilities with environmental interests located in this zip code:
ALAMO ENVIRONMENTAL INC (17730 STATE HIGHWAY 16 S in SAN ANTONIO, TX)
Conditionally Exempt Small Quantity Generators, less than 100 kg/month of hazardous waste (Resource Conservation and Recovery Act (tracking hazardous waste)) TRANSPORTER (Resource Conservation and Recovery Act (tracking hazardous waste)) Alternative names: ALAMO PETROLEUM EXCHANGE
ALAMO DOG & CAT HOSPITAL (1619 PLEASANTON RD in SAN ANTONIO, TX)
(Resource Conservation and Recovery Act (tracking hazardous waste))
Housing units lacking complete plumbing facilities: 2.1%
Housing units lacking complete kitchen facilities: 3.2%
61.7% Electricity 35.7% Utility gas 1.6% No fuel used 0.9% Bottled, tank, or LP gas
Population in 1990: 35,392. Population change in the 1990s: +1,497 (+4.2%).
Place of birth for U.S.-born residents:
This state: 31,672Northeast: 292Midwest: 700South: 486West: 806
63% of the 78221 zip code residents lived in the same house 5 years ago.
Out of people who lived in different houses, 86% lived in this county.
Out of people who lived in different counties, 50% lived in Texas.
93% of the 78221 zip code residents lived in the same house 1 year ago.
Out of people who lived in different houses, 78% moved from this county.
Out of people who lived in different houses, 12% moved from different county within same state.
Out of people who lived in different houses, 3% moved from different state.
Out of people who lived in different houses, 4% moved from abroad.
Private vs. public school enrollment:
Students in private schools in grades 1 to 8 (elementary and middle school): 277
Students in private schools in grades 9 to 12 (high school): 43
Students in private undergraduate colleges: 247
Occupation by median earnings in the past 12 months ($)
70,508 Computer and mathematical occupations 57,423 Management occupations 56,911 Business and financial operations occupations 53,156 Education, training, and library occupations 51,511 Installation, maintenance, and repair occupations 51,021 Health technologists and technicians
Companies with federal contracts located in this zip code:
REYES INDUSTRIES, INC (1554 CANTRELL DR in SAN ANTONIO, TX; small business) in 106 contracts from 1999 to 2006
Contracts for Household Furniture, Individual Equipment, Clothing, Special Purpose, Safety and Rescue Equipment, and more by Defense Logistics Agency, Army, Air Force, Navy, and others Signed by year: 2000: $5,128,860; 2001: $7,762,701; 2002: $4,394,483; 2003: $5,696,085; 2004: $18,518,908; 2005: $21,659,542; 2006: $1,886,000.
Biggest contracts: with Defense Logistics Agency for Household Furniture. Signed on 2005-09-13. Completion date: 2005-12-31.
, same as above. Signed on 2004-11-25. Completion date: 2004-12-30.
with Defense Logistics Agency for Individual Equipment. Signed on 2004-03-10. Completion date: 2005-11-09.
with Defense Logistics Agency for Clothing, Special Purpose. Signed on 2000-06-15. Completion date: 2001-11-01.
C L BLANKENSHIP INC (503 W CHAVANEAUX RD in SAN ANTONIO, TX; small business) in 21 contracts from 2003 to 2005
Contracts for Compressors and Vacuum Pumps, Maintenance, Repair and Rebuilding of Equipment -- Communication, Detection, and Coherent Radiation Equipment, Telephone and Telegraph Equipment, ADP Supplies, and more by Defense Logistics Agency, ArmySigned by year: 2000: $0; 2001: $0; 2002: $0; 2003: $18,570; 2004: $10,653; 2005: $50,082; 2006: $0.
Biggest contracts: with Defense Logistics Agency for Compressors and Vacuum Pumps. Signed on 2005-12-07. Completion date: 2006-03-07.
with Army for Maintenance, Repair and Rebuilding of Equipment -- Communication, Detection, and Coherent Radiation Equipment. Signed on 2003-12-04. Completion date: 2004-09-30.
with Army for Telephone and Telegraph Equipment. Signed on 2003-06-23. Completion date: 2003-09-30.
, same as above. Signed on 2003-05-30. Completion date: 2003-09-30.
Top industries in this zip code by the number of employees in 2005:
Management of Companies and Enterprises: Corporate, Subsidiary, and Regional Managing Offices (over 1000 employees: 1 establishment, 20-49 employees: 1 establishment)Accommodation and Food Services: Limited-Service Restaurants (50-99: 3, 20-49: 13, 10-19: 7, 5-9: 4, 1-4: 2)Accommodation and Food Services: Full-Service Restaurants (100-249: 3, 50-99: 1, 10-19: 6, 5-9: 3, 1-4: 6)Health Care and Social Assistance: Nursing Care Facilities (50-99: 3)Health Care and Social Assistance: Offices of Physicians (except Mental Health Specialists) (20-49: 3, 10-19: 3, 5-9: 7, 1-4: 9)Health Care and Social Assistance: Child Day Care Services (50-99: 1, 10-19: 7, 5-9: 2, 1-4: 6)Administrative and Support and Waste Management and Remediation Services: Temporary Help Services (50-99: 2, 1-4: 1)Health Care and Social Assistance: Offices of Dentists (20-49: 1, 10-19: 4, 5-9: 5, 1-4: 5)
People in group quarters in 2010:
143 people in nursing facilities/skilled-nursing facilities
38 people in workers' group living quarters and job corps centers
People in group quarters in 2000:
208 people in nursing homes
72 people in homes for the mentally retarded
35 people in homes for the mentally ill
5 people in religious group quarters
Fatal accident statistics in 2014:
Fatal accident count: 5Vehicles involved in fatal accidents: 6Fatal accidents caused by drunken drivers: 2Fatalities: 5Persons involved in fatal accidents: 11Pedestrians involved in fatal accidents: 2
Fatal accident statistics in 2013:
Fatal accident count: 7Vehicles involved in fatal accidents: 11Fatal accidents caused by drunken drivers: 1Fatalities: 8Persons involved in fatal accidents: 23Pedestrians involved in fatal accidents: 3
Home Mortgage Disclosure Act Aggregated Statistics For Year 2009(Based on 6 full and 16 partial tracts) A) FHA, FSA/RHS & VA B) Conventional C) Refinancings D) Home Improvement Loans E) Loans on Dwellings For 5+ Families F) Non-occupant Loans on G) Loans On Manufactured Number Average Value Number Average Value Number Average Value Number Average Value Number Average Value Number Average Value Number Average Value
LOANS ORIGINATED 137 $98,216 61 $72,583 153 $79,169 57 $40,174 1 $426,000 25 $53,605 27 $56,058 APPLICATIONS APPROVED, NOT ACCEPTED 6 $134,285 5 $78,282 26 $97,280 13 $23,143 0 $0 3 $14,103 8 $57,708 APPLICATIONS DENIED 21 $96,630 66 $57,971 214 $72,759 162 $28,826 1 $695,970 29 $52,566 28 $54,489 APPLICATIONS WITHDRAWN 27 $102,046 13 $76,892 67 $78,481 20 $45,294 0 $0 11 $57,535 1 $68,800 FILES CLOSED FOR INCOMPLETENESS 1 $142,880 4 $90,630 10 $74,716 5 $55,906 0 $0 2 $30,095 1 $71,430
Aggregated Statistics For Year 2008(Based on 6 full and 16 partial tracts) A) FHA, FSA/RHS & VA B) Conventional C) Refinancings D) Home Improvement Loans E) Loans on Dwellings For 5+ Families F) Non-occupant Loans on G) Loans On Manufactured Number Average Value Number Average Value Number Average Value Number Average Value Number Average Value Number Average Value Number Average Value
LOANS ORIGINATED 132 $105,344 104 $89,837 209 $67,757 105 $34,168 1 $681,050 44 $66,900 16 $64,693 APPLICATIONS APPROVED, NOT ACCEPTED 12 $119,942 33 $71,195 58 $63,086 33 $28,818 0 $0 8 $52,041 17 $60,712 APPLICATIONS DENIED 29 $104,017 109 $73,734 405 $72,773 337 $31,295 2 $475,000 59 $64,525 57 $49,969 APPLICATIONS WITHDRAWN 36 $127,670 28 $94,902 92 $76,565 25 $37,889 0 $0 19 $55,907 3 $90,677 FILES CLOSED FOR INCOMPLETENESS 13 $105,673 10 $110,016 22 $71,970 11 $36,560 0 $0 0 $0 1 $25,480
Aggregated Statistics For Year 2007(Based on 6 full and 16 partial tracts) A) FHA, FSA/RHS & VA B) Conventional C) Refinancings D) Home Improvement Loans E) Loans on Dwellings For 5+ Families F) Non-occupant Loans on G) Loans On Manufactured Number Average Value Number Average Value Number Average Value Number Average Value Number Average Value Number Average Value Number Average Value
LOANS ORIGINATED 106 $103,522 355 $80,730 298 $70,656 138 $36,139 6 $4,618,007 102 $71,643 39 $69,707 APPLICATIONS APPROVED, NOT ACCEPTED 16 $91,382 75 $72,783 70 $58,888 40 $26,023 0 $0 17 $100,379 28 $52,845 APPLICATIONS DENIED 26 $101,025 208 $70,037 621 $70,385 327 $32,150 0 $0 98 $66,183 86 $57,379 APPLICATIONS WITHDRAWN 13 $119,396 53 $82,705 197 $69,918 35 $43,599 1 $1,120,000 27 $70,395 9 $76,567 FILES CLOSED FOR INCOMPLETENESS 3 $121,403 30 $91,391 54 $77,743 5 $50,222 0 $0 12 $68,031 1 $63,610
Aggregated Statistics For Year 2006(Based on 6 full and 16 partial tracts) A) FHA, FSA/RHS & VA B) Conventional C) Refinancings D) Home Improvement Loans E) Loans on Dwellings For 5+ Families F) Non-occupant Loans on G) Loans On Manufactured Number Average Value Number Average Value Number Average Value Number Average Value Number Average Value Number Average Value Number Average Value
LOANS ORIGINATED 109 $95,109 453 $68,064 431 $63,973 158 $29,952 4 $910,952 164 $65,087 47 $63,682 APPLICATIONS APPROVED, NOT ACCEPTED 9 $85,282 140 $59,780 97 $63,060 36 $21,860 0 $0 27 $69,433 39 $45,204 APPLICATIONS DENIED 19 $82,484 344 $62,606 620 $61,250 344 $30,309 3 $347,217 113 $64,361 115 $54,751 APPLICATIONS WITHDRAWN 17 $103,401 142 $81,287 329 $65,420 43 $42,267 1 $875,000 37 $76,552 9 $49,852 FILES CLOSED FOR INCOMPLETENESS 3 $143,400 28 $94,802 43 $68,839 12 $25,756 0 $0 16 $88,764 0 $0
Aggregated Statistics For Year 2005(Based on 6 full and 16 partial tracts) A) FHA, FSA/RHS & VA B) Conventional C) Refinancings D) Home Improvement Loans E) Loans on Dwellings For 5+ Families F) Non-occupant Loans on G) Loans On Manufactured Number Average Value Number Average Value Number Average Value Number Average Value Number Average Value Number Average Value Number Average Value
LOANS ORIGINATED 103 $84,194 398 $58,406 431 $61,270 171 $56,201 10 $1,922,547 113 $54,759 55 $57,999 APPLICATIONS APPROVED, NOT ACCEPTED 8 $64,680 127 $51,062 107 $49,489 30 $29,722 0 $0 22 $50,076 55 $42,163 APPLICATIONS DENIED 30 $64,963 392 $52,609 645 $57,387 265 $25,372 2 $767,130 104 $55,197 181 $46,495 APPLICATIONS WITHDRAWN 5 $106,296 111 $71,805 337 $86,266 127 $123,870 1 $525,230 43 $69,410 14 $50,119 FILES CLOSED FOR INCOMPLETENESS 2 $62,000 28 $63,020 76 $84,693 1 $62,070 0 $0 5 $69,160 1 $128,400
Aggregated Statistics For Year 2004(Based on 6 full and 16 partial tracts) A) FHA, FSA/RHS & VA B) Conventional C) Refinancings D) Home Improvement Loans E) Loans on Dwellings For 5+ Families F) Non-occupant Loans on G) Loans On Manufactured Number Average Value Number Average Value Number Average Value Number Average Value Number Average Value Number Average Value Number Average Value
LOANS ORIGINATED 141 $81,647 277 $55,797 552 $55,157 119 $26,517 5 $1,190,442 93 $52,911 64 $60,438 APPLICATIONS APPROVED, NOT ACCEPTED 8 $80,499 97 $51,068 140 $53,530 45 $25,891 0 $0 18 $50,751 51 $45,570 APPLICATIONS DENIED 25 $92,301 288 $49,854 665 $52,174 297 $21,973 0 $0 66 $42,939 183 $44,710 APPLICATIONS WITHDRAWN 16 $89,768 52 $68,335 312 $58,411 31 $25,835 1 $59,770 20 $53,805 11 $62,962 FILES CLOSED FOR INCOMPLETENESS 5 $76,758 13 $65,978 90 $69,363 3 $50,027 0 $0 7 $90,944 1 $47,320
Aggregated Statistics For Year 2003(Based on 6 full and 16 partial tracts) A) FHA, FSA/RHS & VA B) Conventional C) Refinancings D) Home Improvement Loans E) Loans on Dwellings For 5+ Families F) Non-occupant Loans on Number Average Value Number Average Value Number Average Value Number Average Value Number Average Value Number Average Value
LOANS ORIGINATED 150 $78,163 206 $57,250 670 $50,262 100 $19,135 1 $341,850 82 $48,021 APPLICATIONS APPROVED, NOT ACCEPTED 10 $70,892 40 $57,848 119 $50,430 37 $19,194 0 $0 20 $37,983 APPLICATIONS DENIED 24 $75,718 195 $50,121 695 $48,426 200 $16,115 0 $0 75 $42,244 APPLICATIONS WITHDRAWN 30 $102,347 41 $68,450 337 $51,193 19 $24,087 0 $0 10 $49,379 FILES CLOSED FOR INCOMPLETENESS 1 $46,880 21 $66,367 44 $48,447 2 $26,365 0 $0 7 $66,316
Aggregated Statistics For Year 2002(Based on 6 full and 16 partial tracts) A) FHA, FSA/RHS & VA B) Conventional C) Refinancings D) Home Improvement Loans E) Loans on Dwellings For 5+ Families F) Non-occupant Loans on Number Average Value Number Average Value Number Average Value Number Average Value Number Average Value Number Average Value
LOANS ORIGINATED 126 $67,818 203 $51,371 427 $46,590 88 $17,179 2 $1,981,025 58 $44,104 APPLICATIONS APPROVED, NOT ACCEPTED 5 $63,530 55 $58,226 102 $43,142 30 $20,060 0 $0 16 $40,108 APPLICATIONS DENIED 27 $68,942 230 $49,731 475 $40,537 199 $16,154 0 $0 41 $39,219 APPLICATIONS WITHDRAWN 16 $66,743 26 $75,581 220 $47,268 15 $38,706 4 $1,763,768 22 $44,763 FILES CLOSED FOR INCOMPLETENESS 5 $82,448 27 $49,441 41 $59,276 2 $28,740 0 $0 4 $57,500
Aggregated Statistics For Year 2001(Based on 6 full and 16 partial tracts) A) FHA, FSA/RHS & VA B) Conventional C) Refinancings D) Home Improvement Loans E) Loans on Dwellings For 5+ Families F) Non-occupant Loans on Number Average Value Number Average Value Number Average Value Number Average Value Number Average Value Number Average Value
LOANS ORIGINATED 138 $60,068 242 $48,217 330 $44,951 148 $18,481 4 $1,108,175 51 $38,354 APPLICATIONS APPROVED, NOT ACCEPTED 9 $49,670 125 $45,969 92 $46,602 29 $18,782 0 $0 14 $32,594 APPLICATIONS DENIED 15 $56,463 343 $44,379 322 $43,701 193 $15,248 0 $0 30 $31,671 APPLICATIONS WITHDRAWN 17 $67,942 43 $51,162 168 $43,426 26 $14,135 0 $0 19 $58,597 FILES CLOSED FOR INCOMPLETENESS 2 $68,375 11 $32,574 32 $46,926 0 $0 0 $0 6 $64,950
Aggregated Statistics For Year 2000(Based on 6 full and 16 partial tracts) A) FHA, FSA/RHS & VA B) Conventional C) Refinancings D) Home Improvement Loans E) Loans on Dwellings For 5+ Families F) Non-occupant Loans on Number Average Value Number Average Value Number Average Value Number Average Value Number Average Value Number Average Value
LOANS ORIGINATED 152 $55,731 295 $43,907 246 $41,650 127 $18,068 2 $4,798,080 37 $37,094 APPLICATIONS APPROVED, NOT ACCEPTED 9 $47,212 117 $43,824 80 $34,194 72 $16,649 0 $0 10 $32,937 APPLICATIONS DENIED 29 $53,730 450 $42,891 275 $38,910 193 $12,363 0 $0 43 $32,543 APPLICATIONS WITHDRAWN 10 $68,272 32 $43,492 150 $42,257 11 $31,287 0 $0 9 $42,763 FILES CLOSED FOR INCOMPLETENESS 8 $45,630 12 $486,910 70 $47,198 1 $18,530 0 $0 6 $53,302
Aggregated Statistics For Year 1999(Based on 4 full and 8 partial tracts) A) FHA, FSA/RHS & VA B) Conventional C) Refinancings D) Home Improvement Loans E) Loans on Dwellings For 5+ Families F) Non-occupant Loans on Number Average Value Number Average Value Number Average Value Number Average Value Number Average Value Number Average Value
LOANS ORIGINATED 101 $52,576 182 $49,469 205 $40,140 88 $18,886 1 $66,800 21 $41,896 APPLICATIONS APPROVED, NOT ACCEPTED 5 $62,436 97 $43,353 59 $36,135 63 $14,767 0 $0 11 $37,287 APPLICATIONS DENIED 9 $57,220 405 $58,036 143 $40,472 197 $14,261 0 $0 22 $42,299 APPLICATIONS WITHDRAWN 12 $51,422 34 $49,608 93 $42,234 14 $20,464 0 $0 7 $97,473 FILES CLOSED FOR INCOMPLETENESS 2 $36,135 11 $52,276 45 $41,797 1 $60,690 0 $0 6 $36,053
Private Mortgage Insurance Companies Aggregated Statistics For Year 2009(Based on 4 full and 14 partial tracts) A) Conventional B) Refinancings C) Non-occupant Loans on Number Average Value Number Average Value Number Average Value
LOANS ORIGINATED 7 $105,381 4 $174,288 0 $0 APPLICATIONS APPROVED, NOT ACCEPTED 9 $83,957 0 $0 2 $94,400 APPLICATIONS DENIED 3 $115,943 1 $167,750 0 $0 APPLICATIONS WITHDRAWN 2 $142,560 0 $0 0 $0 FILES CLOSED FOR INCOMPLETENESS 0 $0 0 $0 0 $0
Aggregated Statistics For Year 2008(Based on 6 full and 16 partial tracts) A) Conventional B) Refinancings C) Non-occupant Loans on Number Average Value Number Average Value Number Average Value
LOANS ORIGINATED 60 $98,174 16 $145,865 14 $79,536 APPLICATIONS APPROVED, NOT ACCEPTED 31 $81,369 4 $130,200 4 $72,025 APPLICATIONS DENIED 13 $90,338 1 $98,200 4 $92,778 APPLICATIONS WITHDRAWN 2 $125,505 0 $0 0 $0 FILES CLOSED FOR INCOMPLETENESS 0 $0 0 $0 0 $0
Aggregated Statistics For Year 2007(Based on 6 full and 16 partial tracts) A) Conventional B) Refinancings C) Non-occupant Loans on D) Loans On Manufactured Number Average Value Number Average Value Number Average Value Number Average Value
LOANS ORIGINATED 141 $86,869 25 $122,406 19 $74,886 2 $92,625 APPLICATIONS APPROVED, NOT ACCEPTED 11 $102,133 3 $174,810 5 $83,922 0 $0 APPLICATIONS DENIED 1 $36,630 0 $0 0 $0 0 $0 APPLICATIONS WITHDRAWN 7 $92,521 4 $152,268 1 $72,000 0 $0 FILES CLOSED FOR INCOMPLETENESS 0 $0 0 $0 0 $0 0 $0
Aggregated Statistics For Year 2006(Based on 6 full and 16 partial tracts) A) Conventional B) Refinancings C) Non-occupant Loans on D) Loans On Manufactured Number Average Value Number Average Value Number Average Value Number Average Value
LOANS ORIGINATED 77 $76,479 11 $116,225 19 $67,876 1 $49,690 APPLICATIONS APPROVED, NOT ACCEPTED 11 $88,807 2 $141,415 3 $90,320 0 $0 APPLICATIONS DENIED 1 $106,640 0 $0 0 $0 0 $0 APPLICATIONS WITHDRAWN 4 $70,625 4 $130,830 1 $61,300 0 $0 FILES CLOSED FOR INCOMPLETENESS 0 $0 0 $0 0 $0 0 $0
Aggregated Statistics For Year 2005(Based on 6 full and 16 partial tracts) A) Conventional B) Refinancings C) Non-occupant Loans on D) Loans On Manufactured Number Average Value Number Average Value Number Average Value Number Average Value
LOANS ORIGINATED 66 $74,974 11 $124,415 8 $63,900 0 $0 APPLICATIONS APPROVED, NOT ACCEPTED 7 $68,440 1 $71,000 3 $75,580 1 $51,360 APPLICATIONS DENIED 0 $0 0 $0 0 $0 0 $0 APPLICATIONS WITHDRAWN 3 $71,987 0 $0 2 $50,980 0 $0 FILES CLOSED FOR INCOMPLETENESS 2 $81,985 0 $0 0 $0 0 $0
Aggregated Statistics For Year 2004(Based on 6 full and 16 partial tracts) A) Conventional B) Refinancings C) Non-occupant Loans on D) Loans On Manufactured Number Average Value Number Average Value Number Average Value Number Average Value
LOANS ORIGINATED 67 $68,240 13 $82,350 13 $49,908 1 $121,450 APPLICATIONS APPROVED, NOT ACCEPTED 5 $61,662 0 $0 2 $35,050 1 $22,900 APPLICATIONS DENIED 3 $77,897 0 $0 0 $0 0 $0 APPLICATIONS WITHDRAWN 7 $63,161 3 $65,013 3 $63,013 0 $0 FILES CLOSED FOR INCOMPLETENESS 1 $63,000 0 $0 0 $0 0 $0
Aggregated Statistics For Year 2003(Based on 6 full and 16 partial tracts) A) Conventional B) Refinancings C) Non-occupant Loans on Number Average Value Number Average Value Number Average Value
LOANS ORIGINATED 54 $58,092 24 $78,975 9 $63,169 APPLICATIONS APPROVED, NOT ACCEPTED 6 $63,367 2 $148,005 1 $51,000 APPLICATIONS DENIED 5 $70,486 0 $0 0 $0 APPLICATIONS WITHDRAWN 0 $0 2 $68,005 1 $63,090 FILES CLOSED FOR INCOMPLETENESS 0 $0 1 $61,000 1 $61,000
Aggregated Statistics For Year 2002(Based on 6 full and 14 partial tracts) A) Conventional B) Refinancings C) Non-occupant Loans on Number Average Value Number Average Value Number Average Value
LOANS ORIGINATED 62 $71,457 12 $112,035 4 $69,185 APPLICATIONS APPROVED, NOT ACCEPTED 5 $52,166 6 $73,298 2 $39,985 APPLICATIONS DENIED 1 $83,440 0 $0 0 $0 APPLICATIONS WITHDRAWN 2 $87,315 1 $105,080 1 $64,000 FILES CLOSED FOR INCOMPLETENESS 0 $0 1 $58,000 0 $0
Aggregated Statistics For Year 2001(Based on 6 full and 14 partial tracts) A) Conventional B) Refinancings C) Non-occupant Loans on Number Average Value Number Average Value Number Average Value
LOANS ORIGINATED 43 $60,782 7 $78,964 9 $40,274 APPLICATIONS APPROVED, NOT ACCEPTED 4 $63,010 5 $62,140 1 $46,990 APPLICATIONS DENIED 2 $53,405 0 $0 0 $0 APPLICATIONS WITHDRAWN 0 $0 0 $0 0 $0 FILES CLOSED FOR INCOMPLETENESS 0 $0 2 $184,925 0 $0
Aggregated Statistics For Year 2000(Based on 6 full and 14 partial tracts) A) Conventional B) Refinancings C) Non-occupant Loans on Number Average Value Number Average Value Number Average Value
LOANS ORIGINATED 25 $61,278 19 $52,094 5 $32,848 APPLICATIONS APPROVED, NOT ACCEPTED 6 $58,840 2 $88,895 2 $17,520 APPLICATIONS DENIED 0 $0 1 $74,140 0 $0 APPLICATIONS WITHDRAWN 2 $87,715 0 $0 0 $0 FILES CLOSED FOR INCOMPLETENESS 2 $37,105 0 $0 0 $0
Aggregated Statistics For Year 1999(Based on 4 full and 7 partial tracts) A) Conventional B) Refinancings C) Non-occupant Loans on Number Average Value Number Average Value Number Average Value
LOANS ORIGINATED 12 $51,157 4 $78,042 1 $36,180 APPLICATIONS APPROVED, NOT ACCEPTED 1 $52,300 0 $0 1 $12,400 APPLICATIONS DENIED 2 $33,440 0 $0 0 $0 APPLICATIONS WITHDRAWN 1 $32,400 0 $0 0 $0 FILES CLOSED FOR INCOMPLETENESS 0 $0 0 $0 0 $0
2002 - 2018 National Fire Incident Reporting System (NFIRS) incidents See full 2006 National Fire Incident Reporting System statistics for zip code 78221, Texas
Most common first names in zip code 78221 among deceased individuals Name Count Lived (average)
Mary 154 74.5 years John 137 71.9 years Maria 129 77.1 years William 107 73.5 years Robert 103 68.0 years James 100 68.9 years Jose 92 71.9 years Juan 83 70.9 years Joe 76 69.4 years Frank 73 71.9 years
Most common last names in zip code 78221 among deceased individuals Last name Count Lived (average)
Garcia 148 71.1 years Martinez 140 72.4 years Rodriguez 129 72.9 years Hernandez 84 71.6 years Gonzales 81 73.0 years Garza 71 70.3 years Flores 67 72.9 years Perez 66 73.0 years Sanchez 61 71.5 years Lopez 60 69.9 years
Businesses in zip code 78221
Name Count Name Count
Academy Sports + Outdoors 1 Little Caesars Pizza 1 Applebee's 1 Long John Silver's 1 AutoZone 2 McDonald's 2 Blockbuster 1 Nike 1 Chuck E. Cheese's 1 Payless 2 Church's Chicken 2 Pizza Hut 1 Cricket Wireless 7 RadioShack 1 Discount Tire 1 Skechers USA 1 Domino's Pizza 1 Sprint Nextel 1 El Pollo Loco 1 Starbucks 1 Firestone Complete Auto Care 1 Subway 3 GameStop 1 T-Mobile 2 H&R Block 2 U-Haul 1 Holiday Inn 1 UPS 1 Jones New York 1 Walgreens 1 Lane Furniture 1 Wendy's 1
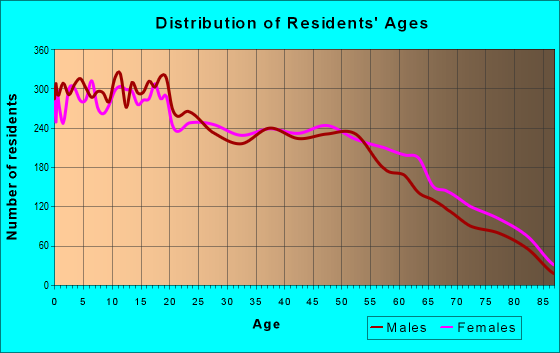
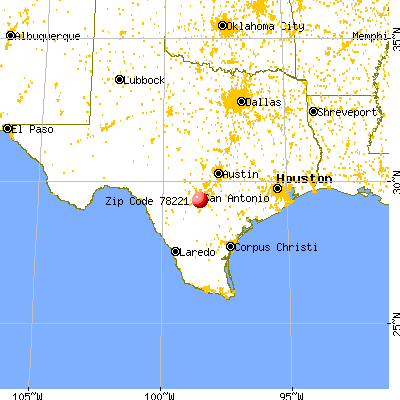


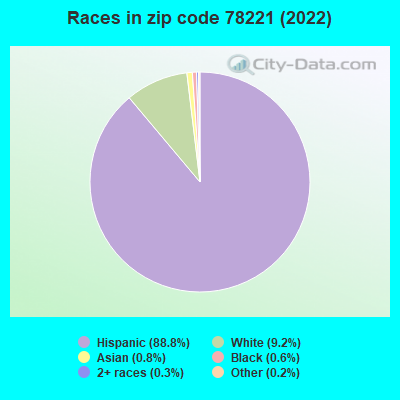


 Nearest zip codes: 78214, 78224, 78235, 78264, 78223, 78211.
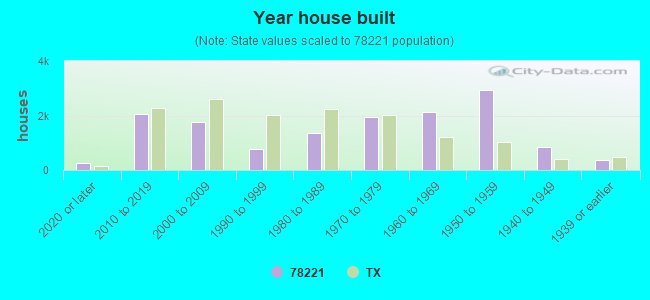

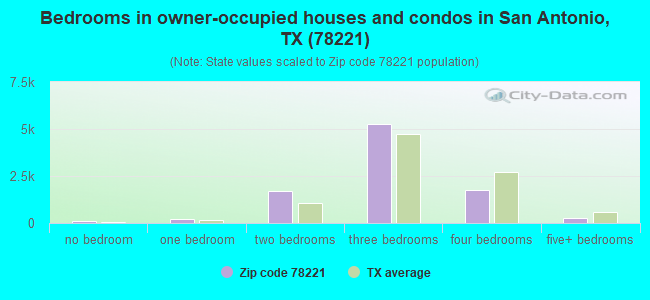
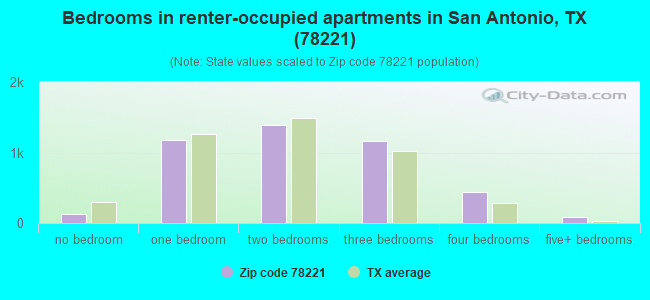
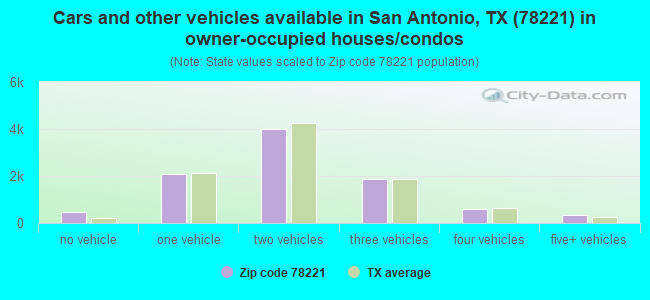
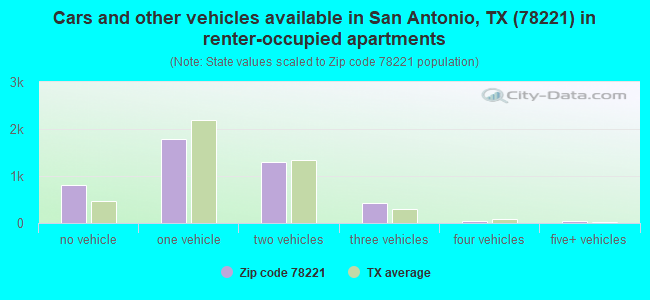


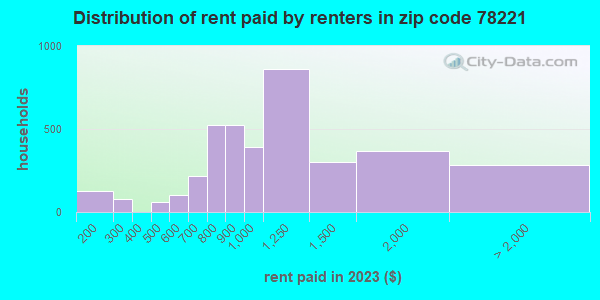
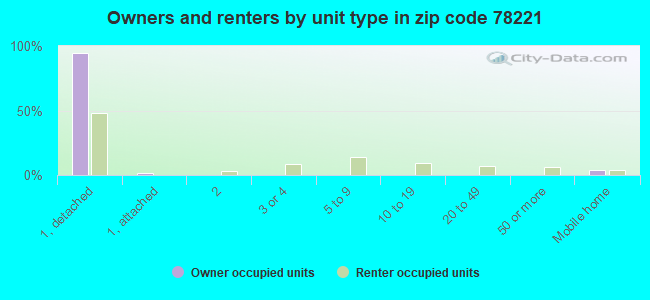


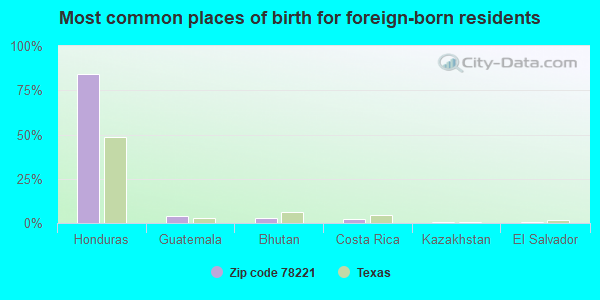
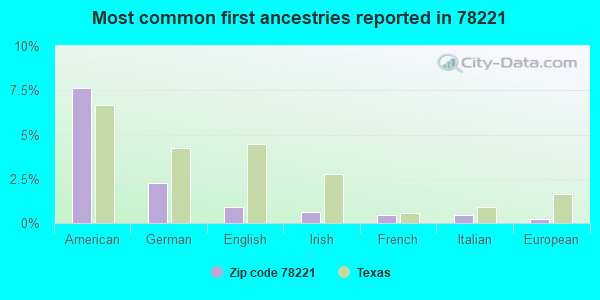
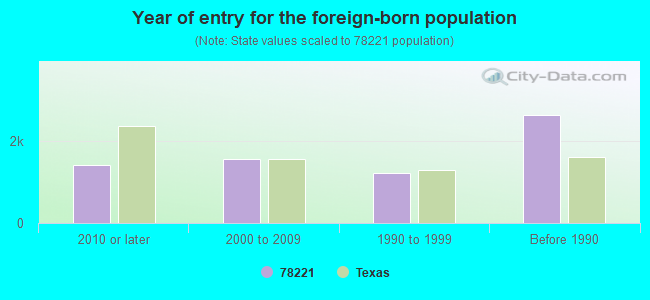

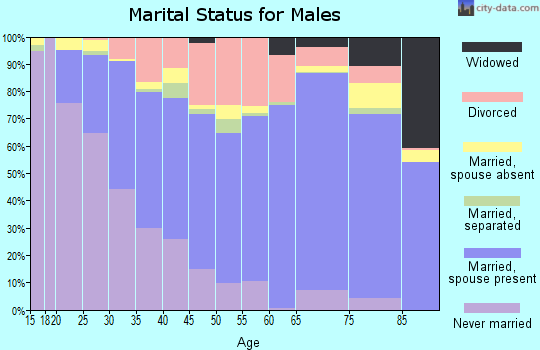
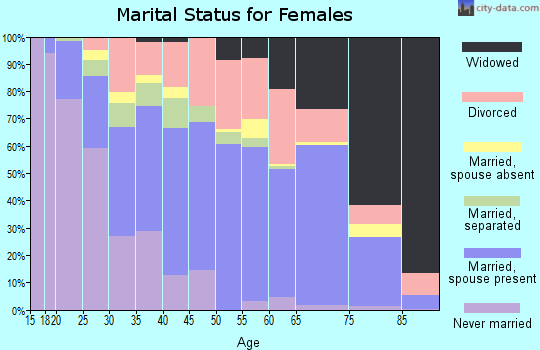
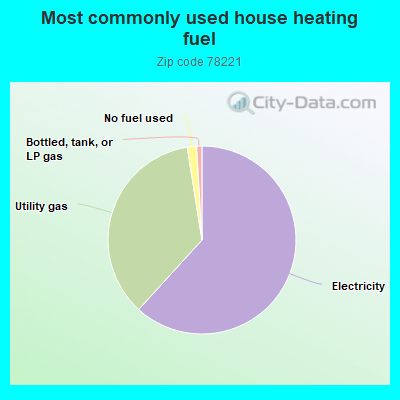
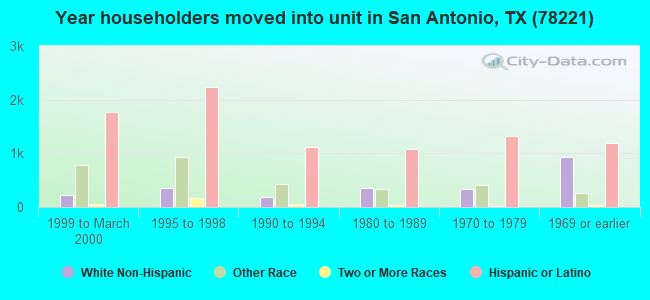
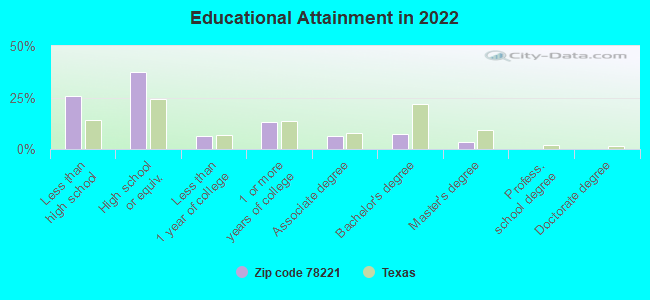
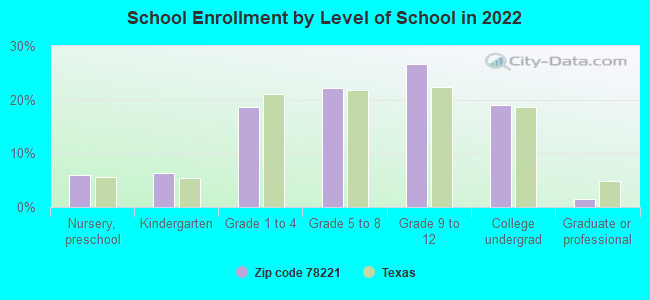
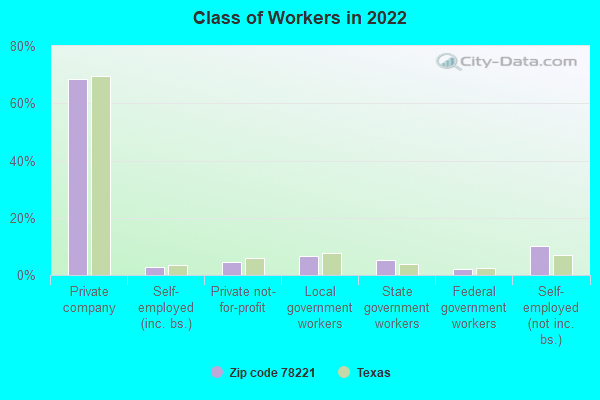
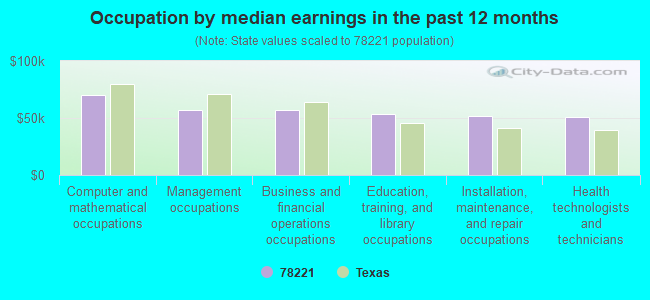
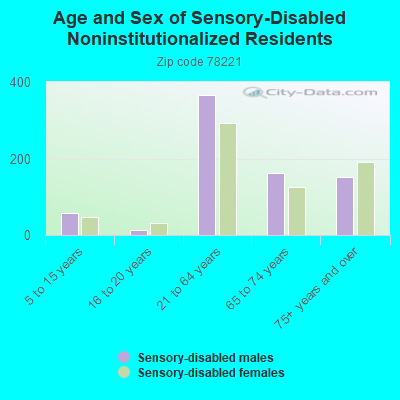
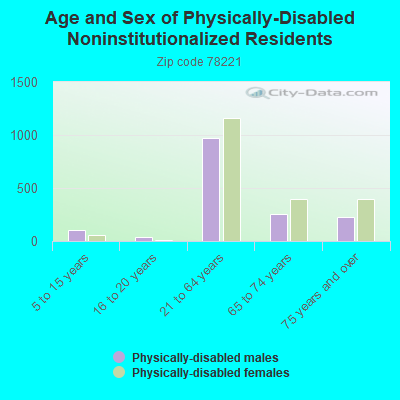
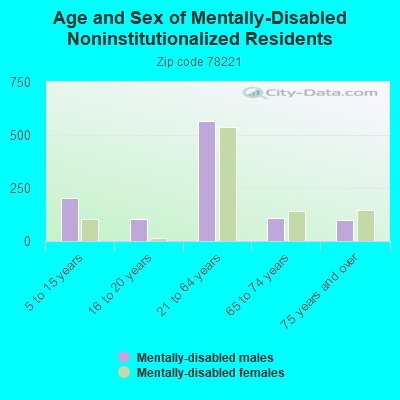
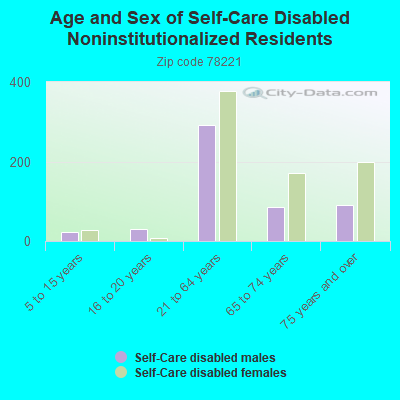
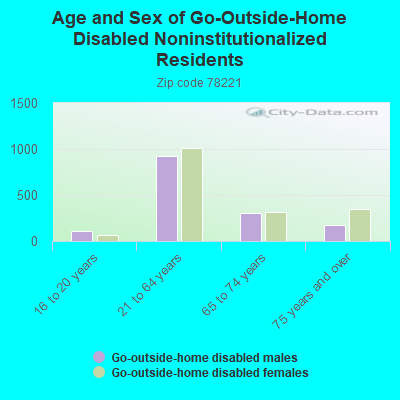
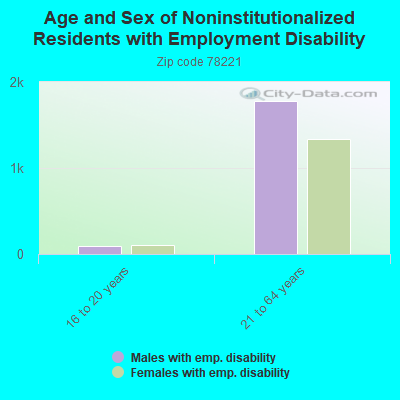

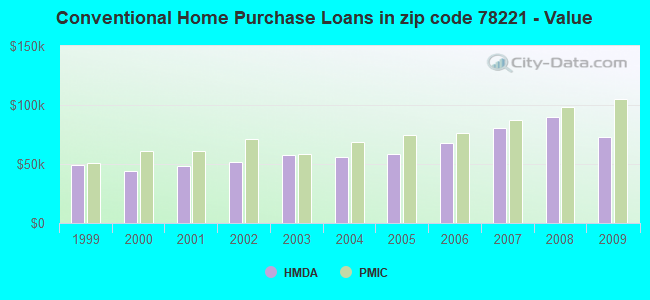
 According to the data from the years 2002 - 2018 the average number of fire incidents per year is 110. The highest number of fire incidents - 172 took place in 2002, and the least - 3 in 2008. The data has a decreasing trend.
 When looking into fire subcategories, the most reports belonged to: Outside Fires (51.9%), and Mobile Property/Vehicle Fires (20.2%).