Estimated zip code population in 2022: 35,395 Zip code population in 2010: 33,722 Zip code population in 2000: 25,680
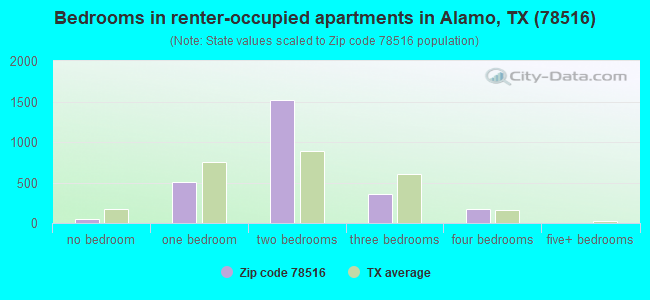
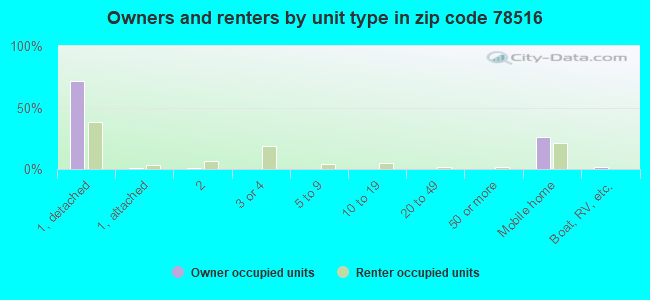
Houses and condos: 12,876 Renter-occupied apartments: 2,629
% of renters here:
24%
State:
38%
March 2022 cost of living index in zip code 78516: 80.2 (low, U.S. average is 100)
Land area: 38.0 sq. mi. Water area: 0.2 sq. mi.
Population density: 931 people per square mile
(low).
OSM Map
General Map
Google Map
MSN Map
OSM Map
General Map
Google Map
MSN Map
OSM Map
General Map
Google Map
MSN Map
OSM Map
General Map
Google Map
MSN Map
Please wait while loading the map...
Real estate property taxes paid for housing units in 2022:
This zip code:
1.6% ($1,544)
Texas:
1.5% ($4,050)
Median real estate property taxes paid for housing units with mortgages in 2022: $2,544 (1.6%) Median real estate property taxes paid for housing units with no mortgage in 2022: $1,320 (1.7%)
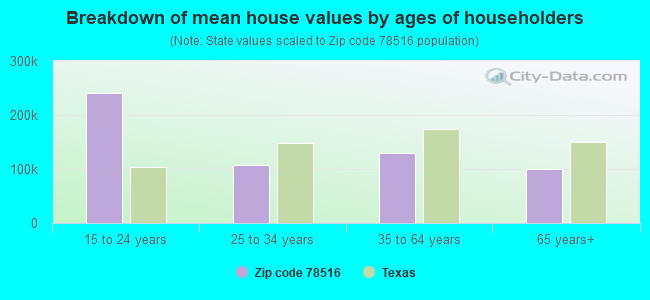
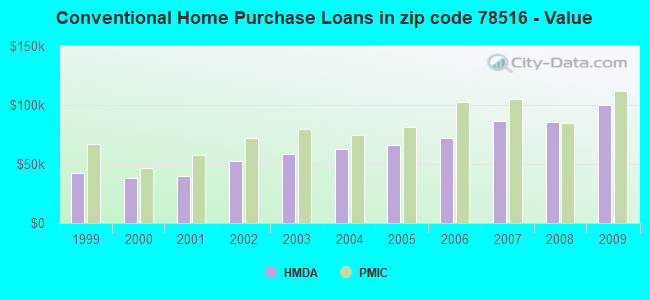
Estimated median house/condo value in 2022: $95,811
78516:
$95,811
Texas:
$275,400
According to our research of Texas and other state lists, there were 80 registered sex offenders living in 78516 zip code as of April 26, 2024. The ratio of all residents to sex offenders in zip code 78516 is 461 to 1. The ratio of registered sex offenders to all residents in this zip code is near the state average.
Median resident age:
This zip code:
30.8 years
Texas median age:
35.6 years
Average household size:
This zip code:
3.3 people
Texas:
2.6 people
Averages for the 2020 tax year for zip code 78516, filed in 2021:
Average Adjusted Gross Income (AGI) in 2020: $33,390 (Individual Income Tax Returns)
Here:
$33,390
State:
$77,054
Salary/wage: $30,306 (reported on 81.5% of returns)
Here:
$30,306
State:
$62,766
(% of AGI for various income ranges: 1136.1% for AGIs below $25k, 3369.0% for AGIs $25k-50k, 6220.0% for AGIs $50k-75k, 8742.2% for AGIs $75k-100k, 12612.9% for AGIs $100k-200k)
Taxable interest for individuals: $1,452 (reported on 9.0% of returns)
This zip code:
$1,452
Texas:
$2,665
(% of AGI for various income ranges: 3.3% for AGIs below $25k, 7.9% for AGIs $25k-50k, 22.6% for AGIs $50k-75k, 84.0% for AGIs $75k-100k, 142.9% for AGIs $100k-200k)
Ordinary dividends: $5,496 (reported on 3.8% of returns)
Here:
$5,496
State:
$10,044
(% of AGI for various income ranges: 3.3% for AGIs below $25k, 8.6% for AGIs $25k-50k, 24.6% for AGIs $50k-75k, 96.8% for AGIs $75k-100k, 213.7% for AGIs $100k-200k)
Net capital gain/loss in AGI: +$4,895 (reported on 4.1% of returns)
Here:
+$4,895
State:
+$39,590
(% of AGI for various income ranges: 0.5% for AGIs below $25k, 6.2% for AGIs $25k-50k, 18.2% for AGIs $50k-75k, 75.8% for AGIs $75k-100k, 294.3% for AGIs $100k-200k)
Profit/loss from business: +$5,146 (reported on 26.2% of returns)
Here:
+$5,146
State:
+$10,888
(% of AGI for various income ranges: 267.6% for AGIs below $25k, 33.5% for AGIs $25k-50k, 629.1% for AGIs $100k-200k)
Taxable individual retirement arrangement distribution: $17,638 (reported on 3.4% of returns)
78516:
$17,638
Texas:
$24,740
(% of AGI for various income ranges: 11.8% for AGIs below $25k, 36.6% for AGIs $25k-50k, 106.6% for AGIs $50k-75k, 212.5% for AGIs $75k-100k, 1244.3% for AGIs $100k-200k)
Total itemized deductions: $29,794 (reported on 2.2% of returns)
Here:
$29,794
State:
$40,428
(% of AGI for various income ranges: 8.4% for AGIs below $25k, 61.6% for AGIs $25k-50k, 243.0% for AGIs $50k-75k, 336.8% for AGIs $75k-100k, 654.0% for AGIs $100k-200k)
Charity contributions: $9,329 (reported on 1.7% of returns)
Here:
$9,329
State:
$18,201
(% of AGI for various income ranges: 11.9% for AGIs $25k-50k, 55.0% for AGIs $50k-75k, 53.0% for AGIs $75k-100k, 268.6% for AGIs $100k-200k)
Taxes paid: $7,670 (reported on 2.2% of returns)
78516:
$7,670
State:
$7,821
(% of AGI for various income ranges: 17.2% for AGIs $25k-50k, 60.8% for AGIs $50k-75k, 99.0% for AGIs $75k-100k, 162.3% for AGIs $100k-200k)
Earned income credit: $3,235 (reported on 41.6% of returns)
Here:
$3,235
State:
$2,584
(% of AGI for various income ranges: 235.6% for AGIs below $25k, 139.7% for AGIs $25k-50k, 4.0% for AGIs $50k-75k)
Percentage of individuals using paid preparers for their 2020 taxes: 90.0%
Here:
90%
State:
92%
(% for various income ranges: 89.0% for AGIs below $25k, 91.3% for AGIs $25k-50k, 91.1% for AGIs $50k-75k, 89.1% for AGIs $75k-100k, 90.0% for AGIs $100k-200k, 100.0% for AGIs over 200k)
Averages for the 2012 tax year for zip code 78516, filed in 2013:
Average Adjusted Gross Income (AGI) in 2012: $27,772 (Individual Income Tax Returns)
Here:
$27,772
State:
$65,384
Salary/wage: $25,148 (reported on 82.7% of returns)
Here:
$25,148
State:
$52,524
(% of AGI for various income ranges: 73.2% for AGIs below $25k, 85.7% for AGIs $25k-50k, 78.9% for AGIs $50k-75k, 69.0% for AGIs $75k-100k, 67.3% for AGIs $100k-200k, 27.6% for AGIs over 200k)
Taxable interest for individuals: $1,766 (reported on 10.1% of returns)
This zip code:
$1,766
Texas:
$2,372
(% of AGI for various income ranges: 0.4% for AGIs below $25k, 0.5% for AGIs $25k-50k, 0.5% for AGIs $50k-75k, 1.0% for AGIs $75k-100k, 1.2% for AGIs $100k-200k, 1.5% for AGIs over 200k)
Ordinary dividends: $6,487 (reported on 5.0% of returns)
Here:
$6,487
State:
$9,721
(% of AGI for various income ranges: 0.6% for AGIs below $25k, 0.6% for AGIs $25k-50k, 0.8% for AGIs $50k-75k, 1.6% for AGIs $75k-100k, 2.7% for AGIs $100k-200k, 6.1% for AGIs over 200k)
Net capital gain/loss in AGI: +$4,136 (reported on 4.1% of returns)
Here:
+$4,136
State:
+$35,319
(% of AGI for various income ranges: 0.1% for AGIs $50k-75k, 1.0% for AGIs $75k-100k, 4.3% for AGIs $100k-200k)
Profit/loss from business: +$7,899 (reported on 25.9% of returns)
Here:
+$7,899
State:
+$13,732
(% of AGI for various income ranges: 19.3% for AGIs below $25k, 1.4% for AGIs $25k-50k, 0.9% for AGIs $50k-75k, 1.5% for AGIs $75k-100k, 5.8% for AGIs $100k-200k)
Taxable individual retirement arrangement distribution: $11,737 (reported on 4.1% of returns)
78516:
$11,737
Texas:
$19,511
(% of AGI for various income ranges: 0.9% for AGIs below $25k, 1.6% for AGIs $25k-50k, 1.6% for AGIs $50k-75k, 3.5% for AGIs $75k-100k, 3.4% for AGIs $100k-200k)
Total itemized deductions: $19,553 (31% of AGI, reported on 11.8% of returns)
Here:
$19,553
State:
$24,724
Here:
30.6% of AGI
State:
15.9% of AGI
(% of AGI for various income ranges: 1.9% for AGIs below $25k, 10.1% for AGIs $25k-50k, 14.5% for AGIs $50k-75k, 11.8% for AGIs $75k-100k, 10.2% for AGIs $100k-200k, 6.8% for AGIs over 200k)
Charity contributions: $3,340 (reported on 7.8% of returns)
Here:
$3,340
State:
$6,808
(% of AGI for various income ranges: 0.1% for AGIs below $25k, 0.8% for AGIs $25k-50k, 1.5% for AGIs $50k-75k, 1.5% for AGIs $75k-100k, 2.5% for AGIs $100k-200k)
Taxes paid: $3,973 (reported on 11.1% of returns)
78516:
$3,973
State:
$6,921
(% of AGI for various income ranges: 0.3% for AGIs below $25k, 1.6% for AGIs $25k-50k, 2.5% for AGIs $50k-75k, 2.7% for AGIs $75k-100k, 2.6% for AGIs $100k-200k, 2.5% for AGIs over 200k)
Earned income credit: $3,277 (reported on 50.9% of returns)
Here:
$3,277
State:
$2,570
(% of AGI for various income ranges: 16.5% for AGIs below $25k, 3.0% for AGIs $25k-50k)
Percentage of individuals using paid preparers for their 2012 taxes: 66.9%
Here:
67%
State:
51%
(% for various income ranges: 67.1% for AGIs below $25k, 65.2% for AGIs $25k-50k, 66.7% for AGIs $50k-75k, 66.7% for AGIs $75k-100k, 74.1% for AGIs $100k-200k, 100.0% for AGIs over 200k)
Averages for the 2004 tax year for zip code 78516, filed in 2005:
Average Adjusted Gross Income (AGI) in 2004: $22,140 (Individual Income Tax Returns)
Here:
$22,140
State:
$47,881
Salary/wage: $19,469 (reported on 82.5% of returns)
Here:
$19,469
State:
$41,947
(% of AGI for various income ranges: 81.4% for AGIs below $10k, 80.1% for AGIs $10k-25k, 82.2% for AGIs $25k-50k, 66.0% for AGIs $50k-75k, 61.7% for AGIs $75k-100k, 35.8% for AGIs over 100k)
Taxable interest for individuals: $2,377 (reported on 16.6% of returns)
This zip code:
$2,377
Texas:
$2,255
(% of AGI for various income ranges: 2.6% for AGIs below $10k, 1.0% for AGIs $10k-25k, 1.7% for AGIs $25k-50k, 2.6% for AGIs $50k-75k, 1.3% for AGIs $75k-100k, 3.2% for AGIs over 100k)
Taxable dividends: $3,315 (reported on 7.7% of returns)
Here:
$3,315
State:
$4,261
(% of AGI for various income ranges: 1.4% for AGIs below $10k, 0.5% for AGIs $10k-25k, 0.8% for AGIs $25k-50k, 1.8% for AGIs $50k-75k, 1.8% for AGIs $75k-100k, 2.6% for AGIs over 100k)
Net capital gain/loss: +$11,577 (reported on 6.4% of returns)
Here:
+$11,577
State:
+$16,110
(% of AGI for various income ranges: -0.4% for AGIs below $10k, 0.1% for AGIs $10k-25k, 0.3% for AGIs $25k-50k, 2.5% for AGIs $50k-75k, 6.3% for AGIs $75k-100k, 22.1% for AGIs over 100k)
Profit/loss from business: +$5,992 (reported on 23.4% of returns)
Here:
+$5,992
State:
+$11,013
(% of AGI for various income ranges: 22.2% for AGIs below $10k, 11.0% for AGIs $10k-25k, 0.5% for AGIs $25k-50k, 1.8% for AGIs $50k-75k, 1.3% for AGIs $75k-100k, 6.6% for AGIs over 100k)
Profit/loss from farming: +$2,544 (reported on 0.6% of returns)
Here:
+$2,544
State:
-$9,403
(% of AGI for various income ranges: -0.2% for AGIs below $10k, -0.1% for AGIs $25k-50k, 0.8% for AGIs $50k-75k, -0.1% for AGIs over 100k)
IRA payment deduction: $2,721 (reported on 0.8% of returns)
78516:
$2,721
Texas:
$3,120
(% of AGI for various income ranges: 0.1% for AGIs $10k-25k, 0.1% for AGIs $25k-50k, 0.2% for AGIs $50k-75k, 0.3% for AGIs over 100k)
Total itemized deductions: $17,148 (33% of AGI, reported on 9.0% of returns)
Here:
$17,148
State:
$19,631
Here:
33.4% of AGI
State:
18.9% of AGI
(% of AGI for various income ranges: 2.6% for AGIs below $10k, 2.8% for AGIs $10k-25k, 10.3% for AGIs $25k-50k, 11.6% for AGIs $50k-75k, 10.1% for AGIs $75k-100k, 6.0% for AGIs over 100k)
Charity contributions deductions: $2,756 (5% of AGI, reported on 7.0% of returns)
Here:
$2,756
State:
$4,753
Here:
5.0% of AGI
State:
4.2% of AGI
(% of AGI for various income ranges: 0.2% for AGIs below $10k, 0.2% for AGIs $10k-25k, 0.9% for AGIs $25k-50k, 1.7% for AGIs $50k-75k, 1.6% for AGIs $75k-100k, 1.7% for AGIs over 100k)
Total tax: $2,630 (reported on 51.3% of returns)
78516:
$2,630
State:
$9,058
(% of AGI for various income ranges: 4.5% for AGIs below $10k, 2.8% for AGIs $10k-25k, 4.0% for AGIs $25k-50k, 7.9% for AGIs $50k-75k, 10.1% for AGIs $75k-100k, 17.5% for AGIs over 100k)
Earned income credit: $2,583 (reported on 55.6% of returns)
Here:
$2,583
State:
$2,024
Percentage of individuals using paid preparers for their 2004 taxes: 75.0%
Here:
75%
State:
57%
(% for various income ranges: 72.2% for AGIs below $10k, 78.8% for AGIs $10k-25k, 71.4% for AGIs $25k-50k, 70.0% for AGIs $50k-75k, 63.3% for AGIs $75k-100k, 80.5% for AGIs over 100k)
Household received Food Stamps/SNAP in the past 12 months: 3,374 Household did not receive Food Stamps/SNAP in the past 12 months: 7,478
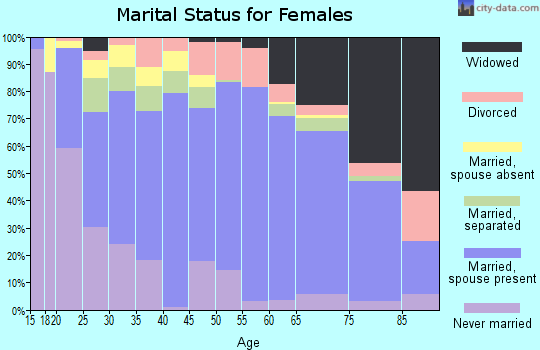
Women who had a birth in the past 12 months: 688 (421 now married, 263 unmarried) Women who did not have a birth in the past 12 months: 8,332 (3,519 now married, 4,817 unmarried)
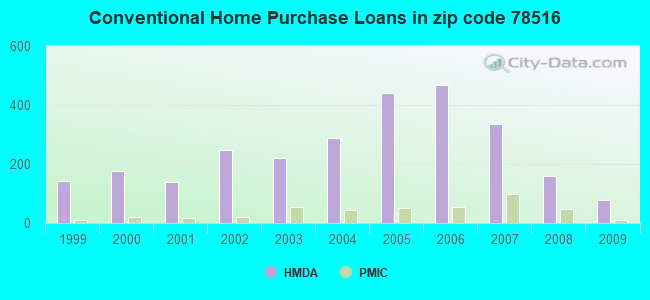
Housing units in zip code 78516 with a mortgage: 2,324 Houses without a mortgage: 97
Median monthly owner costs for units with a mortgage: $1,142 Median monthly owner costs for units without a mortgage: $392
Residents with income below the poverty level in 2022:
This zip code:
24.7%
Whole state:
14.0%
Residents with income below 50% of the poverty level in 2022:
This zip code:
14.7%
Whole state:
7.4%
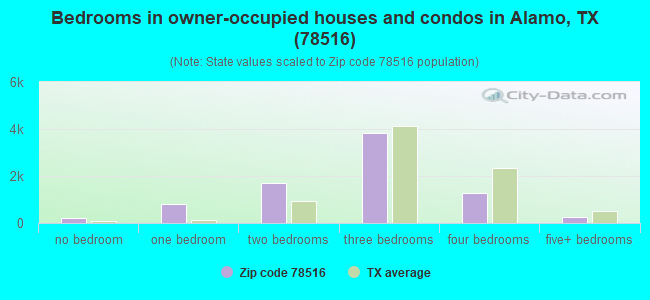
Median number of rooms in houses and condos:
Here:
5.0
State:
6.3
Median number of rooms in apartments:
Here:
3.7
State:
4.0
Notable locations in this zip code not listed on our city pages
Notable locations in zip code 78516: Alamo Fire Department (A), Alamo Police Department (B), Alamo Arcaute Public Library (C), Ni Tram Ambulance Service (D). Display/hide their locations on the map
In group quarters: 36 (-1 institutionalized population)
Size of family households: 2,610 2-persons, 1,967 3-persons, 1,458 4-persons, 1,028 5-persons, 772 6-persons, 542 7-or-more-persons
Size of nonfamily households: 2,029 1-person, 282 2-persons
5,138 married couples with children.
2,868 single-parent households (349 men, 2,519 women).
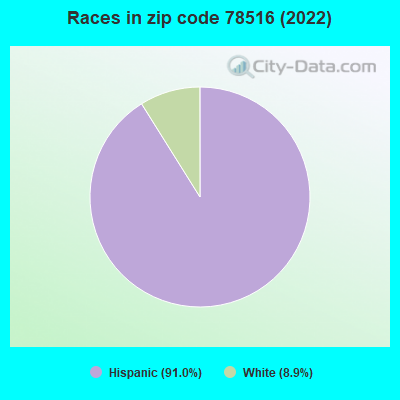
20.8% of residents of 78516 zip code speak English at home.
78.9% of residents speak Spanish at home (63% very well, 13% well, 9% not well, 16% not at all).
0.1% of residents speak other Indo-European language at home (100% very well).
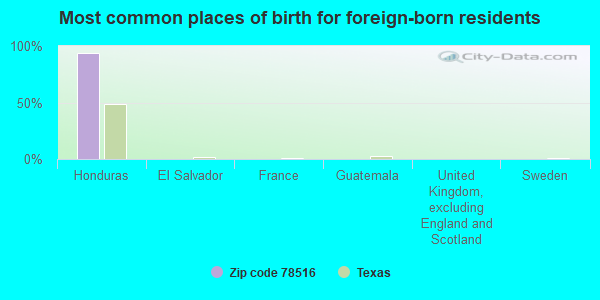
Foreign born population: 9,703 (27.4%) (31.6% of them are naturalized citizens)
This zip code:
27.4%
Whole state:
17.2%
94%Honduras
0%El Salvador
0%France
0%Guatemala
0%United Kingdom, excluding England and Scotland
0%Sweden
0%Austria
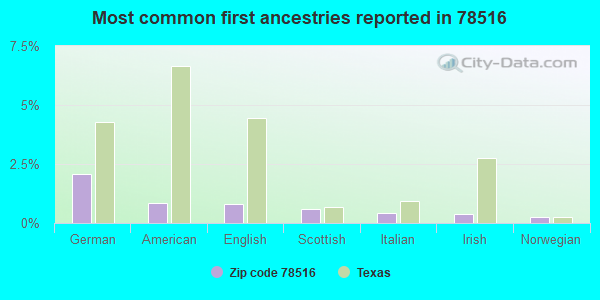
2%German
1%American
1%English
1%Scottish
0%Italian
0%Irish
0%Norwegian
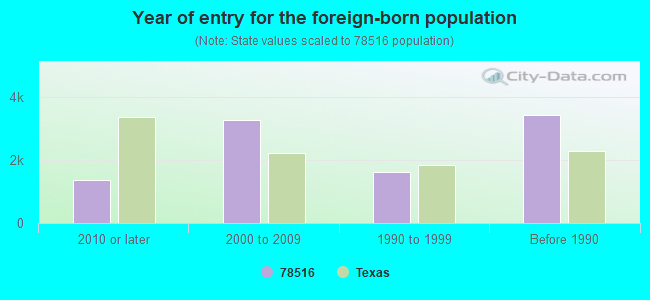
Year of entry for the foreign-born population
1,3612010 or later
3,2722000 to 2009
1,6261990 to 1999
3,425Before 1990
Facilities with environmental interests located in this zip code:
B.Y.T. AUTO SALVAGE (TXU010544) (1/2 MI EAST OF TOWER RD EXP 83 in ALAMO, TX)
(Integrated Compliance Information System) - ICIS-06-2005-2300, ENFORCEMENT/COMPLIANCE ACTIVITY, FORMAL ENFORCEMENT ACTION National Pollutant Discharge Elimination System NON-MAJOR (Tracking pollutant discharge elimination systems) - permit
ALAMO MIDDLE (1819 W HWY 83 in ALAMO, TX)
(National Center for Education Statistics) - STATE ID-108909042 Organizations: PHARR-SAN JUAN-ALAMO (SCHOOL DISTRICT)
AMERICAN AUTO PARTS AND SALVAGE (E HWY 83 PO BOX 1000 in ALAMO, TX)
(Integrated Compliance Information System) - ICIS-06-2000-0068, FORMAL ENFORCEMENT ACTION Business SIC classification: MOTOR VEHICLE PARTS, USED
AGRILINK FOODS INCORPORATED (111 NORTH 7TH STREET in ALAMO, TX)
(Resource Conservation and Recovery Act (tracking hazardous waste)) TRI REPORTER (Tracking of toxic chemicals releasing facilities) Business SIC classification: FROZEN FRUITS, FRUIT JUICES, AND VEGETABLES Business NAICS classification: OTHER VEGETABLE (EXCEPT POTATO) AND MELON FARMING. Organizations: SOUTHERN FROZEN FOODS (CONTACT/OPERATOR)
Alternative names: SOUTHERN FROZEN FOODS
Housing units lacking complete plumbing facilities: 2.1% Housing units lacking complete kitchen facilities: 1.1%
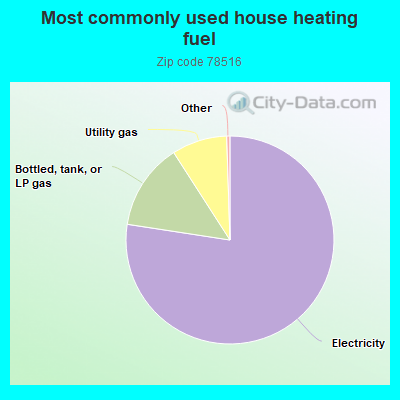
77.5%Electricity
13.5%Bottled, tank, or LP gas
8.6%Utility gas
Population in 1990: 16,555. Population change in the 1990s: +9,125 (+55.1%).
Place of birth for U.S.-born residents:
This state: 21,115
Northeast: 136
Midwest: 2,273
South: 315
West: 1,297
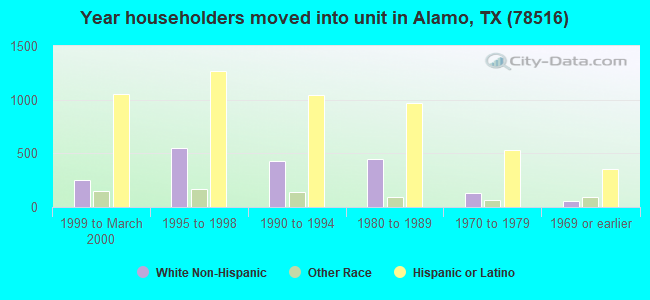
68% of the 78516 zip code residents lived in the same house 5 years ago. Out of people who lived in different houses, 78% lived in this county. Out of people who lived in different counties, 50% lived in Texas.
92% of the 78516 zip code residents lived in the same house 1 year ago. Out of people who lived in different houses, 58% moved from this county. Out of people who lived in different houses, 5% moved from different county within same state. Out of people who lived in different houses, 31% moved from different state. Out of people who lived in different houses, 8% moved from abroad.
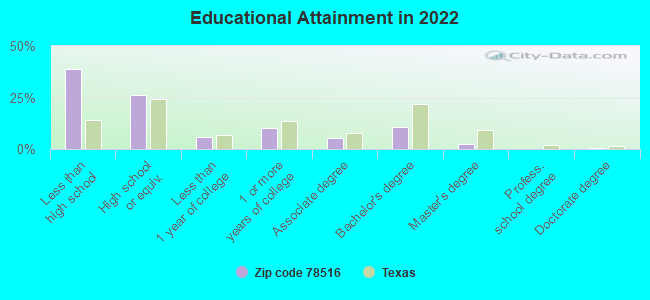
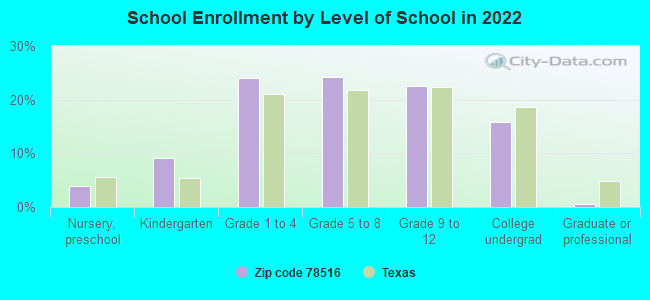
Private vs. public school enrollment:
Students in private schools in grades 1 to 8 (elementary and middle school): 39
Here:
0.8%
Texas:
8.8%
Students in private schools in grades 9 to 12 (high school): 22
Here:
1.0%
Texas:
8.0%
Students in private undergraduate colleges: 129
Here:
7.7%
Texas:
16.2%
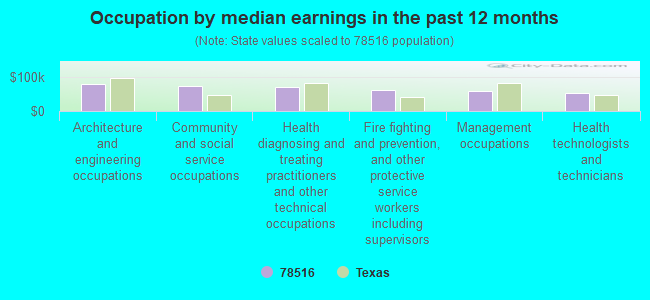
Occupation by median earnings in the past 12 months ($)
76,906Architecture and engineering occupations
71,508Community and social service occupations
70,719Health diagnosing and treating practitioners and other technical occupations
61,007Fire fighting and prevention, and other protective service workers including supervisors
59,096Management occupations
51,557Health technologists and technicians
Companies with federal contracts located in this zip code (ALAMO, TX):
BARNES,BILL (1341 W HWY 83 209; small business) : $25,200 in 11 contractsfrom 2003 to 2005
Contracts for Operation of Government-Owned Facilities -- Recreation Facilities (Non-Building) by Army, U.S. Army Corps of Engineers - civil program financing only Signed by year:2000: $0; 2001: $0; 2002: $0; 2003: $5,680; 2004: $10,080; 2005: $9,440; 2006: $0.
Biggest contracts:
$4,400 with Army for Operation of Government-Owned Facilities -- Recreation Facilities (Non-Building). Taking place in AR. Signed on 2005-02-16. Completion date: 2003-10-31.
$4,400 with U.S. Army Corps of Engineers - civil program financing only for Operation of Government-Owned Facilities -- Recreation Facilities (Non-Building). Taking place in AR. Signed on 2005-02-16. Completion date: 2003-10-31.
$4,400 with Army for Operation of Government-Owned Facilities -- Recreation Facilities (Non-Building). Taking place in AR. Signed on 2004-01-12. Completion date: 2003-10-31.
$4,400 with U.S. Army Corps of Engineers - civil program financing only for Operation of Government-Owned Facilities -- Recreation Facilities (Non-Building). Taking place in AR. Signed on 2004-01-12. Completion date: 2003-10-31.
COLES, DAVID (89 E BUSNESS 83 LOT 15; small business) : $21,850 in 8 contractsfrom 2005 to 2006
Contracts for Custodial Janitorial Services, Operation of Government-Owned Facilities -- Recreation Facilities (Non-Building) by U.S. Army Corps of Engineers - civil program financing only, Army Signed by year:2000: $0; 2001: $0; 2002: $0; 2003: $0; 2004: $0; 2005: $21,850; 2006: $0.
Biggest contracts:
$10,925 with U.S. Army Corps of Engineers - civil program financing only for Custodial Janitorial Services. Taking place in IA. Signed on 2005-03-24. Completion date: 2006-03-31.
$10,925 with Army for Custodial Janitorial Services. Taking place in IA. Signed on 2005-03-24. Completion date: 2006-03-31.
$10,830, same as above.Signed on 2006-01-20. Completion date: 2006-03-31.
$6,525 with Army for Operation of Government-Owned Facilities -- Recreation Facilities (Non-Building). Taking place in AR. Signed on 2005-02-17. Completion date: 2005-09-30.
RENNEKE, WAYNE (415 DIANA DR; small business) : $12,948 in 2 contractsfrom 2005 to 2006
$6,500 with Army for Custodial Janitorial Services. Taking place in IA. Signed on 2006-02-01. Completion date: 2006-03-31.
$6,448, same as above.Signed on 2005-03-23. Completion date: 2006-03-31.
HARLA JEAN COUNTRYMAN (HARLA JEAN COUNTRYMAN; small business)
$11,040 with U.S. Army Corps of Engineers - civil program financing only for Custodial Janitorial Services. Taking place in IA. Signed on 2003-01-02. Completion date: 2004-02-29.
SULLIVAN, DAROL (402 NORTH CESAR CHAVEZ RD; small business) : $5,220 in 2 contractsin 2003
$5,220 with U.S. Army Corps of Engineers - civil program financing only for Operation of Government-Owned Facilities -- Recreation Facilities (Non-Building). Signed on 2003-03-06. Completion date: 2002-01-08.
$0, same as above.Signed on 2003-03-06. Completion date: 2002-01-08.
Top industries in this zip code by the number of employees in 2005:
2002 - 2018 National Fire Incident Reporting System (NFIRS) incidents
Based on the data from the years 2002 - 2018 the average number of fire incidents per year is 149. The highest number of reported fires - 226 took place in 2005, and the least - 69 in 2002. The data has a rising trend.
When looking into fire subcategories, the most reports belonged to: Outside Fires (64.9%), and Mobile Property/Vehicle Fires (15.5%).
Fire incident types reported to NFIRS in Zip Code 78516


+$2,544
-$9,403
(% of AGI for various income ranges: -0.2% for AGIs below $10k, -0.1% for AGIs $25k-50k, 0.8% for AGIs $50k-75k, -0.1% for AGIs over 100k)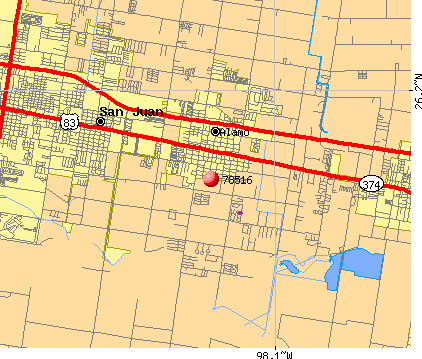 Nearest zip codes: 78589, 78537, 78577, 78557, 78503, 78596.


 Based on the data from the years 2002 - 2018 the average number of fire incidents per year is 149. The highest number of reported fires - 226 took place in 2005, and the least - 69 in 2002. The data has a rising trend.
 When looking into fire subcategories, the most reports belonged to: Outside Fires (64.9%), and Mobile Property/Vehicle Fires (15.5%).