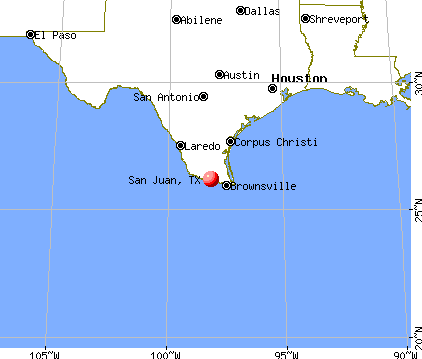
San Juan, Texas
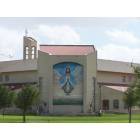
San Juan: Our Lady of San Juan Basilica
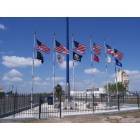
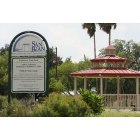
San Juan: San Juan Liberty Park
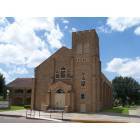
San Juan: Church
San Juan
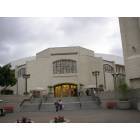
San Juan: Explorers Trail Park

San Juan: Cesar Chavez Memorial
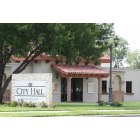
San Juan: San Juan City Hall
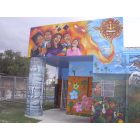
San Juan: Mural at the San Juan municipal pool.
San Juan: San Juan Church
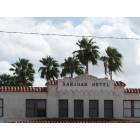
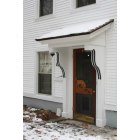
San Juan: San Juan Historical Hotel
- add
your
Submit your own pictures of this city and show them to the world
- OSM Map
- General Map
- Google Map
- MSN Map
Population change since 2000: +36.4%
| Males: 18,539 | |
| Females: 17,243 |
| Median resident age: | 30.0 years |
| Texas median age: | 35.6 years |
Zip codes: 78589.
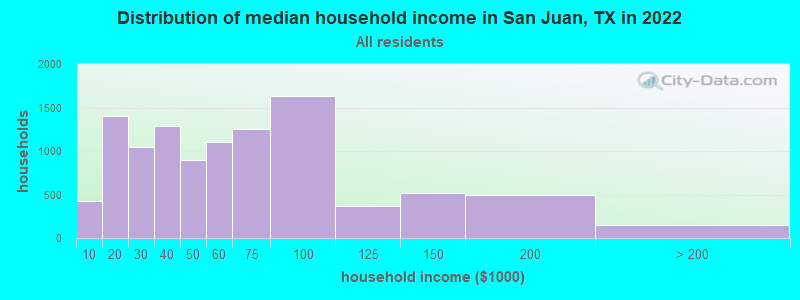
| San Juan: | $51,258 |
| TX: | $72,284 |
Estimated per capita income in 2022: $17,921 (it was $7,945 in 2000)
San Juan city income, earnings, and wages data
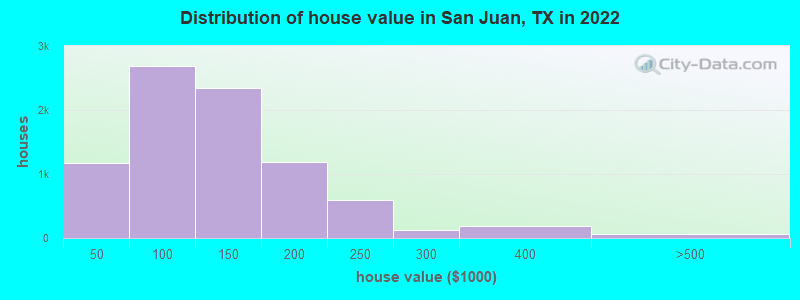
Estimated median house or condo value in 2022: $118,871 (it was $41,100 in 2000)
| San Juan: | $118,871 |
| TX: | $275,400 |
Mean prices in 2022: all housing units: $151,906; detached houses: $157,320; townhouses or other attached units: $131,668; mobile homes: $79,621
Median gross rent in 2022: $882.
(4.0% for White Non-Hispanic residents, 28.6% for Black residents, 24.3% for Hispanic or Latino residents, 17.5% for other race residents, 23.9% for two or more races residents)
Detailed information about poverty and poor residents in San Juan, TX

Compare current foreclosures near San Juan, TX:
| Photo | Address | Area | Beds / Baths | Price | Details |
|---|---|---|---|---|---|

|
#1
San Marcos St
San Juan, TX 78589
|
1,437 sq. feet
|
2 baths 3 beds |
show details | |

|
#2
Taylor St
San Juan, TX 78589
|
1,116 sq. feet
|
2 baths 3 beds |
show details | |

|
#3
Sylvia Cir
San Juan, TX 78589
|
1,080 sq. feet
|
1 baths 3 beds |
show details | |

|
#4
E 15th St
San Juan, TX 78589
|
1,144 sq. feet
|
1 baths 3 beds |
show details | |

|
#5
Cole Ave
San Juan, TX 78589
|
1,095 sq. feet
|
1 baths 3 beds |
show details | |

|
#6
Cozumel Ln
San Juan, TX 78589
|
1,076 sq. feet
|
2 baths 3 beds |
show details | |

|
#7
E 7th St
San Juan, TX 78589
|
1,574 sq. feet
|
- baths 3 beds |
show details | |

|
#8
Athol St
San Juan, TX 78589
|
964 sq. feet
|
- baths 3 beds |
show details | |

|
#9
Treyson Dr
San Juan, TX 78589
|
1,230 sq. feet
|
- baths 3 beds |
show details | |

|
#10
Gonzalez Dr
San Juan, TX 78589
|
1,097 sq. feet
|
- baths 3 beds |
show details |
| Photo | Address | Area | Beds / Baths | Price | Details |
|---|---|---|---|---|---|

|
#11
Sunset St
San Juan, TX 78589
|
1,802 sq. feet
|
- baths 3 beds |
show details | |

|
#12
San Marcos St
San Juan, TX 78589
|
1,195 sq. feet
|
- baths 2 beds |
show details | |

|
#13
El Sauz St
San Juan, TX 78589
|
750 sq. feet
|
1 baths - beds |
show details | |

|
#14
Beatrice Ave
San Juan, TX 78589
|
1,737 sq. feet
|
- baths 3 beds |
show details | |

|
#15
Cardinal St
San Juan, TX 78589
|
1,168 sq. feet
|
- baths 3 beds |
show details | |

|
#16
E 7th St
San Juan, TX 78589
|
960 sq. feet
|
1 baths - beds |
show details | |

|
#17
Judean Ln
San Juan, TX 78589
|
1,620 sq. feet
|
- baths 3 beds |
show details | |

|
#18
Athol St
San Juan, TX 78589
|
- sq. feet
|
- baths - beds |
show details | |

|
#19
Lime St
San Juan, TX 78589
|
- sq. feet
|
- baths 2 beds |
show details | |

|
#20
Mesquite Dr
San Juan, TX 78589
|
- sq. feet
|
- baths - beds |
show details |
| Photo | Address | Area | Beds / Baths | Price | Details |
|---|---|---|---|---|---|

|
#21
Pueblo St
San Juan, TX 78589
|
- sq. feet
|
- baths - beds |
show details | |

|
#22
E Leticia St
San Juan, TX 78589
|
- sq. feet
|
- baths 2 beds |
show details | |

|
#23
S Lincoln Ave
San Juan, TX 78589
|
- sq. feet
|
- baths - beds |
show details | |

|
#24
Mile 10 N
Mercedes, TX 78570
|
1,324 sq. feet
|
2 baths 3 beds |
$62,200
|
show details |

|
#25
Lion Lake Dr N
Weslaco, TX 78596
|
3,556 sq. feet
|
4 baths 5 beds |
$289,900
|
show details |

|
#26
N Stewart Rd
Mission, TX 78573
|
- sq. feet
|
6 baths 8 beds |
$599,900
|
show details |

|
#27
Vincent
Donna, TX 78537
|
- sq. feet
|
2 baths 3 beds |
show details | |

|
#28
Peacock St
Donna, TX 78537
|
1,318 sq. feet
|
2 baths 3 beds |
show details | |

|
#29
Green Jay Dr
Mission, TX 78572
|
- sq. feet
|
2 baths 3 beds |
show details | |

|
#30
W 30th St
Mission, TX 78574
|
- sq. feet
|
2 baths 3 beds |
show details |
| Photo | Address | Area | Beds / Baths | Price | Details |
|---|---|---|---|---|---|

|
#31
E Cheyenne Ave
Pharr, TX 78577
|
2,570 sq. feet
|
2 baths 3 beds |
show details | |

|
#32
Tiffany Drive
Mission, TX 78573
|
1,990 sq. feet
|
2 baths 3 beds |
show details | |

|
#33
Salvador St
Weslaco, TX 78596
|
- sq. feet
|
2 baths 3 beds |
show details | |

|
#34
Black Oak Ln
Mission, TX 78573
|
1,851 sq. feet
|
2 baths 3 beds |
show details | |

|
#35
Irene St
Weslaco, TX 78596
|
- sq. feet
|
2 baths 3 beds |
show details | |

|
#36
Sorrento St
Edinburg, TX 78542
|
2,869 sq. feet
|
2 baths 4 beds |
show details | |

|
#37
Santa Fe Street
Edinburg, TX 78542
|
1,733 sq. feet
|
2 baths 3 beds |
show details | |

|
#38
Zinnia Ave
Mcallen, TX 78504
|
1,965 sq. feet
|
2 baths 3 beds |
show details | |

|
#39
Peacock Dr
Donna, TX 78537
|
1,083 sq. feet
|
1 baths 3 beds |
show details | |

|
#40
Jasper Dr
Weslaco, TX 78596
|
1,810 sq. feet
|
2 baths 3 beds |
show details |
| Photo | Address | Area | Beds / Baths | Price | Details |
|---|---|---|---|---|---|

|
#41
San Rodrigo
Mission, TX 78572
|
2,518 sq. feet
|
3 baths 4 beds |
show details | |

|
#42
Jackie St
Edinburg, TX 78539
|
2,420 sq. feet
|
2 baths 3 beds |
show details | |

|
#43
Norma Ln
Edinburg, TX 78539
|
1,951 sq. feet
|
1 baths 3 beds |
show details | |

|
#44
Toledo Ave
Edinburg, TX 78541
|
- sq. feet
|
3 baths 3 beds |
show details | |

|
#45
N 42nd St
Mcallen, TX 78504
|
1,646 sq. feet
|
2 baths 3 beds |
show details | |

|
#46
Cedar Ave
Mcallen, TX 78501
|
1,944 sq. feet
|
2 baths 3 beds |
show details | |

|
#47
Q St
Hidalgo, TX 78557
|
- sq. feet
|
2 baths 3 beds |
show details | |

|
#48
E Jackson Ave
Pharr, TX 78577
|
1,303 sq. feet
|
2 baths 3 beds |
show details | |

|
#49
Mata Blvd
Mission, TX 78572
|
1,587 sq. feet
|
2 baths 3 beds |
show details | |

|
Check over 1 million property listings on Foreclosure.com!
|
browse all offers | |||


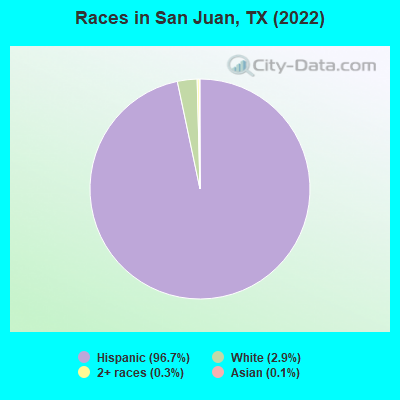
- 34,88196.7%Hispanic
- 1,0442.9%White alone
- 1180.3%Two or more races
- 450.1%Asian alone
- 210.06%Native Hawaiian and Other
Pacific Islander alone - 130.04%American Indian alone
- 50.01%Black alone
Races in San Juan detailed stats: ancestries, foreign born residents, place of birth
According to our research of Texas and other state lists, there were 87 registered sex offenders living in San Juan, Texas as of April 28, 2024.
The ratio of all residents to sex offenders in San Juan is 424 to 1.
The ratio of registered sex offenders to all residents in this city is near the state average.
Type |
2009 |
2010 |
2011 |
2012 |
2013 |
2014 |
2015 |
2016 |
2017 |
2018 |
2019 |
2020 |
2021 |
2022 |
|---|---|---|---|---|---|---|---|---|---|---|---|---|---|---|
| Murders (per 100,000) | 0 (0.0) | 3 (8.9) | 1 (2.9) | 2 (5.7) | 1 (2.8) | 2 (5.6) | 2 (5.4) | 1 (2.7) | 1 (2.7) | 1 (2.7) | 1 (2.7) | 1 (2.7) | 0 (0.0) | 0 (0.0) |
| Rapes (per 100,000) | 16 (45.9) | 31 (91.6) | 45 (130.2) | 31 (87.6) | 28 (78.7) | 44 (122.3) | 25 (68.1) | 24 (64.7) | 25 (67.4) | 20 (53.5) | 28 (74.6) | 15 (40.2) | 10 (26.8) | 12 (33.5) |
| Robberies (per 100,000) | 33 (94.6) | 31 (91.6) | 22 (63.6) | 16 (45.2) | 25 (70.2) | 17 (47.2) | 20 (54.5) | 15 (40.5) | 21 (56.6) | 14 (37.4) | 18 (47.9) | 15 (40.2) | 9 (24.1) | 14 (39.1) |
| Assaults (per 100,000) | 132 (378.3) | 158 (466.7) | 186 (538.1) | 152 (429.5) | 137 (385.0) | 132 (366.9) | 152 (414.0) | 107 (288.6) | 111 (299.1) | 126 (336.9) | 131 (348.9) | 111 (297.3) | 61 (163.4) | 71 (198.3) |
| Burglaries (per 100,000) | 378 (1,083) | 309 (912.7) | 221 (639.3) | 219 (618.7) | 200 (562.0) | 155 (430.8) | 188 (512.0) | 123 (331.8) | 111 (299.1) | 99 (264.7) | 101 (269.0) | 84 (225.0) | 50 (133.9) | 79 (220.6) |
| Thefts (per 100,000) | 1,303 (3,734) | 1,257 (3,713) | 1,093 (3,162) | 938 (2,650) | 813 (2,284) | 922 (2,562) | 800 (2,179) | 656 (1,769) | 715 (1,926) | 720 (1,925) | 711 (1,894) | 616 (1,650) | 433 (1,160) | 560 (1,564) |
| Auto thefts (per 100,000) | 98 (280.8) | 114 (336.7) | 77 (222.7) | 67 (189.3) | 58 (163.0) | 63 (175.1) | 48 (130.7) | 46 (124.1) | 51 (137.4) | 47 (125.7) | 47 (125.2) | 39 (104.5) | 35 (93.8) | 52 (145.2) |
| Arson (per 100,000) | 1 (2.9) | 1 (3.0) | 3 (8.7) | 2 (5.7) | 2 (5.6) | 0 (0.0) | 3 (8.2) | 2 (5.4) | 1 (2.7) | 1 (2.7) | 1 (2.7) | 3 (8.0) | 0 (0.0) | 2 (5.6) |
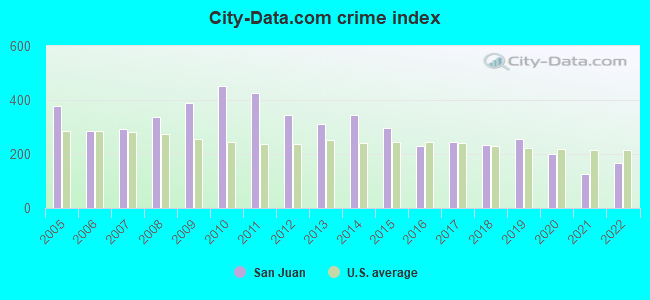
| City-Data.com crime index | 388.4 | 451.1 | 425.7 | 345.3 | 310.4 | 343.1 | 297.9 | 231.0 | 245.1 | 232.3 | 253.8 | 199.1 | 124.6 | 167.8 |
The City-Data.com crime index weighs serious crimes and violent crimes more heavily. Higher means more crime, U.S. average is 246.1. It adjusts for the number of visitors and daily workers commuting into cities.
Crime rate in San Juan detailed stats: murders, rapes, robberies, assaults, burglaries, thefts, arson
Full-time law enforcement employees in 2020, including police officers: 59 (43 officers - 40 male; 3 female).
| Officers per 1,000 residents here: | 1.15 |
| Texas average: | 2.05 |
 Recent articles from our blog. Our writers, many of them Ph.D. graduates or candidates, create easy-to-read articles on a wide variety of topics.

 | Hispanics are officially the biggest share of Texas's population. (123 replies) |
| American Airlines establishing a hub in Austin? (76 replies) |
| Any palms/tropical vegetation left in Texas? (41 replies) |
| Massive I-45 project will remake Houston freeway spine (123 replies) |
| San Antonio Re-visit (27 replies) |
| What is it like for a white person living in McAllen/ Edinburg? (61 replies) |
Latest news from San Juan, TX collected exclusively by city-data.com from local newspapers, TV, and radio stations
Current Local Time: CST time zone
Land area: 11.0 square miles.
Population density: 3,251 people per square mile (average).
9,512 residents are foreign born (25.8% Latin America).
| This city: | 26.4% |
| Texas: | 17.1% |
Median real estate property taxes paid for housing units with mortgages in 2022: $3,450 (2.1%)
Median real estate property taxes paid for housing units with no mortgage in 2022: $1,536 (1.7%)
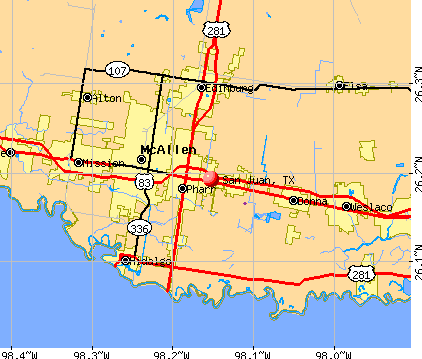
Nearest city with pop. 50,000+: McAllen, TX  (5.4 miles , pop. 106,414).
Nearest city with pop. 200,000+: Corpus Christi, TX (116.8 miles , pop. 277,454).
Nearest city with pop. 1,000,000+: San Antonio, TX (226.5 miles , pop. 1,144,646).
Nearest cities:
), ), ), ), ), Latitude: 26.19 N, Longitude: 98.15 W
Daytime population change due to commuting: -7,350 (-20.4%)
Workers who live and work in this city: 3,022 (20.3%)
Area code commonly used in this area: 956
Property values in San Juan, TX
San Juan, Texas accommodation & food services, waste management - Economy and Business Data
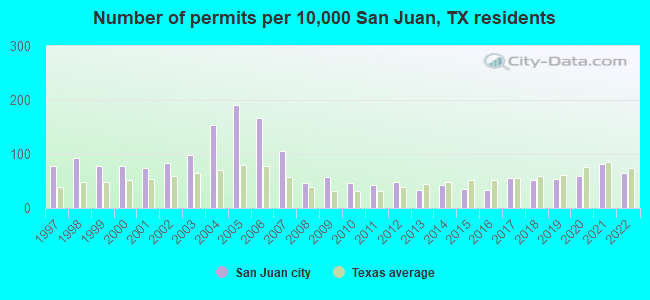
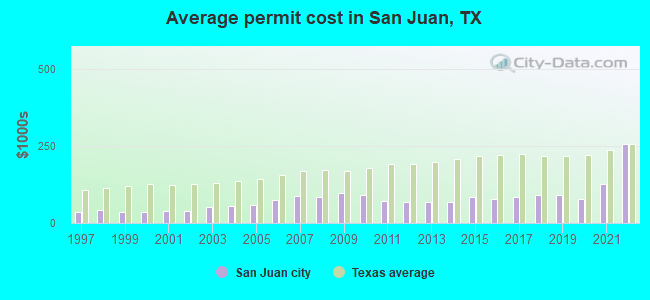
Single-family new house construction building permits:
- 2022: 168 buildings, average cost: $256,200
- 2021: 213 buildings, average cost: $127,900
- 2020: 155 buildings, average cost: $79,200
- 2019: 140 buildings, average cost: $90,800
- 2018: 137 buildings, average cost: $92,400
- 2017: 147 buildings, average cost: $83,200
- 2016: 89 buildings, average cost: $77,000
- 2015: 92 buildings, average cost: $83,000
- 2014: 110 buildings, average cost: $67,700
- 2013: 87 buildings, average cost: $68,400
- 2012: 128 buildings, average cost: $67,000
- 2011: 111 buildings, average cost: $72,700
- 2010: 123 buildings, average cost: $89,700
- 2009: 153 buildings, average cost: $98,800
- 2008: 122 buildings, average cost: $84,400
- 2007: 276 buildings, average cost: $88,300
- 2006: 435 buildings, average cost: $75,900
- 2005: 501 buildings, average cost: $59,400
- 2004: 405 buildings, average cost: $54,100
- 2003: 259 buildings, average cost: $52,000
- 2002: 221 buildings, average cost: $40,200
- 2001: 195 buildings, average cost: $40,300
- 2000: 202 buildings, average cost: $37,000
- 1999: 202 buildings, average cost: $36,700
- 1998: 242 buildings, average cost: $42,800
- 1997: 201 buildings, average cost: $36,400
| Here: | 6.6% |
| Texas: | 3.5% |
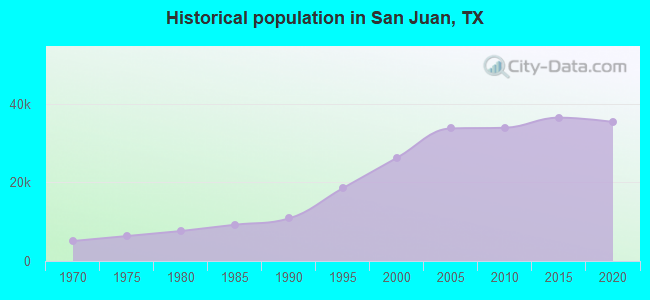
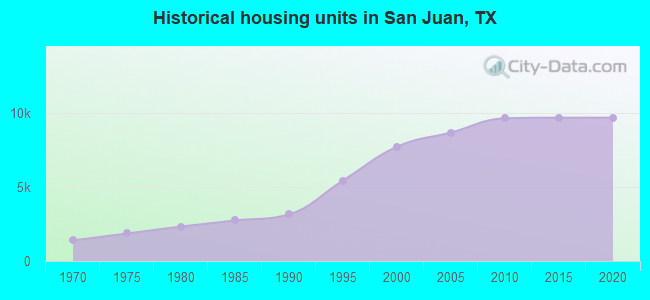
Population change in the 1990s: +11,226 (+74.8%).
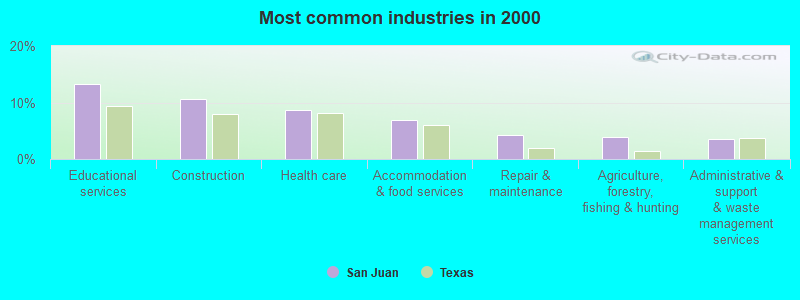
- Educational services (13.3%)
- Construction (10.5%)
- Health care (8.6%)
- Accommodation & food services (6.8%)
- Repair & maintenance (4.3%)
- Agriculture, forestry, fishing & hunting (3.8%)
- Administrative & support & waste management services (3.6%)
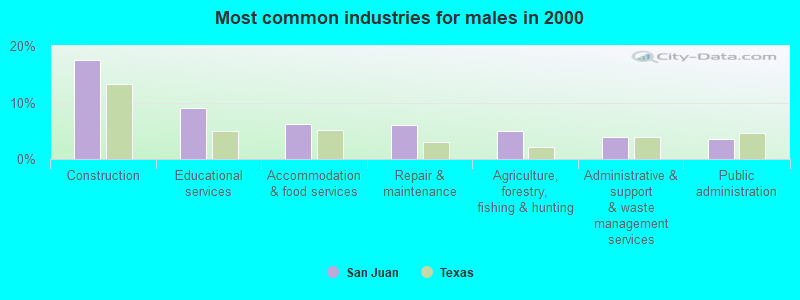
- Construction (17.6%)
- Educational services (9.0%)
- Accommodation & food services (6.1%)
- Repair & maintenance (5.9%)
- Agriculture, forestry, fishing & hunting (5.0%)
- Administrative & support & waste management services (4.0%)
- Public administration (3.5%)
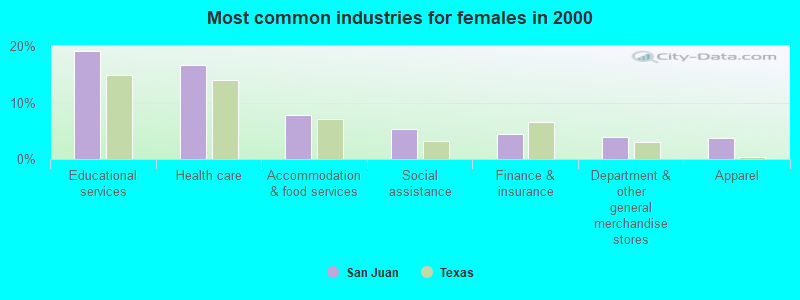
- Educational services (19.2%)
- Health care (16.6%)
- Accommodation & food services (7.8%)
- Social assistance (5.3%)
- Finance & insurance (4.5%)
- Department & other general merchandise stores (3.8%)
- Apparel (3.7%)
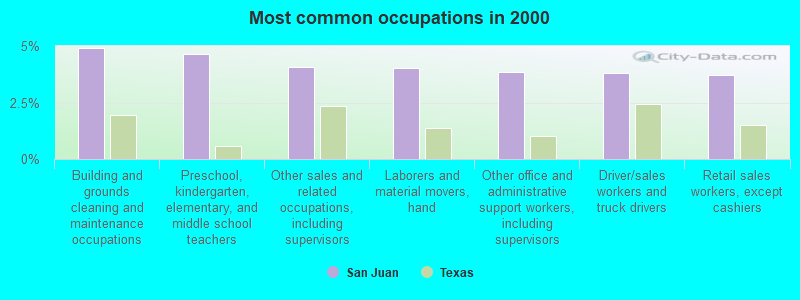
- Building and grounds cleaning and maintenance occupations (4.9%)
- Preschool, kindergarten, elementary, and middle school teachers (4.7%)
- Other sales and related occupations, including supervisors (4.1%)
- Laborers and material movers, hand (4.0%)
- Other office and administrative support workers, including supervisors (3.8%)
- Driver/sales workers and truck drivers (3.8%)
- Retail sales workers, except cashiers (3.7%)
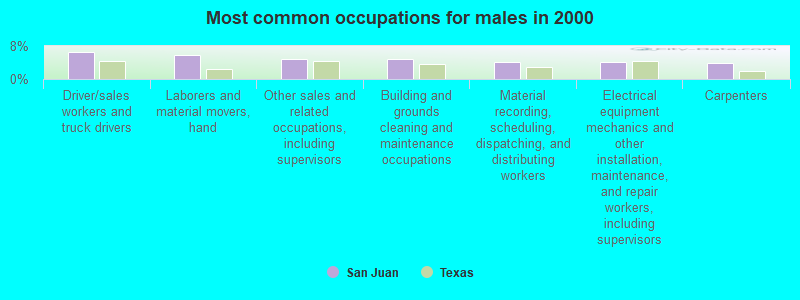
- Driver/sales workers and truck drivers (6.6%)
- Laborers and material movers, hand (5.7%)
- Other sales and related occupations, including supervisors (4.9%)
- Building and grounds cleaning and maintenance occupations (4.8%)
- Material recording, scheduling, dispatching, and distributing workers (4.2%)
- Electrical equipment mechanics and other installation, maintenance, and repair workers, including supervisors (4.1%)
- Carpenters (3.8%)
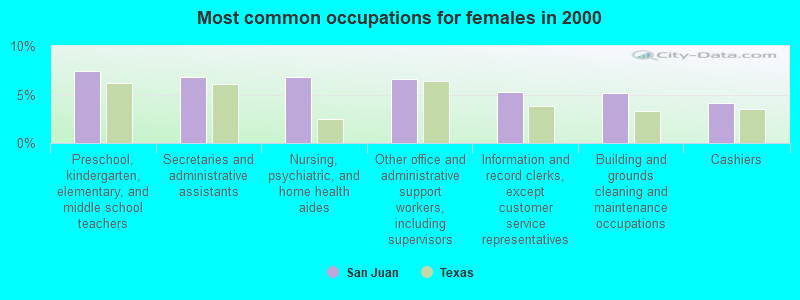
- Preschool, kindergarten, elementary, and middle school teachers (7.4%)
- Secretaries and administrative assistants (6.8%)
- Nursing, psychiatric, and home health aides (6.8%)
- Other office and administrative support workers, including supervisors (6.6%)
- Information and record clerks, except customer service representatives (5.3%)
- Building and grounds cleaning and maintenance occupations (5.1%)
- Cashiers (4.1%)
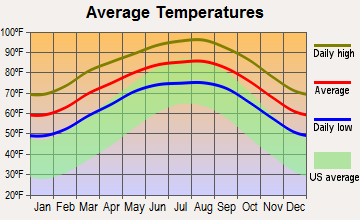
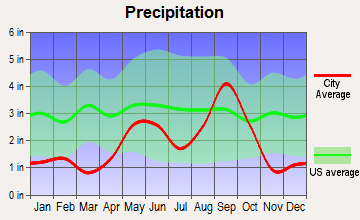
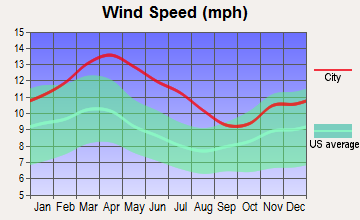
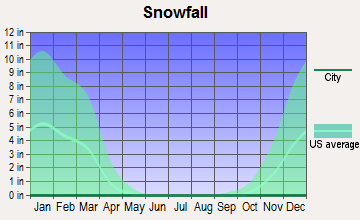
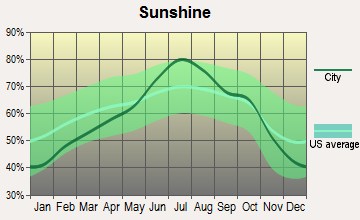
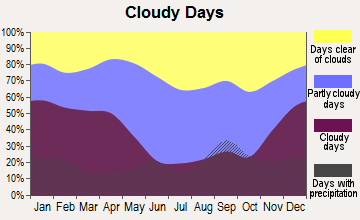
Average climate in San Juan, Texas
Based on data reported by over 4,000 weather stations

(lower is better)
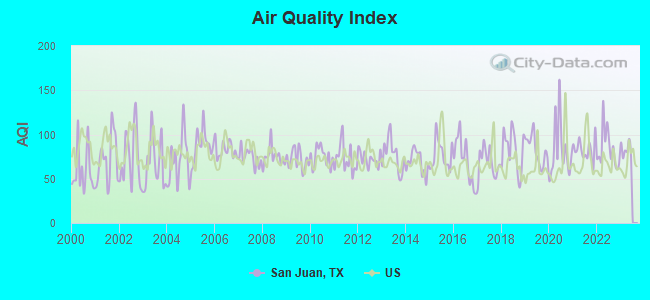
Air Quality Index (AQI) level in 2022 was 83.7. This is about average.
| City: | 83.7 |
| U.S.: | 72.6 |
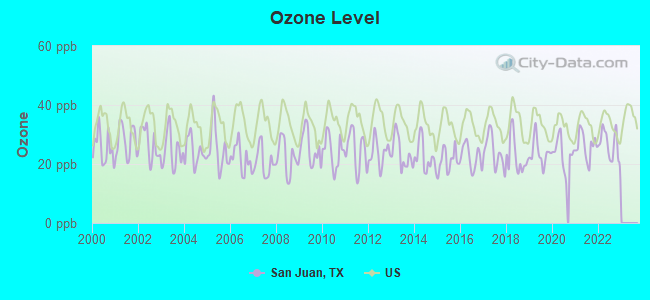
Ozone [ppb] level in 2022 was 26.4. This is better than average. Closest monitor was 8.9 miles away from the city center.
| City: | 26.4 |
| U.S.: | 33.3 |
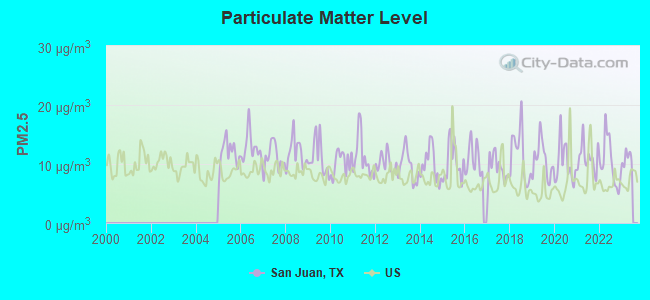
Particulate Matter (PM2.5) [µg/m3] level in 2022 was 10.2. This is worse than average. Closest monitor was 6.7 miles away from the city center.
| City: | 10.2 |
| U.S.: | 8.1 |
Tornado activity:
San Juan-area historical tornado activity is significantly below Texas state average. It is 78% smaller than the overall U.S. average.
On 5/12/1969, a category F3 (max. wind speeds 158-206 mph) tornado 29.4 miles away from the San Juan city center caused between $5000 and $50,000 in damages.
On 5/12/1969, a category F3 tornado 34.9 miles away from the city center caused between $5000 and $50,000 in damages.
Earthquake activity:
San Juan-area historical earthquake activity is slightly below Texas state average. It is 80% smaller than the overall U.S. average.On 10/20/2011 at 12:24:41, a magnitude 4.8 (4.8 MW, Depth: 3.1 mi, Class: Light, Intensity: IV - V) earthquake occurred 184.9 miles away from San Juan center
On 4/14/1995 at 00:32:56, a magnitude 5.7 (5.6 MB, 5.7 MS, 5.7 MW, Depth: 11.1 mi, Class: Moderate, Intensity: VI - VII) earthquake occurred 425.2 miles away from the city center
On 4/9/1993 at 12:29:19, a magnitude 4.3 (4.1 MB, 4.3 LG, Depth: 3.1 mi) earthquake occurred 181.1 miles away from the city center
On 4/25/2010 at 02:10:42, a magnitude 3.9 (3.9 MB, Depth: 3.1 mi, Class: Light, Intensity: II - III) earthquake occurred 106.5 miles away from San Juan center
On 11/13/2017 at 11:23:01, a magnitude 3.9 (3.9 MD, Depth: 3.1 mi) earthquake occurred 106.7 miles away from the city center
On 3/24/1997 at 22:31:34, a magnitude 3.8 (3.8 LG, Depth: 3.1 mi) earthquake occurred 105.6 miles away from the city center
Magnitude types: regional Lg-wave magnitude (LG), body-wave magnitude (MB), duration magnitude (MD), surface-wave magnitude (MS), moment magnitude (MW)
Natural disasters:
The number of natural disasters in Hidalgo County (22) is greater than the US average (15).Major Disasters (Presidential) Declared: 12
Emergencies Declared: 7
Causes of natural disasters: Hurricanes: 12, Floods: 7, Storms: 6, Tornadoes: 3, Winds: 3, Fire: 1, Heavy Rain: 1, Tropical Storm: 1, Other: 1 (Note: some incidents may be assigned to more than one category).
Hospitals and medical centers in San Juan:
- SAN JUAN HOSPICE (200 WEST EXPRESSWAY 83 STE M AND N)
- ABILITY AND PERFORMANCE HOME CARE LLC (200 WEST EXPRESSWAY 83 SUITE C)
- AMERICARE NURSING SERVICES INC (1103 NORTH RAUL LONGORIA ROAD)
- PATIENT CARE SPECIALISTS (417 WEST FM 495)
- PROGRESSIVE SKILLED HOME HEALTH SERVICES (200 WEST EXPRESSWAY 83 SUITE N)
- SAN JUAN NURSING HOME INC (300 N NEBRASKA)
Colleges/universities with over 2000 students nearest to San Juan:
- South Texas College (about 7 miles; McAllen, TX; Full-time enrollment: 19,701)
- The University of Texas-Pan American (about 8 miles; Edinburg, TX; FT enrollment: 16,766)
- Texas State Technical College-Harlingen (about 31 miles; Harlingen, TX; FT enrollment: 3,700)
- The University of Texas at Brownsville (about 47 miles; Brownsville, TX; FT enrollment: 9,165)
- Texas A & M University-Kingsville (about 94 miles; Kingsville, TX; FT enrollment: 9,295)
- Texas A & M University-Corpus Christi (about 118 miles; Corpus Christi, TX; FT enrollment: 9,092)
- Del Mar College (about 118 miles; Corpus Christi, TX; FT enrollment: 5,213)
Public high schools in San Juan:
- IDEA COLLEGE PREPARATORY SAN JUAN (Students: 231, Location: 600 E SIOUX RD, Grades: 6-12, Charter school)
- PREMIER H S OF SAN JUAN (Location: 1202 E BUSINESS 83, Grades: 9-12, Charter school)
- PSJA EARLY COLLEGE H S (Location: 805 W RIDGE RD, Grades: 9-12)
- ELVIS J BALLEW H S (Location: 715 S STANDARD ST, Grades: 9-12)
- PSJA SONIA M SOTOMAYOR H S (Location: 1229 S VETERANS BLVD, Grades: 8-12)
Biggest public elementary/middle schools in San Juan:
- DRS REED - MOCK EL (Students: 903, Location: 400 E ELDORA RD, Grades: PK-5)
- JOHN DOEDYNS EL (Students: 652, Location: 1401 N RAUL LONGORIA RD, Grades: PK-5)
- IDEA ACADEMY SAN JUAN (Students: 101, Location: 200 N NEBRASKA AVE, Grades: KG-5, Charter school)
- AUSTIN MIDDLE (Location: 804 S STEWART RD, Grades: 6-8)
- ALFRED SORENSEN EL (Location: 701 E SAM HOUSTON, Grades: PK-5)
- ARNOLDO CANTU SR EL (Location: 2900 N R LONGORIA, Grades: PK-5)
- AMANDA GARZA-PENA EL (Location: 230 E SGT L TREVINO ST, Grades: PK-5)
- EDITH & ETHEL CARMAN EL (Location: 100 W RIDGE RD, Grades: PK-5)
- R YZAGUIRRE MIDDLE (Location: 1229 S I RD, Grades: 6-8)
- VIDA N CLOVER EL (Location: 800 E CARROL ST, Grades: PK-5)
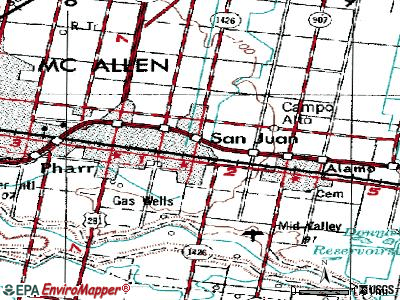
Points of interest:
Notable locations in San Juan: San Juan Fire Department Station 2 (A), San Juan Fire Department Station 1 (B), San Juan Police Department (C), San Juan Police Department - Administration (D), San Juan Police Department Substation (E), San Juan Public Library (F), Pro - Medic Emergency Medical Services (G). Display/hide their locations on the map
Churches in San Juan include: First Baptist Church of San Juan (A), Virgen de San Juan del Valle Shrine Church (B), The Peoples Covenant Church (C), Seventh Day Adventist Church (D). Display/hide their locations on the map
Cemetery: San Juan Cemetery (1). Display/hide its location on the map
Parks in San Juan include: San Juan City Park (1), Mayfield Park (2), Aldrich Park (3), City Park (4), Lions Park (5). Display/hide their locations on the map
| This city: | 3.8 people |
| Texas: | 2.8 people |
| This city: | 88.2% |
| Whole state: | 69.9% |
| This city: | 4.9% |
| Whole state: | 6.0% |
Likely homosexual households (counted as self-reported same-sex unmarried-partner households)
- Lesbian couples: 0.5% of all households
- Gay men: 0.4% of all households
9 people in other noninstitutional facilities in 2010
People in group quarters in San Juan in 2000:
- 119 people in nursing homes
- 6 people in homes or halfway houses for drug/alcohol abuse
- 5 people in homes for abused, dependent, and neglected children
- 5 people in religious group quarters
Banks with branches in San Juan (2011 data):
- Compass Bank: San Juan Main Branch at 235 West 5th Street, branch established on 1949/07/25; San Juan Expressway Branch at 901 W. Expressway 83, branch established on 2004/06/01. Info updated 2011/02/24: Bank assets: $63,107.0 mil, Deposits: $46,232.4 mil, headquarters in Birmingham, AL, negative income in the last year, Commercial Lending Specialization, 720 total offices, Holding Company: Banco Bilbao Vizcaya Argentaria, S.A.
- Rio Bank: San Juan Branch at 401 West Fm 495, branch established on 2002/04/15. Info updated 2006/11/03: Bank assets: $206.9 mil, Deposits: $173.8 mil, headquarters in Mcallen, TX, positive income, Commercial Lending Specialization, 7 total offices, Holding Company: Rio Financial Services, Inc.
- International Bank of Commerce: Instore Junior's Supermarket at 100 E. 495, branch established on 2005/11/24. Info updated 2007/03/28: Bank assets: $9,621.9 mil, Deposits: $6,548.8 mil, headquarters in Laredo, TX, positive income, Commercial Lending Specialization, 197 total offices, Holding Company: International Bancshares Corporation
- Bank of America, National Association: San Juan Corners Branch at 1701 East Expressway 83, branch established on 2009/12/01. Info updated 2009/11/18: Bank assets: $1,451,969.3 mil, Deposits: $1,077,176.8 mil, headquarters in Charlotte, NC, positive income, 5782 total offices, Holding Company: Bank Of America Corporation
For population 15 years and over in San Juan:
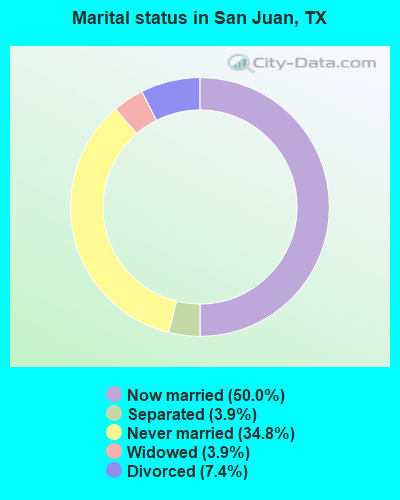
- Never married: 34.8%
- Now married: 50.0%
- Separated: 3.9%
- Widowed: 3.9%
- Divorced: 7.4%
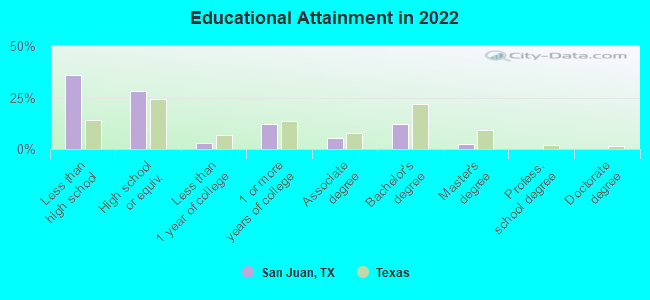
For population 25 years and over in San Juan:
- High school or higher: 63.4%
- Bachelor's degree or higher: 14.3%
- Graduate or professional degree: 2.9%
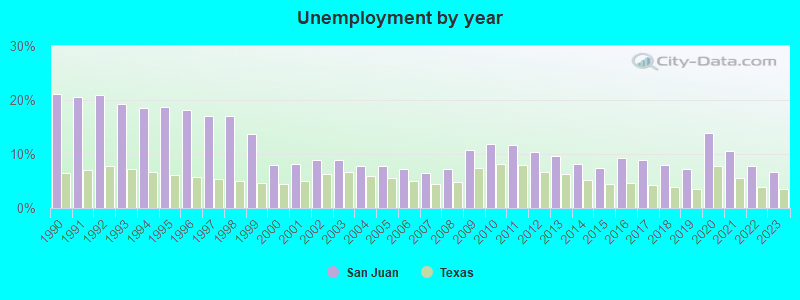
- Unemployed: 10.2%
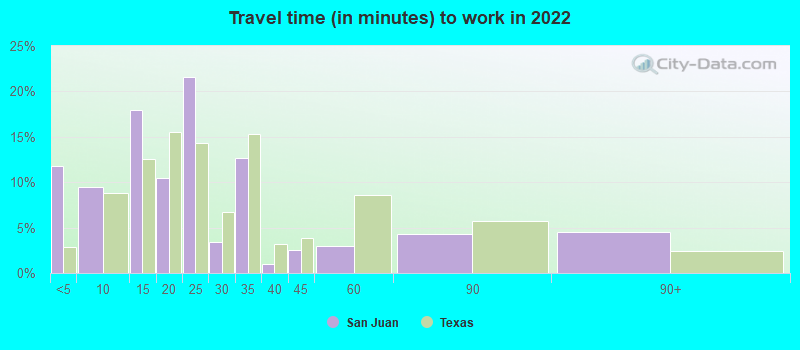
- Mean travel time to work (commute): 23.6 minutes
| Here: | 19.3 |
| Texas average: | 14.0 |
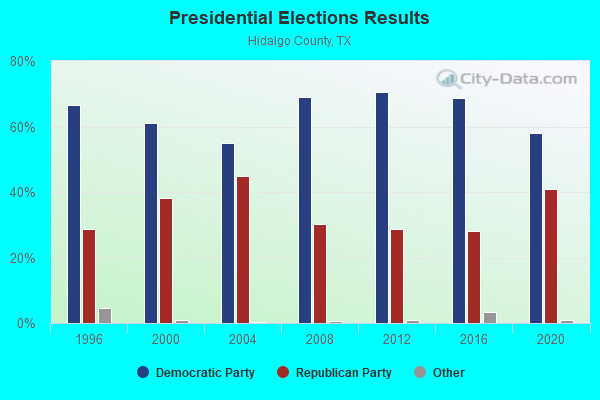
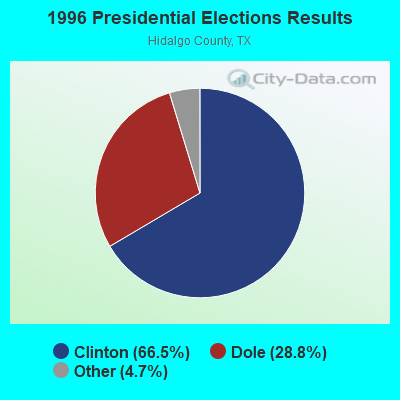
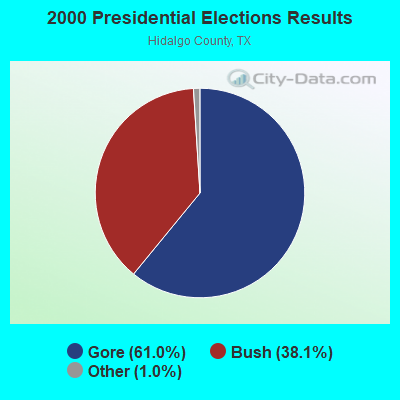
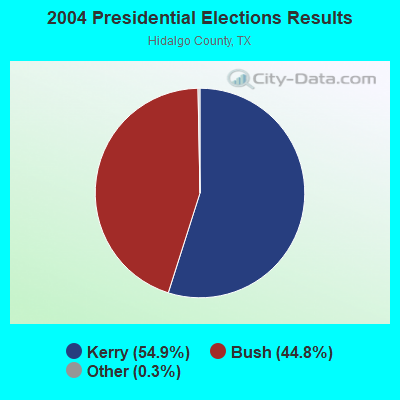
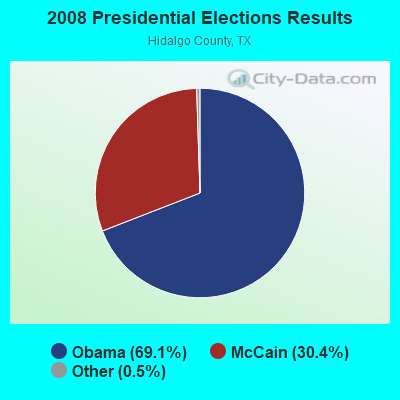
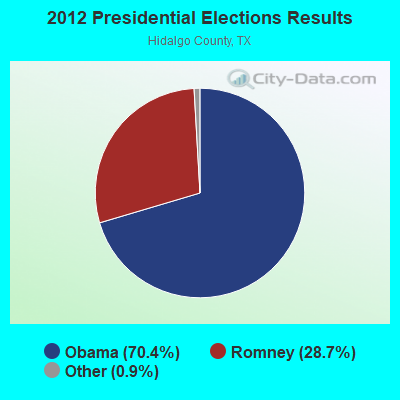
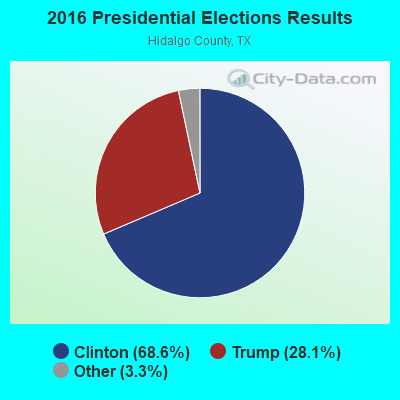
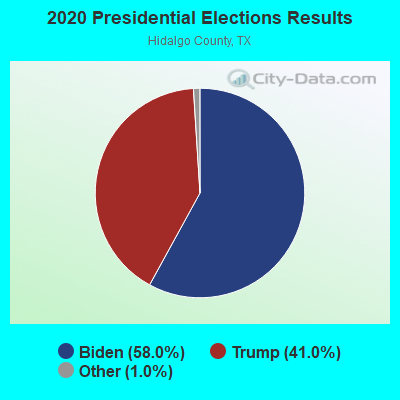
Graphs represent county-level data. Detailed 2008 Election Results
Religion statistics for San Juan, TX (based on Hidalgo County data)
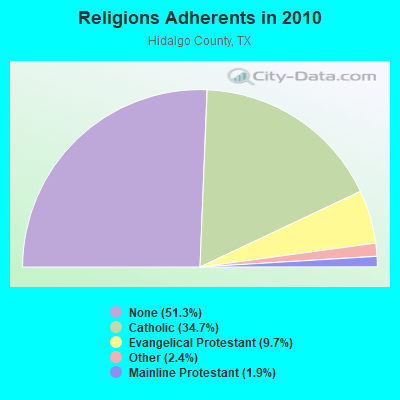
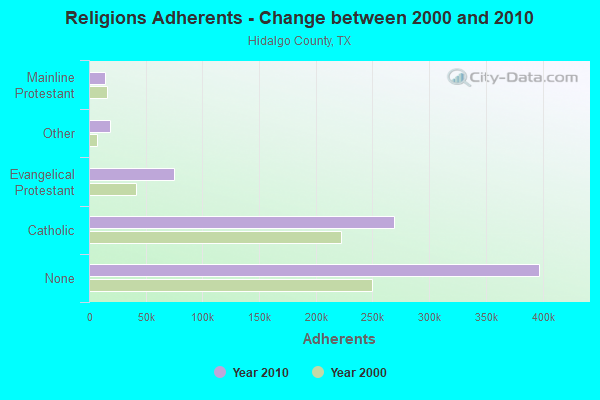
| Religion | Adherents | Congregations |
|---|---|---|
| Catholic | 269,071 | 56 |
| Evangelical Protestant | 75,327 | 525 |
| Other | 18,510 | 43 |
| Mainline Protestant | 14,394 | 52 |
| Orthodox | 160 | 1 |
| None | 397,307 | - |
Food Environment Statistics:
| Hidalgo County: | 1.12 / 10,000 pop. |
| State: | 1.47 / 10,000 pop. |
| Hidalgo County: | 0.09 / 10,000 pop. |
| Texas: | 0.14 / 10,000 pop. |
| Here: | 0.95 / 10,000 pop. |
| State: | 1.11 / 10,000 pop. |
| Here: | 3.40 / 10,000 pop. |
| State: | 3.95 / 10,000 pop. |
| Hidalgo County: | 4.78 / 10,000 pop. |
| Texas: | 6.13 / 10,000 pop. |
| Hidalgo County: | 9.7% |
| Texas: | 8.9% |
| Hidalgo County: | 28.7% |
| State: | 26.6% |
| Hidalgo County: | 15.8% |
| State: | 15.7% |
Health and Nutrition:
| San Juan: | 46.7% |
| State: | 48.6% |
| This city: | 47.1% |
| Texas: | 47.4% |
| San Juan: | 28.4 |
| Texas: | 28.5 |
| This city: | 21.4% |
| Texas: | 20.6% |
| San Juan: | 11.7% |
| Texas: | 10.3% |
| This city: | 6.8 |
| State: | 6.8 |
| This city: | 32.7% |
| State: | 33.1% |
| Here: | 53.5% |
| Texas: | 56.2% |
| San Juan: | 81.8% |
| State: | 80.7% |
More about Health and Nutrition of San Juan, TX Residents
| Local government employment and payroll (March 2022) | |||||
| Function | Full-time employees | Monthly full-time payroll | Average yearly full-time wage | Part-time employees | Monthly part-time payroll |
|---|---|---|---|---|---|
| Police Protection - Officers | 34 | $204,939 | $72,331 | 0 | $0 |
| Solid Waste Management | 25 | $58,813 | $28,230 | 0 | $0 |
| Other Government Administration | 25 | $131,861 | $63,293 | 0 | $0 |
| Firefighters | 24 | $101,752 | $50,876 | 0 | $0 |
| Water Supply | 21 | $42,520 | $24,297 | 0 | $0 |
| Streets and Highways | 18 | $41,572 | $27,715 | 0 | $0 |
| Parks and Recreation | 14 | $34,184 | $29,301 | 11 | $9,108 |
| Sewerage | 9 | $18,577 | $24,769 | 0 | $0 |
| Other and Unallocable | 8 | $17,676 | $26,514 | 0 | $0 |
| Financial Administration | 7 | $27,262 | $46,735 | 0 | $0 |
| Housing and Community Development (Local) | 7 | $22,411 | $38,419 | 0 | $0 |
| Local Libraries | 5 | $17,084 | $41,002 | 1 | $956 |
| Health | 1 | $3,022 | $36,264 | 0 | $0 |
| Judicial and Legal | 1 | $3,378 | $40,536 | 0 | $0 |
| Police - Other | 1 | $5,616 | $67,392 | 0 | $0 |
| Totals for Government | 200 | $730,666 | $43,840 | 12 | $10,064 |
San Juan government finances - Expenditure in 2017 (per resident):
- Construction - Libraries: $2,176,000 ($60.81)
Water Utilities: $593,000 ($16.57)
Sewerage: $593,000 ($16.57)
Regular Highways: $193,000 ($5.39)
Parks and Recreation: $126,000 ($3.52)
- Current Operations - Police Protection: $3,938,000 ($110.06)
Solid Waste Management: $2,468,000 ($68.97)
Central Staff Services: $2,347,000 ($65.59)
Sewerage: $2,135,000 ($59.67)
Water Utilities: $1,783,000 ($49.83)
Parks and Recreation: $1,554,000 ($43.43)
Regular Highways: $1,500,000 ($41.92)
Local Fire Protection: $1,464,000 ($40.91)
Natural Resources - Other: $964,000 ($26.94)
Financial Administration: $451,000 ($12.60)
Libraries: $318,000 ($8.89)
General - Other: $213,000 ($5.95)
Judicial and Legal Services: $156,000 ($4.36)
- General - Interest on Debt: $776,000 ($21.69)
- Other Capital Outlay - Police Protection: $161,000 ($4.50)
Water Utilities: $157,000 ($4.39)
Local Fire Protection: $121,000 ($3.38)
Solid Waste Management: $29,000 ($0.81)
Central Staff Services: $17,000 ($0.48)
Sewerage: $4,000 ($0.11)
Libraries: $4,000 ($0.11)
- Total Salaries and Wages: $6,257,000 ($174.86)
- Water Utilities - Interest on Debt: $196,000 ($5.48)
San Juan government finances - Revenue in 2017 (per resident):
- Charges - Sewerage: $2,948,000 ($82.39)
Solid Waste Management: $2,865,000 ($80.07)
Other: $1,334,000 ($37.28)
Parks and Recreation: $109,000 ($3.05)
- Federal Intergovernmental - Other: $651,000 ($18.19)
- Local Intergovernmental - Other: $92,000 ($2.57)
- Miscellaneous - General Revenue - Other: $287,000 ($8.02)
Fines and Forfeits: $208,000 ($5.81)
Interest Earnings: $44,000 ($1.23)
Donations From Private Sources: $18,000 ($0.50)
Rents: $14,000 ($0.39)
Special Assessments: $5,000 ($0.14)
- Revenue - Water Utilities: $2,514,000 ($70.26)
- State Intergovernmental - Other: $328,000 ($9.17)
General Local Government Support: $3,000 ($0.08)
- Tax - Property: $7,105,000 ($198.56)
General Sales and Gross Receipts: $3,341,000 ($93.37)
Public Utilities Sales: $734,000 ($20.51)
Occupation and Business License - Other: $352,000 ($9.84)
Amusements Sales: $54,000 ($1.51)
Other Selective Sales: $25,000 ($0.70)
Alcoholic Beverage License: $1,000 ($0.03)
San Juan government finances - Debt in 2017 (per resident):
- Long Term Debt - Beginning Outstanding - Unspecified Public Purpose: $24,562,000 ($686.43)
Outstanding Unspecified Public Purpose: $19,632,000 ($548.66)
Retired Unspecified Public Purpose: $4,930,000 ($137.78)
San Juan government finances - Cash and Securities in 2017 (per resident):
- Bond Funds - Cash and Securities: $2,086,000 ($58.30)
- Other Funds - Cash and Securities: $12,629,000 ($352.94)
- Sinking Funds - Cash and Securities: $235,000 ($6.57)
2.90% of this county's 2021 resident taxpayers lived in other counties in 2020 ($46,406 average adjusted gross income)
| Here: | 2.90% |
| Texas average: | 8.12% |
0.01% of residents moved from foreign countries ($200 average AGI)
Hidalgo County: 0.01% Texas average: 0.04%
Top counties from which taxpayers relocated into this county between 2020 and 2021:
| from Cameron County, TX | |
| from Harris County, TX | |
| from Bexar County, TX |
2.73% of this county's 2020 resident taxpayers moved to other counties in 2021 ($45,511 average adjusted gross income)
| Here: | 2.73% |
| Texas average: | 7.40% |
0.01% of residents moved to foreign countries ($147 average AGI)
Hidalgo County: 0.01% Texas average: 0.03%
Top counties to which taxpayers relocated from this county between 2020 and 2021:
| to Cameron County, TX | |
| to Bexar County, TX | |
| to Harris County, TX |
| Businesses in San Juan, TX | ||||
| Name | Count | Name | Count | |
|---|---|---|---|---|
| Audi | 1 | McDonald's | 1 | |
| AutoZone | 1 | Pizza Hut | 1 | |
| Church's Chicken | 1 | Subway | 3 | |
| Cricket Wireless | 9 | Walgreens | 1 | |
| Little Caesars Pizza | 1 | |||
Strongest AM radio stations in San Juan:
- KUBR (1210 AM; 10 kW; SAN JUAN, TX; Owner: PAULINO BERNAL)
- KURV (710 AM; 10 kW; EDINBURG, TX; Owner: VOICE OF VALLEY AGRICULTURE, INC.)
- KRIO (910 AM; 5 kW; MCALLEN, TX; Owner: RIO GRANDE BIBLE INSTITUTE, INC.)
- KGBT (1530 AM; 50 kW; HARLINGEN, TX; Owner: TICHENOR LICENSE CORPORATION)
- KVJY (840 AM; 5 kW; PHARR, TX; Owner: RADIO UNICA OF MCALLEN LICENSE CORP.)
- KRGE (1290 AM; 5 kW; WESLACO, TX; Owner: CHRISTIAN MINISTRIES OF THE VALLEY)
- KQXX (1700 AM; 10 kW; BROWNSVILLE, TX; Owner: LA NUEVA KBOR, INC.)
- KBOR (1600 AM; 10 kW; BROWNSVILLE, TX; Owner: LA NUEVA KBOR, INC.)
- KIRT (1580 AM; 1 kW; MISSION, TX; Owner: BRAVO BROADCASTING COMPANY, INC.)
- KCTA (1030 AM; 50 kW; CORPUS CHRISTI, TX; Owner: BROADCASTING CORPORATION OF THE SOUTHWEST)
- KKYX (680 AM; 50 kW; SAN ANTONIO, TX; Owner: CXR HOLDINGS, INC.)
- KTKR (760 AM; 50 kW; SAN ANTONIO, TX; Owner: CCB TEXAS LICENSES, L.P.)
- KSOX (1240 AM; 1 kW; RAYMONDVILLE, TX; Owner: VOICE OF VALLEY AGRICULTURE, INC.)
Strongest FM radio stations in San Juan:
- KJAV (104.9 FM; ALAMO, TX; Owner: PAULINO BERNAL)
- KOIR (88.5 FM; EDINBURG, TX; Owner: RIO GRANDE BIBLE INSTITUTE, INC.)
- KVLY (107.9 FM; EDINBURG, TX; Owner: ENTRAVISION HOLDINGS, L.L.C.)
- KTEX (100.3 FM; BROWNSVILLE, TX; Owner: CAPSTAR TX LIMITED PARTNERSHIP)
- KBFM (104.1 FM; EDINBURG, TX; Owner: CAPSTAR TX LIMITED PARTNERSHIP)
- KVMV (96.9 FM; MCALLEN, TX; Owner: WORLD RADIO NETWORK, INC.)
- KFRQ (94.5 FM; HARLINGEN, TX; Owner: ENTRAVISION HOLDINGS, L.L.C.)
- KGBT-FM (98.5 FM; MCALLEN, TX; Owner: TICHENOR LICENSE CORPORATION ("TLC"))
- KBTQ (96.1 FM; HARLINGEN, TX; Owner: TICHENOR LICENSE CORPORATION ("TLC"))
- KKPS (99.5 FM; BROWNSVILLE, TX; Owner: ENTRAVISION HOLDINGS, L.L.C.)
- KMAZ (106.3 FM; MERCEDES, TX; Owner: LA NUEVA KBOR, INC.)
- KQXX-FM (105.5 FM; MISSION, TX; Owner: LA NUEVA KBOR, INC.)
- KQBO (103.1 FM; RIO GRANDE CITY, TX; Owner: SOUND INVESTMENTS UNLIMITED, INC.)
- KHID (88.1 FM; MCALLEN, TX; Owner: RGV EDUCATIONAL BROADCASTING, INC.)
- KCAS (91.5 FM; MCCOOK, TX; Owner: FAITH BAPTIST CHURCH INC)
- K248AM (97.5 FM; MCALLEN, TX; Owner: WORLD RADIO NETWORK, INC.)
TV broadcast stations around San Juan:
- KTLM (Channel 40; RIO GRANDE CITY, TX; Owner: SUNBELT MULTIMEDIA CO.)
- KSFE-LP (Channel 67; McALLEN, TX; Owner: ORTIZ BROADCASTING CORPORATION)
- KNVO (Channel 48; Mc ALLEN, TX; Owner: ENTRAVISION HOLDINGS, LLC)
- KLIA-LP (Channel 32; McALLEN, TX; Owner: ORTIZ BROADCASTING CORPORATION)
- KRGV-TV (Channel 5; WESLACO, TX; Owner: MOBILE VIDEO TAPES, INC.)
- K57FE (Channel 57; MCALLEN, TX; Owner: CHANNEL 57, INC.)
- KZMC-LP (Channel 35; McALLEN, TX; Owner: ZAVALETTA BROADCASTING OF THE RIO GRANDE VALLEY, LLC)
- KVEO (Channel 23; BROWNSVILLE, TX; Owner: COMCORP OF TEXAS LICENSE CORP.)
- KSTI-LP (Channel 69; McALLEN, TX; Owner: FAITH PLEASES GOD CHURCH CORPORATION)
- KJST-LP (Channel 28; McALLEN, TX; Owner: FAITH PLEASES GOD CHURCH CORPORATION)
- KGBT-TV (Channel 4; HARLINGEN, TX; Owner: LIBCO, INC.)
- KMBH (Channel 60; HARLINGEN, TX; Owner: RGV EDUCATIONAL BROADCASTING, INC.)
- KLUJ (Channel 44; HARLINGEN, TX; Owner: COMMUNITY EDUCATIONAL TELEVISION)
- KFTN-LP (Channel 30; La FERIA, TX; Owner: ORTIZ BROADCASTING CORPORATION)
- KTIZ-LP (Channel 52; HARLINGEN, TX; Owner: ORTIZ BROADCASTING CORPORATION)
- National Bridge Inventory (NBI) Statistics
- 24Number of bridges
- 240ft / 73.3mTotal length
- $15,000Total costs
- 373,321Total average daily traffic
- 25,212Total average daily truck traffic
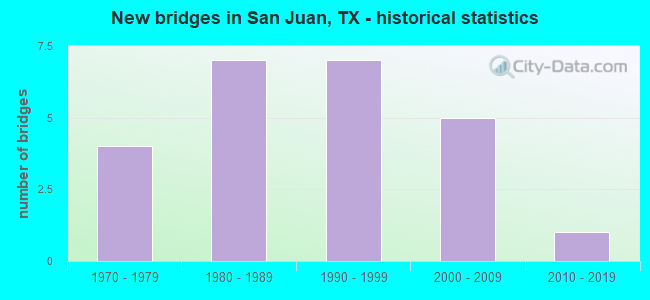
- New bridges - historical statistics
- 41970-1979
- 71980-1989
- 71990-1999
- 52000-2009
- 12010-2019
FCC Registered Antenna Towers:
27 (See the full list of FCC Registered Antenna Towers in San Juan)FCC Registered Broadcast Land Mobile Towers:
4- Us 281 1 Km W Of 281 & Fm 493 (Lat: 26.079528 Lon: -98.072500), Type: Pole, Structure height: 12 m, Call Sign: KNNP388,
Assigned Frequencies: 451.200 MHz, Grant Date: 03/27/1996, Expiration Date: 03/27/2001, Cancellation Date: 05/27/2001, Certifier: Amado E Salinas, Registrant: National License Corp, 9050 Briarclift Rd, Indianapolis, IN 46256, Fax: (317) 841-3328
- Lat: 26.187306 Lon: -98.155278, Call Sign: WQQE327,
Assigned Frequencies: 436.000 MHz, Grant Date: 08/29/2022, Expiration Date: 11/15/2032, Certifier: Juan Gonzalez, Registrant: Apco-Afc Spectrum Management Division Licensing Services 021712 Rs, 351 N. Williamson Blvd., Daytona Beach, FL 32114, Phone: (386) 944-2463, Fax: (386) 322-2502, Email:
- HCID2 OFFICE, 326 N Standard St (Lat: 26.192000 Lon: -98.158694), Type: Mtower, Structure height: 36.6 m, Call Sign: WQUB336,
Assigned Frequencies: 462.012 MHz, 467.012 MHz, Grant Date: 05/27/2014, Expiration Date: 05/27/2024, Certifier: Sonny Hinojusa, Registrant: Eagle Automation, 4455 South Padre Island Drive, Ste. 45, Corpus Christi, TX 78411, Phone: (361) 857-8446, Fax: (361) 857-8451, Email:
- PHS SAN JUAN, 1200 East Business Highway 83 (Lat: 26.186056 Lon: -98.136333), Call Sign: WRDX936,
Assigned Frequencies: 457.062 MHz, Grant Date: 08/16/2019, Expiration Date: 08/16/2029, Certifier: Steve Chaney, Registrant: Visiplex, Inc., 1287 North Barclay Boulevard, Buffalo Grove, IL 60089, Phone: (847) 229-0250, Fax: (847) 229-0259, Email:
FCC Registered Microwave Towers:
4- LOUIE, Fm 907 & Anaya Road (Louie #35193--Sou) (Lat: 26.100444 Lon: -98.140528), Type: Tower, Structure height: 58.2 m, Overall height: 60.3 m, Call Sign: WQIX523,
Assigned Frequencies: 10835.0 MHz, Grant Date: 06/10/2008, Expiration Date: 06/10/2018, Cancellation Date: 12/10/2009, Certifier: William Chastain, Registrant: Radio Dynamics Corporation, Silver Spring, MD 20914, Phone: (301) 493-5171, Fax: (301) 576-4553, Email:
- SA90XCDWBA, 4911-5017 Maya Dr (Lat: 26.241833 Lon: -98.152250), Type: Mtower, Structure height: 36.6 m, Call Sign: WQZI661,
Assigned Frequencies: 17965.0 MHz, 18015.0 MHz, 17965.0 MHz, 18015.0 MHz, 17965.0 MHz, 18015.0 MHz, 17965.0 MHz, 18015.0 MHz, 17965.0 MHz, 18015.0 MHz... (+10 more), Grant Date: 05/31/2017, Expiration Date: 05/31/2027, Cancellation Date: 08/10/2018, Certifier: Kyle Entz, Registrant: Sprint Corporation, 12502 Sunrise Valley Drive, M/S: Varesa0209, Reston, VA 20196, Phone: (800) 572-8256, Fax: (703) 433-4483, Email:
- P2Z1, No Exact Street Adress (Lat: 26.234694 Lon: -98.155278), Type: Building, Structure height: 29 m, Call Sign: WRMU522,
Assigned Frequencies: 10915.0 MHz, 10915.0 MHz, 10915.0 MHz, 10915.0 MHz, 10915.0 MHz, 10915.0 MHz, 10915.0 MHz, 10915.0 MHz, 10915.0 MHz, 10915.0 MHz... (+14 more), Grant Date: 06/07/2021, Expiration Date: 06/07/2031, Certifier: Daniel Salinas, Registrant: Intelpath, Hinsdale, IL 60522, Phone: (312) 841-9188, Email:
- P2Z2, No Exact Street Adress (Lat: 26.227111 Lon: -98.141472), Type: Building, Structure height: 19.8 m, Call Sign: WRMU523,
Assigned Frequencies: 11155.0 MHz, 11155.0 MHz, 11155.0 MHz, 11155.0 MHz, 11155.0 MHz, 11155.0 MHz, 11155.0 MHz, 11155.0 MHz, 11155.0 MHz, 11155.0 MHz... (+14 more), Grant Date: 06/07/2021, Expiration Date: 06/07/2031, Certifier: Daniel Salinas, Registrant: Intelpath, Hinsdale, IL 60522, Phone: (312) 841-9188, Email:
FCC Registered Paging Towers:
1- 200 W. Expressway 83 (Lat: 26.201389 Lon: -98.156389), Type: Pole, Structure height: 9.1 m, Overall height: 16.8 m, Call Sign: KWU326,
Assigned Frequencies: 454.850 MHz, 454.675 MHz, Expiration Date: 09/01/2009, Cancellation Date: 10/21/2004, Registrant: Skytel Corp., 500 Clinton Center Drive, Clinton, MS 39056, Phone: (601) 460-3890, Fax: (601) 460-3889, Email:
FCC Registered Amateur Radio Licenses:
19 (See the full list of FCC Registered Amateur Radio Licenses in San Juan)FAA Registered Aircraft:
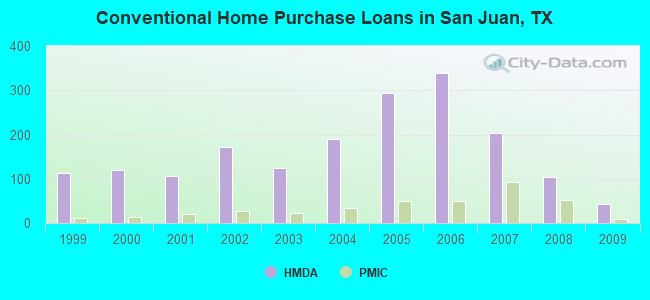
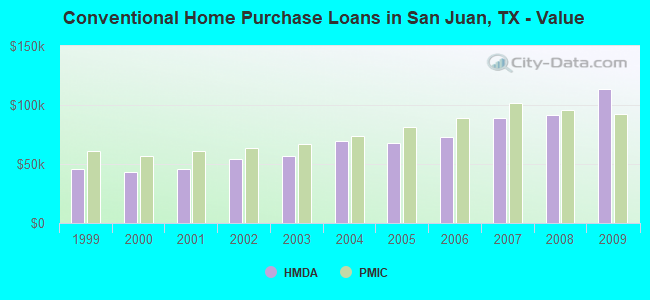
8 (See the full list of FAA Registered Aircraft in San Juan)| Home Mortgage Disclosure Act Aggregated Statistics For Year 2009 (Based on 1 full and 2 partial tracts) | ||||||||||||||
| A) FHA, FSA/RHS & VA Home Purchase Loans | B) Conventional Home Purchase Loans | C) Refinancings | D) Home Improvement Loans | E) Loans on Dwellings For 5+ Families | F) Non-occupant Loans on < 5 Family Dwellings (A B C & D) | G) Loans On Manufactured Home Dwelling (A B C & D) | ||||||||
|---|---|---|---|---|---|---|---|---|---|---|---|---|---|---|
| Number | Average Value | Number | Average Value | Number | Average Value | Number | Average Value | Number | Average Value | Number | Average Value | Number | Average Value | |
| LOANS ORIGINATED | 89 | $92,901 | 44 | $113,556 | 73 | $100,139 | 19 | $33,592 | 1 | $304,000 | 7 | $120,916 | 2 | $32,420 |
| APPLICATIONS APPROVED, NOT ACCEPTED | 6 | $86,520 | 10 | $103,100 | 35 | $79,890 | 6 | $52,740 | 0 | $0 | 3 | $67,370 | 2 | $24,000 |
| APPLICATIONS DENIED | 21 | $86,149 | 29 | $65,726 | 155 | $74,774 | 69 | $29,049 | 0 | $0 | 13 | $58,318 | 9 | $35,179 |
| APPLICATIONS WITHDRAWN | 7 | $93,534 | 5 | $46,928 | 26 | $84,144 | 6 | $40,575 | 0 | $0 | 5 | $35,316 | 0 | $0 |
| FILES CLOSED FOR INCOMPLETENESS | 5 | $98,242 | 1 | $80,420 | 24 | $91,868 | 6 | $49,963 | 0 | $0 | 0 | $0 | 0 | $0 |
Detailed HMDA statistics for the following Tracts: 0218.01 , 0218.02, 0220.01
| Private Mortgage Insurance Companies Aggregated Statistics For Year 2009 (Based on 1 full and 2 partial tracts) | ||||||
| A) Conventional Home Purchase Loans | B) Refinancings | C) Non-occupant Loans on < 5 Family Dwellings (A & B) | ||||
|---|---|---|---|---|---|---|
| Number | Average Value | Number | Average Value | Number | Average Value | |
| LOANS ORIGINATED | 10 | $92,607 | 4 | $166,770 | 0 | $0 |
| APPLICATIONS APPROVED, NOT ACCEPTED | 4 | $62,885 | 4 | $181,485 | 1 | $66,000 |
| APPLICATIONS DENIED | 4 | $74,205 | 1 | $266,000 | 0 | $0 |
| APPLICATIONS WITHDRAWN | 0 | $0 | 2 | $190,520 | 0 | $0 |
| FILES CLOSED FOR INCOMPLETENESS | 2 | $163,500 | 0 | $0 | 1 | $66,000 |
Detailed PMIC statistics for the following Tracts: 0218.01 , 0218.02, 0220.01
2002 - 2018 National Fire Incident Reporting System (NFIRS) incidents
- Fire incident types reported to NFIRS in San Juan, TX
- 99658.2%Outside Fires
- 30818.0%Structure Fires
- 30217.7%Mobile Property/Vehicle Fires
- 1046.1%Other
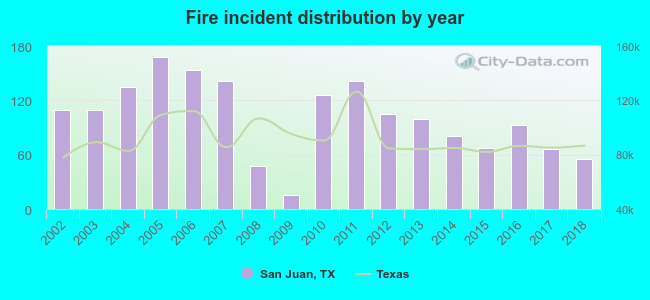 According to the data from the years 2002 - 2018 the average number of fire incidents per year is 101. The highest number of reported fire incidents - 168 took place in 2005, and the least - 15 in 2009. The data has a decreasing trend.
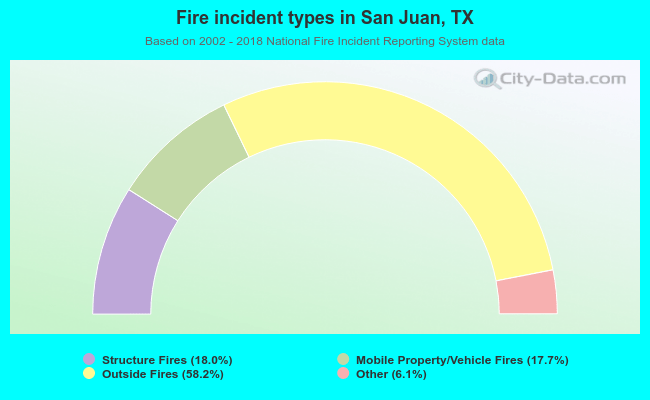 When looking into fire subcategories, the most incidents belonged to: Outside Fires (58.2%), and Structure Fires (18.0%).
| Most common first names in San Juan, TX among deceased individuals | ||
| Name | Count | Lived (average) |
|---|---|---|
| Maria | 130 | 74.7 years |
| Jose | 78 | 71.0 years |
| Guadalupe | 52 | 76.0 years |
| Manuel | 39 | 76.6 years |
| Juan | 38 | 69.5 years |
| Francisco | 29 | 71.6 years |
| Jesus | 26 | 74.1 years |
| Santos | 21 | 74.5 years |
| Robert | 21 | 73.3 years |
| Pedro | 21 | 73.6 years |
| Most common last names in San Juan, TX among deceased individuals | ||
| Last name | Count | Lived (average) |
|---|---|---|
| Garcia | 80 | 74.4 years |
| Martinez | 75 | 72.3 years |
| Garza | 69 | 76.0 years |
| Gonzalez | 60 | 70.6 years |
| Rodriguez | 59 | 73.6 years |
| Cantu | 57 | 76.1 years |
| Flores | 51 | 71.2 years |
| Lopez | 43 | 73.5 years |
| Hernandez | 35 | 71.7 years |
| Perez | 32 | 72.7 years |
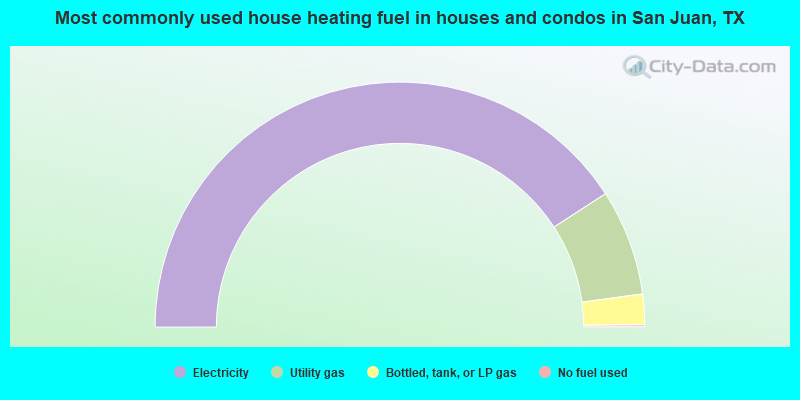
- 81.7%Electricity
- 14.0%Utility gas
- 4.0%Bottled, tank, or LP gas
- 0.3%No fuel used
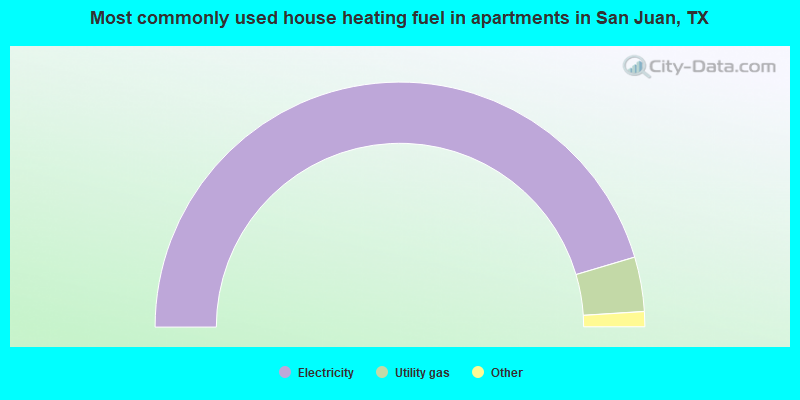
- 90.9%Electricity
- 7.2%Utility gas
- 1.0%No fuel used
- 0.9%Bottled, tank, or LP gas
San Juan compared to Texas state average:
- Median house value significantly below state average.
- Black race population percentage significantly below state average.
- Hispanic race population percentage significantly above state average.
- Foreign-born population percentage above state average.
- Renting percentage below state average.
- Length of stay since moving in significantly above state average.
- House age below state average.
- Percentage of population with a bachelor's degree or higher below state average.
San Juan on our top lists:
- #25 on the list of "Top 100 least racially diverse cities (pop. 5,000+)"
- #34 on the list of "Top 101 cities with the lowest percentage of English-only speaking households, population 5,000+"
- #70 on the list of "Top 101 cities with the highest percentage of family households, population 10,000+"
- #93 (78589) on the list of "Top 101 zip codes with the smallest percentage of taxpayers reporting net capital gain/loss in 2012 (pop 5,000+)"
- #4 on the list of "Top 101 counties with the worst general health status score of residents (1-5), 3 years of data"
- #4 on the list of "Top 101 counties with the highest number of births per 1000 residents 2007-2013"
- #5 on the list of "Top 101 counties with the lowest percentage of residents relocating to other counties in 2011"
- #7 on the list of "Top 101 counties with the lowest percentage of residents that smoked 100+ cigarettes in their lives"
- #8 on the list of "Top 101 counties with the lowest percentage of residents that exercised in the past month"

|
Total of 2 patent applications in 2008-2024.