Estimated zip code population in 2022: 37,527 Zip code population in 2010: 63,844 Zip code population in 2000: 51,320
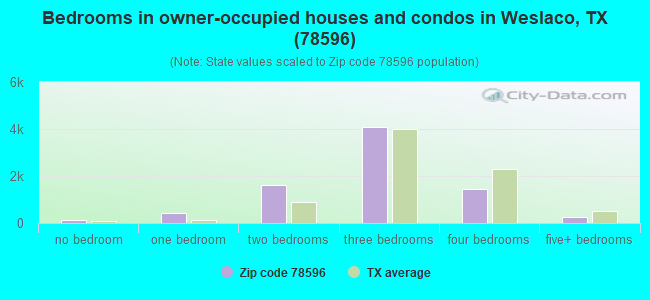
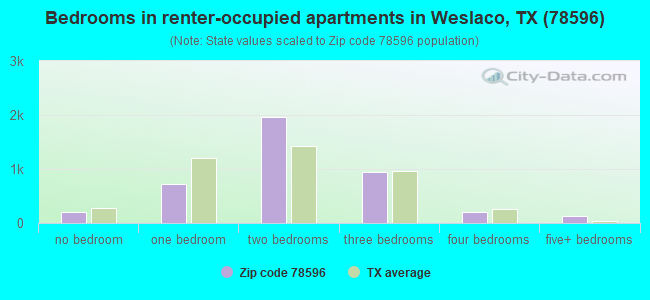
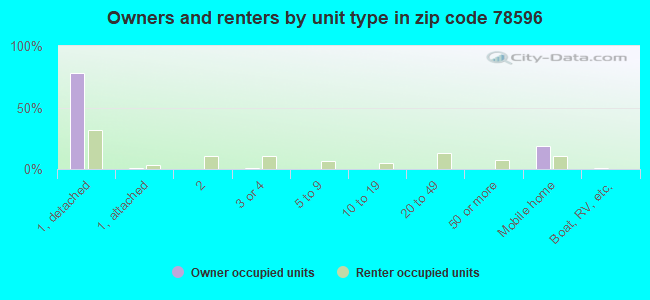
Houses and condos: 16,093 Renter-occupied apartments: 4,193
% of renters here:
35%
State:
38%
March 2022 cost of living index in zip code 78596: 80.7 (low, U.S. average is 100)
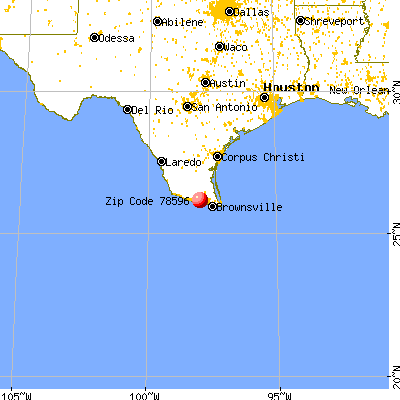
Land area: 59.4 sq. mi. Water area: 0.8 sq. mi.
Population density: 632 people per square mile
(low).
OSM Map
General Map
Google Map
MSN Map
OSM Map
General Map
Google Map
MSN Map
OSM Map
General Map
Google Map
MSN Map
OSM Map
General Map
Google Map
MSN Map
Please wait while loading the map...
Real estate property taxes paid for housing units in 2022:
This zip code:
1.6% ($1,604)
Texas:
1.5% ($4,050)
Median real estate property taxes paid for housing units with mortgages in 2022: $3,421 (1.9%) Median real estate property taxes paid for housing units with no mortgage in 2022: $1,068 (1.6%)
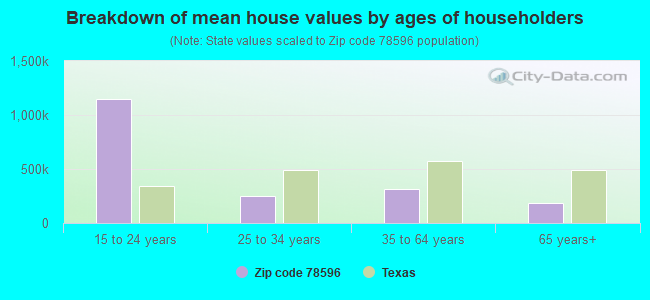
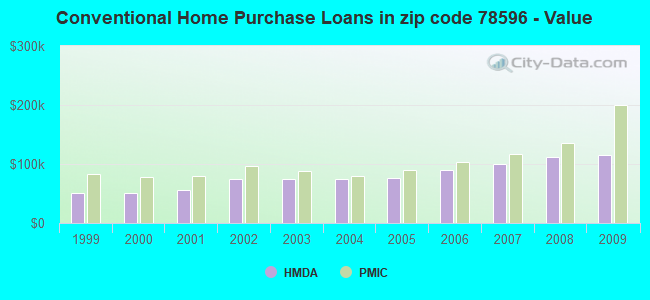
Estimated median house/condo value in 2022: $102,060
78596:
$102,060
Texas:
$275,400
According to our research of Texas and other state lists, there were 106 registered sex offenders living in 78596 zip code as of April 27, 2024. The ratio of all residents to sex offenders in zip code 78596 is 627 to 1. The ratio of registered sex offenders to all residents in this zip code is lower than the state average.
Median resident age:
This zip code:
33.2 years
Texas median age:
35.6 years
Average household size:
This zip code:
3.1 people
Texas:
2.6 people
Averages for the 2020 tax year for zip code 78596, filed in 2021:
Average Adjusted Gross Income (AGI) in 2020: $43,464 (Individual Income Tax Returns)
Here:
$43,464
State:
$77,054
Salary/wage: $38,830 (reported on 83.7% of returns)
Here:
$38,830
State:
$62,766
(% of AGI for various income ranges: 1229.8% for AGIs below $25k, 3511.8% for AGIs $25k-50k, 6286.8% for AGIs $50k-75k, 9454.3% for AGIs $75k-100k, 17004.1% for AGIs $100k-200k, 73191.7% for AGIs over 200k)
Taxable interest for individuals: $1,748 (reported on 12.1% of returns)
This zip code:
$1,748
Texas:
$2,665
(% of AGI for various income ranges: 5.2% for AGIs below $25k, 11.6% for AGIs $25k-50k, 27.5% for AGIs $50k-75k, 65.9% for AGIs $75k-100k, 131.1% for AGIs $100k-200k, 1545.0% for AGIs over 200k)
Ordinary dividends: $5,150 (reported on 5.5% of returns)
Here:
$5,150
State:
$10,044
(% of AGI for various income ranges: 5.3% for AGIs below $25k, 13.3% for AGIs $25k-50k, 28.2% for AGIs $50k-75k, 78.2% for AGIs $75k-100k, 201.6% for AGIs $100k-200k, 2378.3% for AGIs over 200k)
Net capital gain/loss in AGI: +$17,355 (reported on 5.6% of returns)
Here:
+$17,355
State:
+$39,590
(% of AGI for various income ranges: 2.4% for AGIs below $25k, 12.9% for AGIs $25k-50k, 49.1% for AGIs $50k-75k, 104.3% for AGIs $75k-100k, 480.3% for AGIs $100k-200k, 16995.0% for AGIs over 200k)
Profit/loss from business: +$3,257 (reported on 21.6% of returns)
Here:
+$3,257
State:
+$10,888
(% of AGI for various income ranges: 143.2% for AGIs below $25k, 2.1% for AGIs $25k-50k, 20.3% for AGIs $50k-75k, 209.2% for AGIs $100k-200k, 1936.7% for AGIs over 200k)
Taxable individual retirement arrangement distribution: $16,097 (reported on 3.8% of returns)
78596:
$16,097
Texas:
$24,740
(% of AGI for various income ranges: 14.8% for AGIs below $25k, 42.9% for AGIs $25k-50k, 91.9% for AGIs $50k-75k, 166.9% for AGIs $75k-100k, 432.7% for AGIs $100k-200k, 3351.7% for AGIs over 200k)
Total itemized deductions: $32,959 (reported on 3.7% of returns)
Here:
$32,959
State:
$40,428
(% of AGI for various income ranges: 11.0% for AGIs below $25k, 97.8% for AGIs $25k-50k, 287.7% for AGIs $50k-75k, 462.3% for AGIs $75k-100k, 692.7% for AGIs $100k-200k, 5371.7% for AGIs over 200k)
Charity contributions: $11,882 (reported on 2.8% of returns)
Here:
$11,882
State:
$18,201
(% of AGI for various income ranges: 17.8% for AGIs $25k-50k, 54.7% for AGIs $50k-75k, 122.5% for AGIs $75k-100k, 239.5% for AGIs $100k-200k, 2426.7% for AGIs over 200k)
Taxes paid: $6,904 (reported on 3.1% of returns)
78596:
$6,904
State:
$7,821
(% of AGI for various income ranges: 2.3% for AGIs below $25k, 15.6% for AGIs $25k-50k, 50.6% for AGIs $50k-75k, 96.7% for AGIs $75k-100k, 131.2% for AGIs $100k-200k, 781.7% for AGIs over 200k)
Earned income credit: $2,992 (reported on 36.1% of returns)
Here:
$2,992
State:
$2,584
(% of AGI for various income ranges: 208.0% for AGIs below $25k, 123.2% for AGIs $25k-50k, 2.7% for AGIs $50k-75k)
Percentage of individuals using paid preparers for their 2020 taxes: 91.7%
Here:
92%
State:
92%
(% for various income ranges: 91.3% for AGIs below $25k, 92.6% for AGIs $25k-50k, 91.3% for AGIs $50k-75k, 91.8% for AGIs $75k-100k, 91.4% for AGIs $100k-200k, 90.5% for AGIs over 200k)
Averages for the 2012 tax year for zip code 78596, filed in 2013:
Average Adjusted Gross Income (AGI) in 2012: $34,764 (Individual Income Tax Returns)
Here:
$34,764
State:
$65,384
Salary/wage: $30,794 (reported on 86.8% of returns)
Here:
$30,794
State:
$52,524
(% of AGI for various income ranges: 77.8% for AGIs below $25k, 87.9% for AGIs $25k-50k, 82.0% for AGIs $50k-75k, 83.2% for AGIs $75k-100k, 80.8% for AGIs $100k-200k, 36.3% for AGIs over 200k)
Taxable interest for individuals: $2,150 (reported on 10.4% of returns)
This zip code:
$2,150
Texas:
$2,372
(% of AGI for various income ranges: 0.3% for AGIs below $25k, 0.4% for AGIs $25k-50k, 0.7% for AGIs $50k-75k, 0.7% for AGIs $75k-100k, 0.8% for AGIs $100k-200k, 1.5% for AGIs over 200k)
Ordinary dividends: $9,593 (reported on 4.2% of returns)
Here:
$9,593
State:
$9,721
(% of AGI for various income ranges: 0.2% for AGIs below $25k, 0.3% for AGIs $25k-50k, 0.8% for AGIs $50k-75k, 0.5% for AGIs $75k-100k, 1.1% for AGIs $100k-200k, 5.7% for AGIs over 200k)
Net capital gain/loss in AGI: +$12,328 (reported on 3.7% of returns)
Here:
+$12,328
State:
+$35,319
(% of AGI for various income ranges: 0.1% for AGIs $25k-50k, 0.5% for AGIs $50k-75k, 0.5% for AGIs $75k-100k, 0.7% for AGIs $100k-200k, 8.4% for AGIs over 200k)
Profit/loss from business: +$8,611 (reported on 21.9% of returns)
Here:
+$8,611
State:
+$13,732
(% of AGI for various income ranges: 15.0% for AGIs below $25k, 1.4% for AGIs $25k-50k, 1.6% for AGIs $50k-75k, 0.8% for AGIs $75k-100k, 2.9% for AGIs $100k-200k, 7.7% for AGIs over 200k)
Taxable individual retirement arrangement distribution: $11,642 (reported on 3.6% of returns)
78596:
$11,642
Texas:
$19,511
(% of AGI for various income ranges: 0.6% for AGIs below $25k, 1.0% for AGIs $25k-50k, 1.7% for AGIs $50k-75k, 1.7% for AGIs $75k-100k, 1.7% for AGIs $100k-200k, 1.1% for AGIs over 200k)
Self-employment retirement plans: $21,700 (reported on 0.1% of returns)
78596:
$21,700
Texas:
$23,938
(% of AGI for various income ranges: 0.2% for AGIs $25k-50k)
Total itemized deductions: $21,153 (25% of AGI, reported on 16.2% of returns)
Here:
$21,153
State:
$24,724
Here:
25.5% of AGI
State:
15.9% of AGI
(% of AGI for various income ranges: 2.9% for AGIs below $25k, 10.6% for AGIs $25k-50k, 15.2% for AGIs $50k-75k, 14.3% for AGIs $75k-100k, 12.0% for AGIs $100k-200k, 7.8% for AGIs over 200k)
Charity contributions: $4,035 (reported on 11.0% of returns)
Here:
$4,035
State:
$6,808
(% of AGI for various income ranges: 0.2% for AGIs below $25k, 0.8% for AGIs $25k-50k, 1.5% for AGIs $50k-75k, 1.6% for AGIs $75k-100k, 2.1% for AGIs $100k-200k, 2.6% for AGIs over 200k)
Taxes paid: $4,244 (reported on 15.2% of returns)
78596:
$4,244
State:
$6,921
(% of AGI for various income ranges: 0.4% for AGIs below $25k, 1.6% for AGIs $25k-50k, 2.6% for AGIs $50k-75k, 2.9% for AGIs $75k-100k, 3.0% for AGIs $100k-200k, 1.6% for AGIs over 200k)
Earned income credit: $3,156 (reported on 48.1% of returns)
Here:
$3,156
State:
$2,570
(% of AGI for various income ranges: 16.3% for AGIs below $25k, 2.8% for AGIs $25k-50k)
Percentage of individuals using paid preparers for their 2012 taxes: 60.0%
Here:
60%
State:
51%
(% for various income ranges: 60.4% for AGIs below $25k, 58.4% for AGIs $25k-50k, 59.2% for AGIs $50k-75k, 61.2% for AGIs $75k-100k, 58.0% for AGIs $100k-200k, 88.9% for AGIs over 200k)
Averages for the 2004 tax year for zip code 78596, filed in 2005:
Average Adjusted Gross Income (AGI) in 2004: $26,196 (Individual Income Tax Returns)
Here:
$26,196
State:
$47,881
Salary/wage: $23,958 (reported on 86.1% of returns)
Here:
$23,958
State:
$41,947
(% of AGI for various income ranges: 105.2% for AGIs below $10k, 82.2% for AGIs $10k-25k, 86.4% for AGIs $25k-50k, 82.3% for AGIs $50k-75k, 80.0% for AGIs $75k-100k, 55.7% for AGIs over 100k)
Taxable interest for individuals: $2,177 (reported on 16.8% of returns)
This zip code:
$2,177
Texas:
$2,255
(% of AGI for various income ranges: 2.0% for AGIs below $10k, 0.9% for AGIs $10k-25k, 1.0% for AGIs $25k-50k, 1.4% for AGIs $50k-75k, 1.7% for AGIs $75k-100k, 2.2% for AGIs over 100k)
Taxable dividends: $3,084 (reported on 6.3% of returns)
Here:
$3,084
State:
$4,261
(% of AGI for various income ranges: 0.6% for AGIs below $10k, 0.4% for AGIs $10k-25k, 0.5% for AGIs $25k-50k, 1.0% for AGIs $50k-75k, 0.7% for AGIs $75k-100k, 1.4% for AGIs over 100k)
Net capital gain/loss: +$8,444 (reported on 5.3% of returns)
Here:
+$8,444
State:
+$16,110
(% of AGI for various income ranges: -0.4% for AGIs below $10k, 0.1% for AGIs $10k-25k, 0.3% for AGIs $25k-50k, 0.9% for AGIs $50k-75k, 1.2% for AGIs $75k-100k, 7.0% for AGIs over 100k)
Profit/loss from business: +$8,360 (reported on 20.0% of returns)
Here:
+$8,360
State:
+$11,013
(% of AGI for various income ranges: 24.2% for AGIs below $10k, 9.9% for AGIs $10k-25k, 1.7% for AGIs $25k-50k, 1.7% for AGIs $50k-75k, 2.8% for AGIs $75k-100k, 9.2% for AGIs over 100k)
IRA payment deduction: $3,152 (reported on 0.8% of returns)
78596:
$3,152
Texas:
$3,120
(% of AGI for various income ranges: 0.0% for AGIs $10k-25k, 0.1% for AGIs $25k-50k, 0.1% for AGIs $50k-75k, 0.2% for AGIs $75k-100k, 0.2% for AGIs over 100k)
Self-employed pension: $26,762 (reported on 0.1% of returns)
Here:
$26,762
Texas:
$16,401
Total itemized deductions: $17,521 (26% of AGI, reported on 11.5% of returns)
Here:
$17,521
State:
$19,631
Here:
25.5% of AGI
State:
18.9% of AGI
(% of AGI for various income ranges: 2.0% for AGIs below $10k, 3.2% for AGIs $10k-25k, 9.0% for AGIs $25k-50k, 11.6% for AGIs $50k-75k, 11.2% for AGIs $75k-100k, 8.4% for AGIs over 100k)
Charity contributions deductions: $3,531 (5% of AGI, reported on 9.0% of returns)
Here:
$3,531
State:
$4,753
Here:
4.7% of AGI
State:
4.2% of AGI
(% of AGI for various income ranges: 0.2% for AGIs below $10k, 0.3% for AGIs $10k-25k, 0.9% for AGIs $25k-50k, 1.6% for AGIs $50k-75k, 1.8% for AGIs $75k-100k, 2.4% for AGIs over 100k)
Total tax: $4,175 (reported on 52.1% of returns)
78596:
$4,175
State:
$9,058
(% of AGI for various income ranges: 4.8% for AGIs below $10k, 2.7% for AGIs $10k-25k, 4.7% for AGIs $25k-50k, 7.8% for AGIs $50k-75k, 10.4% for AGIs $75k-100k, 20.4% for AGIs over 100k)
Earned income credit: $2,554 (reported on 52.5% of returns)
Here:
$2,554
State:
$2,024
Percentage of individuals using paid preparers for their 2004 taxes: 70.0%
Here:
70%
State:
57%
(% for various income ranges: 68.8% for AGIs below $10k, 75.1% for AGIs $10k-25k, 65.1% for AGIs $25k-50k, 58.1% for AGIs $50k-75k, 59.3% for AGIs $75k-100k, 73.3% for AGIs over 100k)
Household received Food Stamps/SNAP in the past 12 months: 3,569 Household did not receive Food Stamps/SNAP in the past 12 months: 8,683
Women who had a birth in the past 12 months: 467 (295 now married, 170 unmarried) Women who did not have a birth in the past 12 months: 8,484 (3,568 now married, 4,920 unmarried)
Housing units in zip code 78596 with a mortgage: 2,779 (117 second mortgage, 120 both second mortgage and home equity loan) Houses without a mortgage: 3
Median monthly owner costs for units with a mortgage: $1,432 Median monthly owner costs for units without a mortgage: $462
Residents with income below the poverty level in 2022:
This zip code:
21.6%
Whole state:
14.0%
Residents with income below 50% of the poverty level in 2022:
This zip code:
13.6%
Whole state:
7.4%
Median number of rooms in houses and condos:
Here:
5.3
State:
6.3
Median number of rooms in apartments:
Here:
4.2
State:
4.0
Notable locations in this zip code not listed on our city pages
Notable locations in zip code 78596: South Texas Factory Stores (A), Weslaco Fire Department Station 2 (B), Weslaco Fire Department and Emergency Medical Services (C), Weslaco Fire Department Station 3 (D), Weslaco Police Department (E), Weslaco Public Library (F), Weslaco Bicultural Museum (G), South Star Ambulance Service (H), Rio Valley Emergency Medical Service (I), Saint Marys Ambulance Service (J), Absolute Emergency Medical Services (K), Mobile Emergency Medical Service (L), Progreso Pump (M). Display/hide their locations on the map
Churches in zip code 78596 include: Weslaco Assembly of God Church (A), First Spanish Assembly of God Church (B), La Santisima Trinidad Methodist Church (C), Abiding Savior Lutheran Church (D), Grace Episcopal Church (E), Church of the Nazarene (F), Church of Christ (G), Saint Martin de Porres Catholic Church (H), Mount Sinai Baptist Church (I). Display/hide their locations on the map
Parks in zip code 78596 include: Las Palomas Wildlife Management Area - Taormina Unit (1), Las Palomas Wildlife Management Area - MacWhorter Unit (2), Harlon Block Park (3), Las Palomas Wildlife Management Area - Adams Unit (4), Las Palomas Wildlife Management Area - Champion Unit (5), Las Palomas Wildlife Management Area - Chapote Unit (6), Harlon Block Park (7), Weslaco City Park (8), Barbee Field (9). Display/hide their locations on the map
6,885 married couples with children.
1,973 single-parent households (282 men, 1,691 women).
26.6% of residents of 78596 zip code speak English at home.
72.7% of residents speak Spanish at home (64% very well, 19% well, 7% not well, 9% not at all).
0.3% of residents speak other Indo-European language at home (96% very well, 4% not well).
0.1% of residents speak Asian or Pacific Island language at home (100% very well).
0.2% of residents speak other language at home (100% very well).
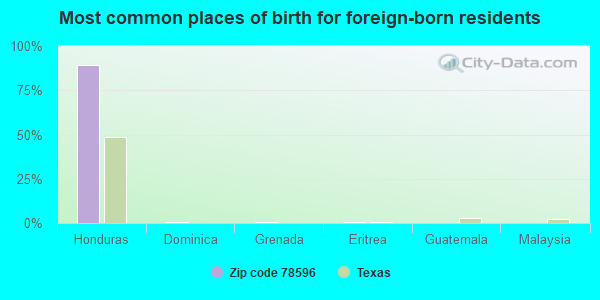
Foreign born population: 6,683 (17.8%) (37.2% of them are naturalized citizens)
This zip code:
17.8%
Whole state:
17.2%
89%Honduras
1%Dominica
0%Grenada
0%Eritrea
0%Guatemala
0%Malaysia
0%France
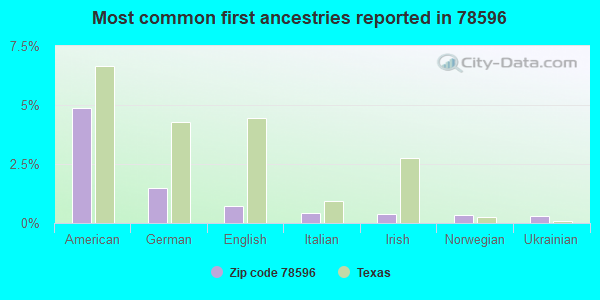
5%American
1%German
1%English
0%Italian
0%Irish
0%Norwegian
0%Ukrainian
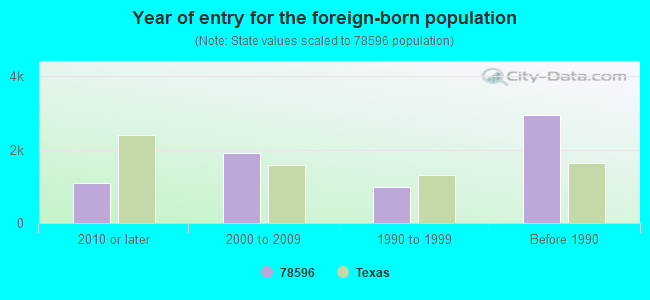
Year of entry for the foreign-born population
1,1032010 or later
1,8992000 to 2009
9751990 to 1999
2,942Before 1990
Facilities with environmental interests located in this zip code:
A N RICO EL (2202 N INTERNATIONAL BLVD in WESLACO, TX)
(National Center for Education Statistics) - STATE ID-108913113 Organizations: WESLACO ISD (SCHOOL DISTRICT)
AIRPORT EL (410 N AIRPORT DR in WESLACO, TX)
(National Center for Education Statistics) - STATE ID-108913110 Organizations: WESLACO ISD (SCHOOL DISTRICT)
ARMANDO CUELLAR MIDDLE (1201 S BRIDGE ST in WESLACO, TX)
(National Center for Education Statistics) - STATE ID-108913042 Organizations: WESLACO ISD (SCHOOL DISTRICT)
ACUNA'S AUTO SALVAGE (PO BOX 1765 in WESLACO, TX)
(Integrated Compliance Information System) - ICIS-06-2000-0066, FORMAL ENFORCEMENT ACTION, Business SIC classification: MOTOR VEHICLE PARTS, USED
Housing units lacking complete plumbing facilities: 11.2% Housing units lacking complete kitchen facilities: 3.3%
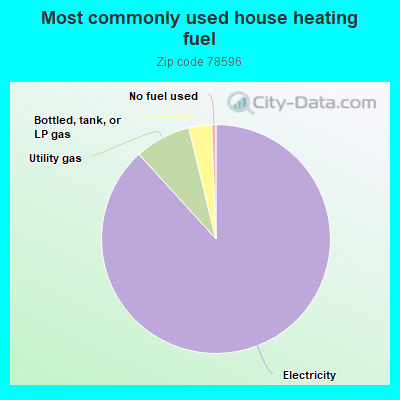
88.0%Electricity
7.9%Utility gas
3.2%Bottled, tank, or LP gas
0.6%No fuel used
Population in 1990: 40,652. Population change in the 1990s: +10,668 (+26.2%).
Place of birth for U.S.-born residents:
This state: 25,578
Northeast: 223
Midwest: 2,118
South: 801
West: 1,379
70% of the 78596 zip code residents lived in the same house 5 years ago. Out of people who lived in different houses, 76% lived in this county. Out of people who lived in different counties, 50% lived in Texas.
90% of the 78596 zip code residents lived in the same house 1 year ago. Out of people who lived in different houses, 49% moved from this county. Out of people who lived in different houses, 20% moved from different county within same state. Out of people who lived in different houses, 23% moved from different state. Out of people who lived in different houses, 10% moved from abroad.
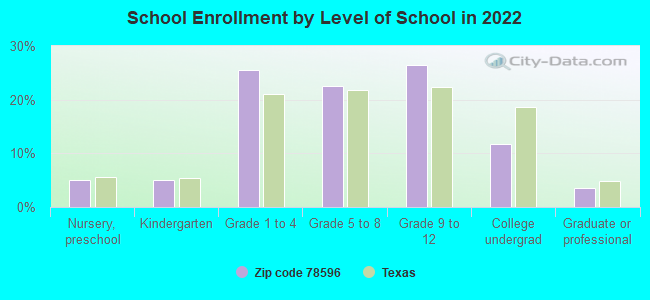
Private vs. public school enrollment:
Students in private schools in grades 1 to 8 (elementary and middle school): 122
Here:
2.3%
Texas:
8.8%
Students in private schools in grades 9 to 12 (high school): 45
Here:
1.5%
Texas:
8.0%
Students in private undergraduate colleges: 520
Here:
39.1%
Texas:
16.2%
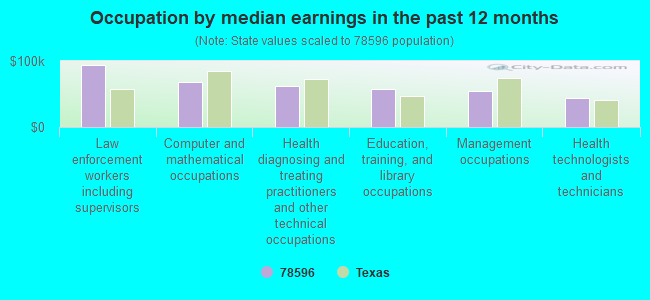
Occupation by median earnings in the past 12 months ($)
93,696Law enforcement workers including supervisors
68,196Computer and mathematical occupations
62,258Health diagnosing and treating practitioners and other technical occupations
56,853Education, training, and library occupations
54,223Management occupations
43,491Health technologists and technicians
Companies with federal contracts located in this zip code (WESLACO, TX):
PENA'S JANITORIAL & LAWN MAINT (6518 N FM 88; small business) : $94,796 in 26 contractsfrom 2003 to 2006
Contracts for Landscaping/Groundskeeping Services, Custodial Janitorial Services by Army Signed by year:2000: $0; 2001: $0; 2002: $0; 2003: $29,075; 2004: $34,401; 2005: $23,036; 2006: $8,284.
Biggest contracts:
$8,941 with Army for Landscaping/Groundskeeping Services. Signed on 2004-11-01. Completion date: 2005-10-31.
$8,941, same as above.Signed on 2003-11-07. Completion date: 2004-10-31.
$7,600, same as above.Signed on 2005-06-20. Completion date: 2006-07-31.
$7,600, same as above.Signed on 2004-06-15. Completion date: 2005-07-31.
LUBYS, INC (2001 EXPRESSWAY 83 WEST) : $93,072 in 2 contractsfrom 2000 to 2003
$47,112 with Army for Food Services. Signed on 2003-07-16. Completion date: 2003-08-02.
$45,960 with Navy for Food Services. Signed on 2000-07-13. Completion date: 2000-08-05.
MARGARET VARGASON (SIESTA VLG 213; small business) : $46,305 in 7 contractsfrom 2002 to 2006
Contracts for Custodial Janitorial Services by Army, U.S. Army Corps of Engineers - civil program financing only Signed by year:2000: $0; 2001: $0; 2002: $6,089; 2003: $6,089; 2004: $12,276; 2005: $14,606; 2006: $7,245.
Biggest contracts:
$7,303 with Army for Custodial Janitorial Services. Taking place in IA. Signed on 2005-02-08. Completion date: 2006-03-31.
$7,303 with U.S. Army Corps of Engineers - civil program financing only for Custodial Janitorial Services. Taking place in IA. Signed on 2005-02-08. Completion date: 2006-03-31.
$7,245 with Army for Custodial Janitorial Services. Taking place in IA. Signed on 2006-01-20. Completion date: 2006-03-31.
$6,138, same as above.Signed on 2004-01-30. Completion date: 2003-03-31.
CATERING UNLIMITED INC (415 S INTERNATIONAL BLVD; small business) : $22,385 in 3 contractsfrom 2002 to 2005
$14,726 with Army for Composite Food Packages. Signed on 2004-12-08. Completion date: 2004-12-12.
$4,179 with Army for Special Dietary Foods and Food Specialty Preparations. Signed on 2002-10-31. Completion date: 2002-10-05.
$3,480 with Army for Condiments and Related Products. Signed on 2005-02-03. Completion date: 2005-02-06.
GENE COLLINS (715 N WESTGATE DR 165; small business) : $0 in 2 contractsfrom 2001 to 2002
$6,400 with U.S. Army Corps of Engineers - civil program financing only for Custodial Janitorial Services. Taking place in IA. Signed on 2001-12-13. Completion date: 2002-09-30.
-$6,400, same as above.Signed on 2002-03-25. Completion date: 2002-09-30.
Top industries in this zip code by the number of employees in 2005:
Health Care and Social Assistance: Home Health Care Services (500-999 employees: 1 establishment, 250-499 employees: 1 establishment, 100-249 employees: 2 establishments, 50-99 employees: 1 establishment, 20-49 employees: 1 establishment, 10-19 employees: 1 establishment, 5-9 employees: 2 establishments, 1-4 employees: 5 establishments)
Health Care and Social Assistance: Services for the Elderly and Persons with Disabilities (500-999: 1, 100-249: 1, 50-99: 1, 20-49: 1, 10-19: 4, 5-9: 2)
Health Care and Social Assistance: General Medical and Surgical Hospitals (500-999: 1)
2002 - 2018 National Fire Incident Reporting System (NFIRS) incidents
Based on the data from the years 2002 - 2018 the average number of fire incidents per year is 180. The highest number of reported fires - 359 took place in 2008, and the least - 16 in 2018. The data has a declining trend.
When looking into fire subcategories, the most reports belonged to: Outside Fires (64.4%), and Mobile Property/Vehicle Fires (15.7%).
Fire incident types reported to NFIRS in Zip Code 78596


 Nearest zip codes: 78537, 78570, 78579, 78516, 78543, 78558.


 Based on the data from the years 2002 - 2018 the average number of fire incidents per year is 180. The highest number of reported fires - 359 took place in 2008, and the least - 16 in 2018. The data has a declining trend.
 When looking into fire subcategories, the most reports belonged to: Outside Fires (64.4%), and Mobile Property/Vehicle Fires (15.7%).