Estimated zip code population in 2022: 35,985 Zip code population in 2010: 32,525 Zip code population in 2000: 29,339
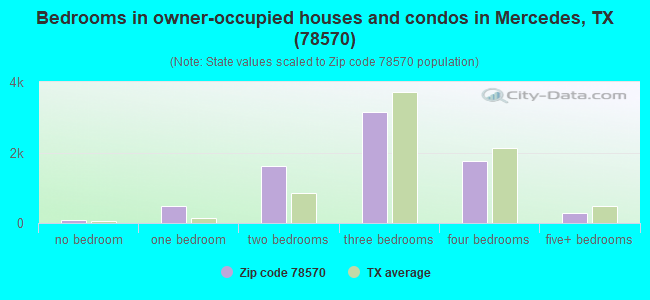
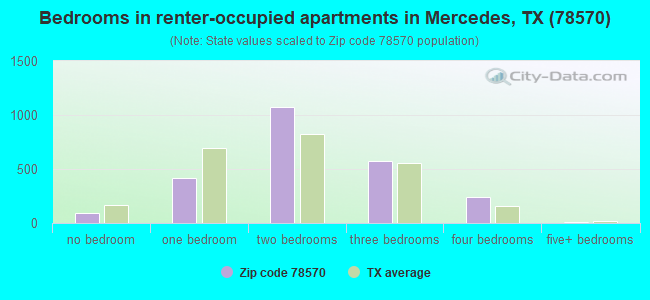
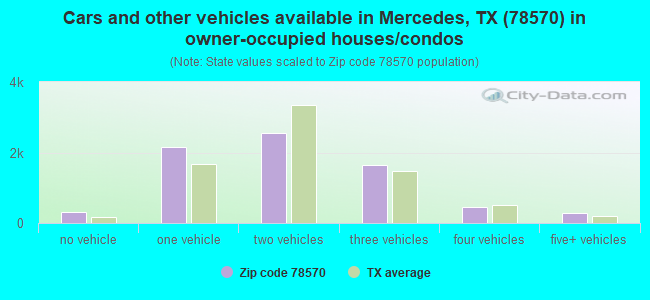
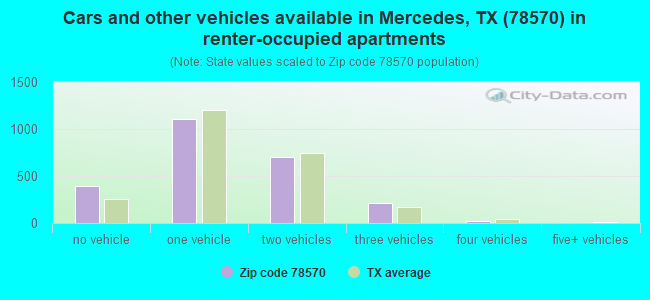
Houses and condos: 11,451 Renter-occupied apartments: 2,421
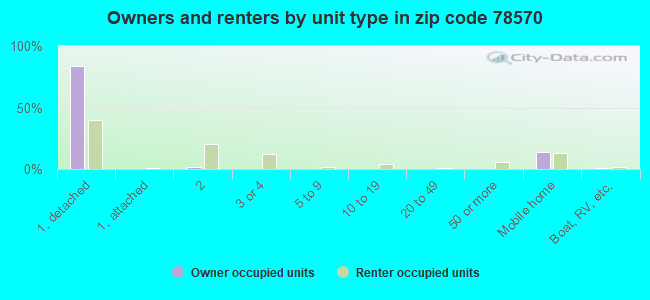
% of renters here:
25%
State:
38%
March 2022 cost of living index in zip code 78570: 80.5 (low, U.S. average is 100)
Land area: 74.6 sq. mi. Water area: 0.9 sq. mi.
Population density: 482 people per square mile
(low).
OSM Map
General Map
Google Map
MSN Map
OSM Map
General Map
Google Map
MSN Map
OSM Map
General Map
Google Map
MSN Map
OSM Map
General Map
Google Map
MSN Map
Please wait while loading the map...
Real estate property taxes paid for housing units in 2022:
This zip code:
1.5% ($1,458)
Texas:
1.5% ($4,050)
Median real estate property taxes paid for housing units with mortgages in 2022: $2,266 (1.7%) Median real estate property taxes paid for housing units with no mortgage in 2022: $1,228 (1.5%)
Business Search- 14 Million verified businesses
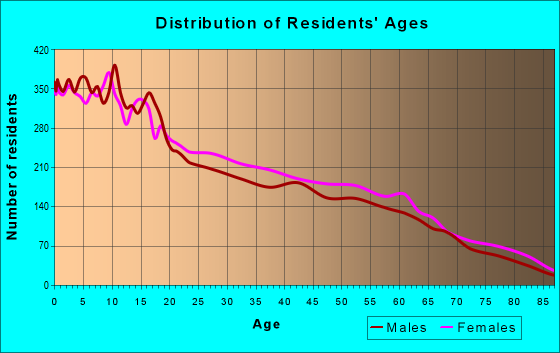
Males: 17,429
(48.4%)
Females: 18,555
(51.6%)
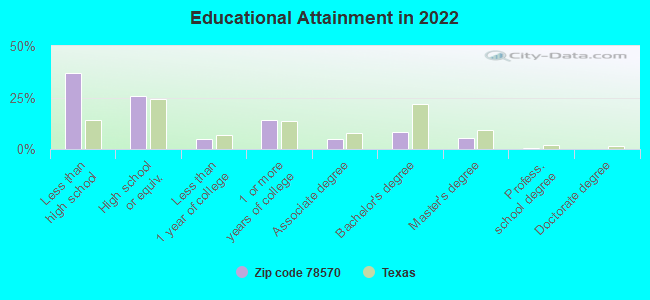
For population 25 years and over in 78570:
High school or higher: 60.8%
Bachelor's degree or higher: 13.1%
Graduate or professional degree: 5.2%
Unemployed: 9.8%
Mean travel time to work (commute): 23.6 minutes
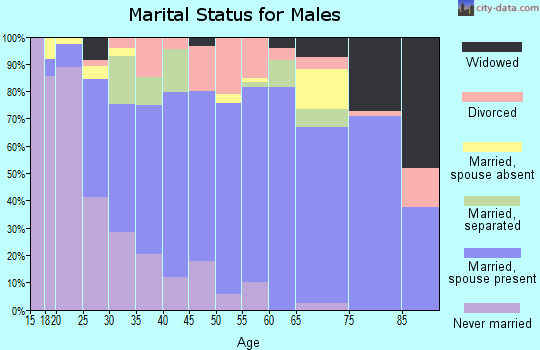
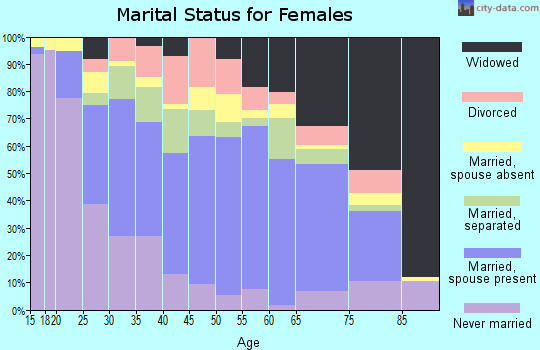
For population 15 years and over in 78570:
Never married: 38.4%
Now married: 47.6%
Separated: 3.9%
Widowed: 4.8%
Divorced: 5.3%
Zip code 78570 compared to state average:
Median household income below state average.
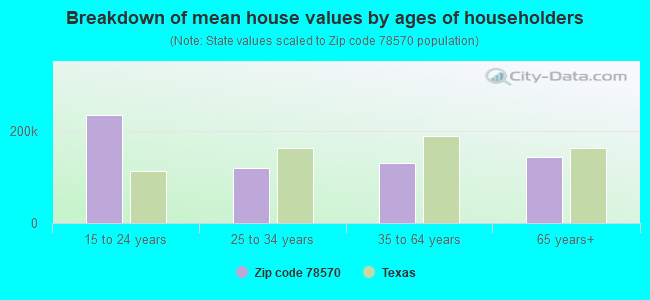
Median house value significantly below state average.
Unemployed percentage above state average.
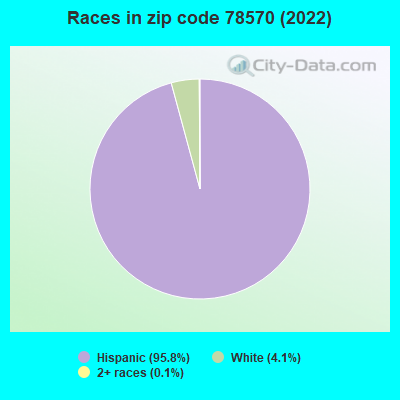
Black race population percentage significantly below state average.
Hispanic race population percentage above state average.
Median age below state average.
Renting percentage below state average.
Length of stay since moving in significantly above state average.
Percentage of population with a bachelor's degree or higher significantly below state average.
Estimated median house/condo value in 2022: $96,621
78570:
$96,621
Texas:
$275,400
According to our research of Texas and other state lists, there were 91 registered sex offenders living in 78570 zip code as of April 27, 2024. The ratio of all residents to sex offenders in zip code 78570 is 391 to 1. The ratio of registered sex offenders to all residents in this zip code is near the state average.
Median resident age:
This zip code:
28.0 years
Texas median age:
35.6 years
Average household size:
This zip code:
3.7 people
Texas:
2.6 people
Averages for the 2020 tax year for zip code 78570, filed in 2021:
Average Adjusted Gross Income (AGI) in 2020: $31,427 (Individual Income Tax Returns)
Here:
$31,427
State:
$77,054
Salary/wage: $29,418 (reported on 85.1% of returns)
Here:
$29,418
State:
$62,766
(% of AGI for various income ranges: 1190.3% for AGIs below $25k, 3425.7% for AGIs $25k-50k, 6295.2% for AGIs $50k-75k, 8866.5% for AGIs $75k-100k, 15120.0% for AGIs $100k-200k)
Taxable interest for individuals: $886 (reported on 8.1% of returns)
This zip code:
$886
Texas:
$2,665
(% of AGI for various income ranges: 2.2% for AGIs below $25k, 6.8% for AGIs $25k-50k, 12.7% for AGIs $50k-75k, 33.2% for AGIs $75k-100k, 92.2% for AGIs $100k-200k)
Ordinary dividends: $2,397 (reported on 2.3% of returns)
Here:
$2,397
State:
$10,044
(% of AGI for various income ranges: 1.8% for AGIs below $25k, 2.9% for AGIs $25k-50k, 13.3% for AGIs $50k-75k, 21.6% for AGIs $75k-100k, 111.9% for AGIs $100k-200k)
Net capital gain/loss in AGI: +$10,168 (reported on 2.7% of returns)
Here:
+$10,168
State:
+$39,590
(% of AGI for various income ranges: 0.9% for AGIs below $25k, 5.3% for AGIs $25k-50k, 18.6% for AGIs $50k-75k, 28.9% for AGIs $75k-100k, 1190.0% for AGIs $100k-200k)
Profit/loss from business: +$4,056 (reported on 22.3% of returns)
Here:
+$4,056
State:
+$10,888
(% of AGI for various income ranges: 194.5% for AGIs below $25k, 37.6% for AGIs $75k-100k, 744.8% for AGIs $100k-200k)
Taxable individual retirement arrangement distribution: $13,838 (reported on 2.3% of returns)
78570:
$13,838
Texas:
$24,740
(% of AGI for various income ranges: 8.7% for AGIs below $25k, 25.3% for AGIs $25k-50k, 76.1% for AGIs $50k-75k, 210.5% for AGIs $75k-100k, 517.0% for AGIs $100k-200k)
Total itemized deductions: $32,758 (reported on 1.9% of returns)
Here:
$32,758
State:
$40,428
(% of AGI for various income ranges: 71.3% for AGIs $25k-50k, 227.2% for AGIs $50k-75k, 401.9% for AGIs $75k-100k, 766.3% for AGIs $100k-200k)
Charity contributions: $8,828 (reported on 1.3% of returns)
Here:
$8,828
State:
$18,201
(% of AGI for various income ranges: 8.1% for AGIs $25k-50k, 41.3% for AGIs $50k-75k, 87.0% for AGIs $75k-100k, 196.7% for AGIs $100k-200k)
Taxes paid: $7,386 (reported on 1.6% of returns)
78570:
$7,386
State:
$7,821
(% of AGI for various income ranges: 11.7% for AGIs $25k-50k, 45.0% for AGIs $50k-75k, 95.9% for AGIs $75k-100k, 137.4% for AGIs $100k-200k)
Earned income credit: $3,325 (reported on 45.4% of returns)
Here:
$3,325
State:
$2,584
(% of AGI for various income ranges: 249.1% for AGIs below $25k, 146.5% for AGIs $25k-50k, 3.5% for AGIs $50k-75k)
Percentage of individuals using paid preparers for their 2020 taxes: 90.2%
Here:
90%
State:
92%
(% for various income ranges: 89.4% for AGIs below $25k, 92.0% for AGIs $25k-50k, 89.9% for AGIs $50k-75k, 90.0% for AGIs $75k-100k, 89.7% for AGIs $100k-200k, 80.0% for AGIs over 200k)
Averages for the 2012 tax year for zip code 78570, filed in 2013:
Average Adjusted Gross Income (AGI) in 2012: $26,735 (Individual Income Tax Returns)
Here:
$26,735
State:
$65,384
Salary/wage: $24,403 (reported on 86.3% of returns)
Here:
$24,403
State:
$52,524
(% of AGI for various income ranges: 75.5% for AGIs below $25k, 88.7% for AGIs $25k-50k, 83.1% for AGIs $50k-75k, 77.6% for AGIs $75k-100k, 74.4% for AGIs $100k-200k, 30.5% for AGIs over 200k)
Taxable interest for individuals: $1,200 (reported on 8.3% of returns)
This zip code:
$1,200
Texas:
$2,372
(% of AGI for various income ranges: 0.2% for AGIs below $25k, 0.3% for AGIs $25k-50k, 0.3% for AGIs $50k-75k, 0.5% for AGIs $75k-100k, 0.5% for AGIs $100k-200k, 2.6% for AGIs over 200k)
Ordinary dividends: $3,246 (reported on 2.5% of returns)
Here:
$3,246
State:
$9,721
(% of AGI for various income ranges: 0.2% for AGIs below $25k, 0.3% for AGIs $25k-50k, 0.4% for AGIs $50k-75k, 0.3% for AGIs $75k-100k, 0.6% for AGIs $100k-200k)
Net capital gain/loss in AGI: +$2,177 (reported on 2.3% of returns)
Here:
+$2,177
State:
+$35,319
(% of AGI for various income ranges: 0.2% for AGIs $25k-50k, 0.1% for AGIs $50k-75k, 0.4% for AGIs $75k-100k, 0.6% for AGIs $100k-200k)
Profit/loss from business: +$8,359 (reported on 23.7% of returns)
Here:
+$8,359
State:
+$13,732
(% of AGI for various income ranges: 17.6% for AGIs below $25k, 1.1% for AGIs $25k-50k, 2.2% for AGIs $50k-75k, 2.0% for AGIs $75k-100k, 6.6% for AGIs $100k-200k)
Taxable individual retirement arrangement distribution: $9,797 (reported on 2.6% of returns)
78570:
$9,797
Texas:
$19,511
(% of AGI for various income ranges: 0.6% for AGIs below $25k, 0.6% for AGIs $25k-50k, 1.2% for AGIs $50k-75k, 1.4% for AGIs $75k-100k, 2.8% for AGIs $100k-200k)
Total itemized deductions: $19,378 (28% of AGI, reported on 8.9% of returns)
Here:
$19,378
State:
$24,724
Here:
27.9% of AGI
State:
15.9% of AGI
(% of AGI for various income ranges: 1.4% for AGIs below $25k, 6.7% for AGIs $25k-50k, 11.8% for AGIs $50k-75k, 10.9% for AGIs $75k-100k, 11.3% for AGIs $100k-200k, 6.4% for AGIs over 200k)
Charity contributions: $3,568 (reported on 6.1% of returns)
Here:
$3,568
State:
$6,808
(% of AGI for various income ranges: 0.1% for AGIs below $25k, 0.5% for AGIs $25k-50k, 1.3% for AGIs $50k-75k, 1.6% for AGIs $75k-100k, 2.0% for AGIs $100k-200k, 2.4% for AGIs over 200k)
Taxes paid: $3,994 (reported on 8.4% of returns)
78570:
$3,994
State:
$6,921
(% of AGI for various income ranges: 0.3% for AGIs below $25k, 1.0% for AGIs $25k-50k, 2.1% for AGIs $50k-75k, 2.3% for AGIs $75k-100k, 2.8% for AGIs $100k-200k, 2.0% for AGIs over 200k)
Earned income credit: $3,318 (reported on 55.7% of returns)
Here:
$3,318
State:
$2,570
(% of AGI for various income ranges: 17.7% for AGIs below $25k, 3.2% for AGIs $25k-50k)
Percentage of individuals using paid preparers for their 2012 taxes: 61.4%
Here:
61%
State:
51%
(% for various income ranges: 62.0% for AGIs below $25k, 60.6% for AGIs $25k-50k, 59.7% for AGIs $50k-75k, 57.6% for AGIs $75k-100k, 58.3% for AGIs $100k-200k, 100.0% for AGIs over 200k)
Averages for the 2004 tax year for zip code 78570, filed in 2005:
Average Adjusted Gross Income (AGI) in 2004: $20,982 (Individual Income Tax Returns)
Here:
$20,982
State:
$47,881
Salary/wage: $19,556 (reported on 87.9% of returns)
Here:
$19,556
State:
$41,947
(% of AGI for various income ranges: 84.6% for AGIs below $10k, 83.5% for AGIs $10k-25k, 88.5% for AGIs $25k-50k, 83.0% for AGIs $50k-75k, 81.0% for AGIs $75k-100k, 49.5% for AGIs over 100k)
Taxable interest for individuals: $1,062 (reported on 11.5% of returns)
This zip code:
$1,062
Texas:
$2,255
(% of AGI for various income ranges: 0.8% for AGIs below $10k, 0.4% for AGIs $10k-25k, 0.6% for AGIs $25k-50k, 0.8% for AGIs $50k-75k, 0.4% for AGIs $75k-100k, 0.9% for AGIs over 100k)
Taxable dividends: $2,071 (reported on 3.3% of returns)
Here:
$2,071
State:
$4,261
(% of AGI for various income ranges: 0.4% for AGIs below $10k, 0.1% for AGIs $10k-25k, 0.3% for AGIs $25k-50k, 0.5% for AGIs $50k-75k, 0.3% for AGIs $75k-100k, 1.1% for AGIs over 100k)
Net capital gain/loss: +$5,217 (reported on 2.6% of returns)
Here:
+$5,217
State:
+$16,110
(% of AGI for various income ranges: 0.3% for AGIs below $10k, 0.1% for AGIs $10k-25k, 0.1% for AGIs $25k-50k, 1.4% for AGIs $50k-75k, 1.1% for AGIs $75k-100k, 3.7% for AGIs over 100k)
Profit/loss from business: +$7,181 (reported on 19.9% of returns)
Here:
+$7,181
State:
+$11,013
(% of AGI for various income ranges: 22.8% for AGIs below $10k, 10.4% for AGIs $10k-25k, 2.0% for AGIs $25k-50k, 1.8% for AGIs $50k-75k, 0.7% for AGIs $75k-100k, 7.7% for AGIs over 100k)
IRA payment deduction: $2,766 (reported on 0.7% of returns)
78570:
$2,766
Texas:
$3,120
(% of AGI for various income ranges: 0.0% for AGIs $10k-25k, 0.1% for AGIs $25k-50k, 0.2% for AGIs $50k-75k, 0.3% for AGIs over 100k)
Total itemized deductions: $16,194 (29% of AGI, reported on 5.9% of returns)
Here:
$16,194
State:
$19,631
Here:
29.1% of AGI
State:
18.9% of AGI
(% of AGI for various income ranges: 1.6% for AGIs $10k-25k, 6.1% for AGIs $25k-50k, 7.8% for AGIs $50k-75k, 8.2% for AGIs $75k-100k, 7.2% for AGIs over 100k)
Charity contributions deductions: $2,956 (5% of AGI, reported on 4.5% of returns)
Here:
$2,956
State:
$4,753
Here:
4.9% of AGI
State:
4.2% of AGI
(% of AGI for various income ranges: 0.1% for AGIs $10k-25k, 0.7% for AGIs $25k-50k, 1.1% for AGIs $50k-75k, 1.4% for AGIs $75k-100k, 1.7% for AGIs over 100k)
Total tax: $2,639 (reported on 48.4% of returns)
78570:
$2,639
State:
$9,058
(% of AGI for various income ranges: 4.0% for AGIs below $10k, 2.7% for AGIs $10k-25k, 4.6% for AGIs $25k-50k, 8.0% for AGIs $50k-75k, 10.3% for AGIs $75k-100k, 20.4% for AGIs over 100k)
Earned income credit: $2,579 (reported on 59.5% of returns)
Here:
$2,579
State:
$2,024
Percentage of individuals using paid preparers for their 2004 taxes: 68.6%
Here:
69%
State:
57%
(% for various income ranges: 66.3% for AGIs below $10k, 74.0% for AGIs $10k-25k, 63.9% for AGIs $25k-50k, 52.9% for AGIs $50k-75k, 52.5% for AGIs $75k-100k, 68.6% for AGIs over 100k)
Likely homosexual households (counted as self-reported same-sex unmarried-partner households)
Lesbian couples: 0.1% of all households
Gay men: 0.0% of all households
Household received Food Stamps/SNAP in the past 12 months: 3,887 Household did not receive Food Stamps/SNAP in the past 12 months: 6,037
Women who had a birth in the past 12 months: 569 (263 now married, 298 unmarried) Women who did not have a birth in the past 12 months: 8,455 (3,635 now married, 4,822 unmarried)
Housing units in zip code 78570 with a mortgage: 2,276 (40 second mortgage, 43 both second mortgage and home equity loan) Houses without a mortgage: 409
Median monthly owner costs for units with a mortgage: $1,174 Median monthly owner costs for units without a mortgage: $426
Residents with income below the poverty level in 2022:
This zip code:
34.7%
Whole state:
14.0%
Residents with income below 50% of the poverty level in 2022:
This zip code:
17.7%
Whole state:
7.4%
Median number of rooms in houses and condos:
Here:
5.4
State:
6.3
Median number of rooms in apartments:
Here:
4.0
State:
4.0
Notable locations in this zip code not listed on our city pages
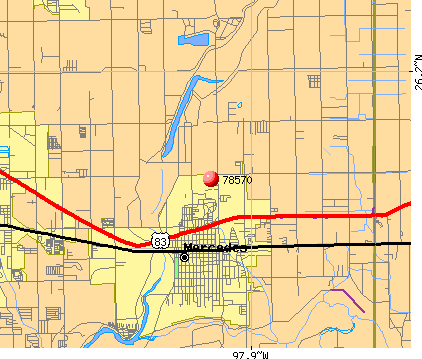
Notable locations in zip code 78570: Llano Grande Country Club (A), Mercedes Fireman Quarters (B), Mercedes Fire Department (C), Mercedes Police Department (D), Mercedes Memorial Library (E), Mercedes Pump (F). Display/hide their locations on the map
Churches in zip code 78570 include: First Baptist Church (A), First Mexican Baptist Church (B), Sunglo Fellowship Church (C), Mercedes Seventh Day Adventist Spanish Church (D). Display/hide their locations on the map
Cemeteries: Anacuitas Cemetery (1), Campacuas Cemetery (2), Cementerio Bautista (3), Our Lady of Mercy Cemetery (4), Ebony Grove Cemetery (5), Emmanuel Cemetery (6), San Jose Ranch Cemetery (7). Display/hide their locations on the map
Lakes and reservoirs: Campacuas Lake (A), Mercedes District Settling Basin (B), Hoblitz Elles Reservoir (C), Mercedes Settling Basin (D). Display/hide their locations on the map
In group quarters: 13 (-1 institutionalized population)
Size of family households: 2,016 2-persons, 1,249 3-persons, 1,821 4-persons, 1,205 5-persons, 543 6-persons, 878 7-or-more-persons
Size of nonfamily households: 1,777 1-person, 167 2-persons, 45 3-persons
5,689 married couples with children.
3,325 single-parent households (530 men, 2,795 women).
15.1% of residents of 78570 zip code speak English at home.
84.5% of residents speak Spanish at home (62% very well, 18% well, 8% not well, 11% not at all).
0.2% of residents speak other Indo-European language at home (100% very well).
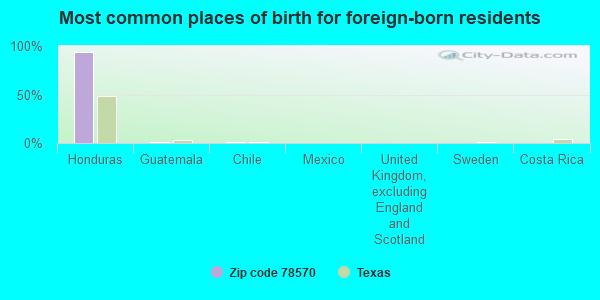
Foreign born population: 7,038 (19.6%) (22.9% of them are naturalized citizens)
This zip code:
19.6%
Whole state:
17.2%
93%Honduras
1%Guatemala
1%Chile
0%Mexico
0%United Kingdom, excluding England and Scotland
0%Sweden
0%Costa Rica
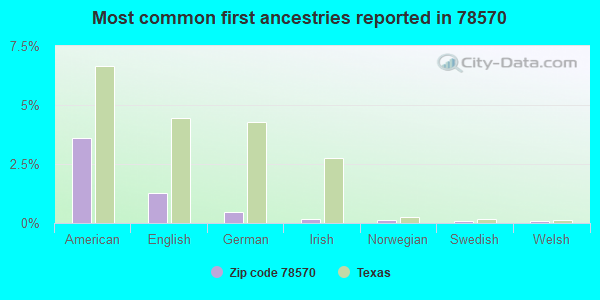
4%American
1%English
0%German
0%Irish
0%Norwegian
0%Swedish
0%Welsh
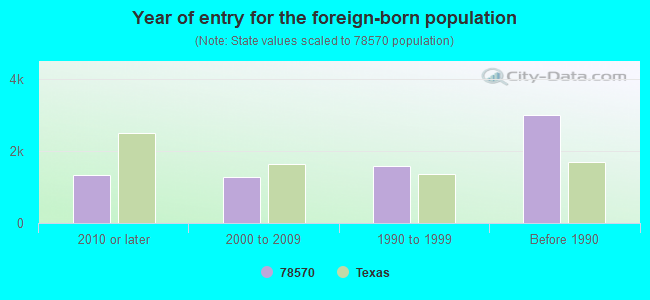
Year of entry for the foreign-born population
1,3412010 or later
1,2702000 to 2009
1,5911990 to 1999
3,007Before 1990
Housing units lacking complete plumbing facilities: 7.9% Housing units lacking complete kitchen facilities: 4.2%
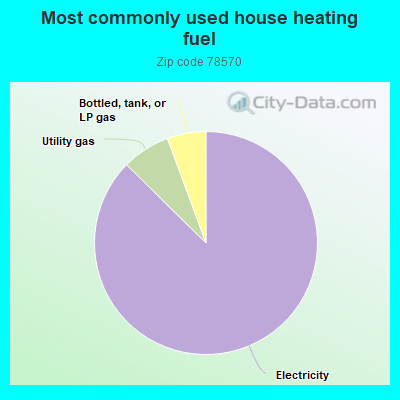
87.3%Electricity
7.0%Utility gas
5.6%Bottled, tank, or LP gas
Population in 1990: 21,450. Population change in the 1990s: +7,889 (+36.8%).
Place of birth for U.S.-born residents:
This state: 25,535
Northeast: 69
Midwest: 1,353
South: 681
West: 601
66% of the 78570 zip code residents lived in the same house 5 years ago. Out of people who lived in different houses, 78% lived in this county. Out of people who lived in different counties, 50% lived in Texas.
93% of the 78570 zip code residents lived in the same house 1 year ago. Out of people who lived in different houses, 61% moved from this county. Out of people who lived in different houses, 22% moved from different county within same state. Out of people who lived in different houses, 14% moved from different state. Out of people who lived in different houses, 4% moved from abroad.
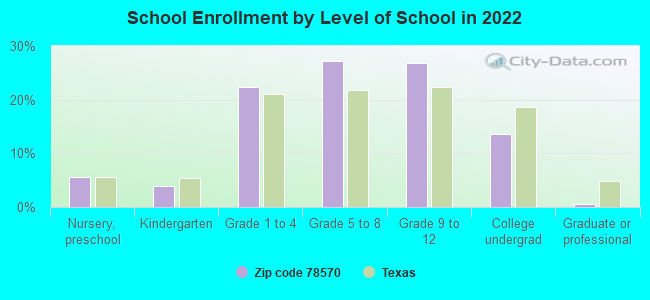
Private vs. public school enrollment:
Students in private schools in grades 1 to 8 (elementary and middle school): 6
Here:
0.1%
Texas:
8.8%
Students in private schools in grades 9 to 12 (high school): 11
Here:
0.4%
Texas:
8.0%
Students in private undergraduate colleges: 584
Here:
35.8%
Texas:
16.2%
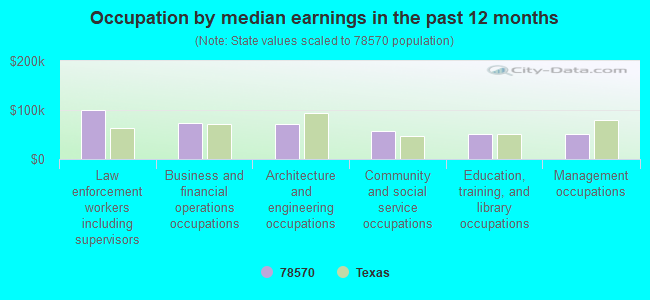
Occupation by median earnings in the past 12 months ($)
99,859Law enforcement workers including supervisors
73,637Business and financial operations occupations
70,617Architecture and engineering occupations
57,594Community and social service occupations
51,963Education, training, and library occupations
51,432Management occupations
Companies with federal contracts located in this zip code (MERCEDES, TX):
JIMMY CLOSNER & SONS CONSTRUCT (MILE 8 1/4 N FM 491; small business) : $11,991,604 in 44 contractsfrom 2000 to 2006
Contracts for Administrative and Service Buildings, Construction of Structures and Facilities -- Other Non-Building Facilities, Construction of Structures and Facilities -- Other Administrative Facilities and Service Buildings, Construction of Structures and Facilities -- Dredging, and moreby U.S. Army Corps of Engineers - civil program financing only, Army, National Park Service, Animal and Plant Health Inspection Service (disused code), and others Signed by year:2000: $990,017; 2001: $275,645; 2002: $1,371,818; 2003: $3,357,073; 2004: $595,564; 2005: $3,393,568; 2006: $2,007,919.
Biggest contracts:
$1,704,094 with U.S. Army Corps of Engineers - civil program financing only for Administrative and Service Buildings. Signed on 2003-06-06. Completion date: 2004-12-30.
$1,409,358 with Army for Construction of Structures and Facilities -- Other Non-Building Facilities. Signed on 2006-04-11. Completion date: 2007-04-12.
$1,321,818 with U.S. Army Corps of Engineers - civil program financing only for Construction of Structures and Facilities -- Other Administrative Facilities and Service Buildings. Signed on 2002-03-27. Completion date: 2001-12-31.
$1,318,554 with U.S. Army Corps of Engineers - civil program financing only for Construction of Structures and Facilities -- Dredging. Signed on 2005-04-26. Completion date: 2003-09-30.
JR ALEX SOTO (EXPRESSWAY 83 MILE 3 E; small business) 4 employees, $170000 revenue. 8A Firm, Small Disadvantaged Business: $370,500 in 2 contractsin 2002
$371,000 with Financial Crimes Enforcement Network for Other Non-Building Structures. Signed on 2002-09-15. Completion date: 2003-04-15.
-$500 with Navy for Construction of Structures and Facilities -- Other Industrial Buildings. Signed on 2002-06-25. Completion date: 1997-05-08.
RXCO INC (546 S ILLINOIS ST; small business) : $106,041 in 5 contractsfrom 2003 to 2005
Contracts for Laundry and DryCleaning Services by Navy Signed by year:2000: $0; 2001: $0; 2002: $0; 2003: $45,647; 2004: $23,378; 2005: $37,016; 2006: $0.
Biggest contracts:
$45,647 with Navy for Laundry and DryCleaning Services. Signed on 2003-03-01. Completion date: 2007-02-28.
$31,023, same as above.Signed on 2005-12-09. Completion date: 2006-09-30.
$23,378, same as above.Signed on 2004-12-16. Completion date: 2005-09-30.
$5,304, same as above.Signed on 2005-03-09. Completion date: 2005-09-30.
LONE STAR SHREDDING & DOCUMENT (1970 W EXPRESSWAY 83; small business)
$15,000 with Army for Paper Shredding Services. Signed on 2005-09-15. Completion date: 2006-09-30.
Top industries in this zip code by the number of employees in 2005:
Wholesale Trade: Fresh Fruit and Vegetable Merchant Wholesalers (100-249 employees: 1 establishment, 50-99 employees: 1 establishment, 1-4 employees: 2 establishments)
Construction: Poured Concrete Foundation and Structure Contractors (100-249: 1, 10-19: 1, 1-4: 1)
Utilities: Electric Power Distribution (100-249: 1)
Construction: Water and Sewer Line and Related Structures Construction (50-99: 1, 20-49: 1, 1-4: 1)
2002 - 2018 National Fire Incident Reporting System (NFIRS) incidents
According to the data from the years 2002 - 2018 the average number of fire incidents per year is 141. The highest number of fire incidents - 295 took place in 2011, and the least - 4 in 2003. The data has a declining trend.
When looking into fire subcategories, the most incidents belonged to: Outside Fires (67.5%), and Structure Fires (13.9%).
Fire incident types reported to NFIRS in Zip Code 78570
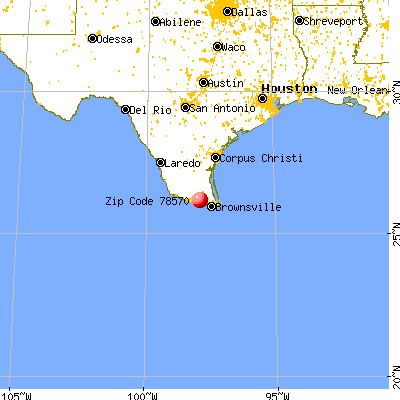


 Nearest zip codes: 78596, 78559, 78579, 78562, 78592, 78593.
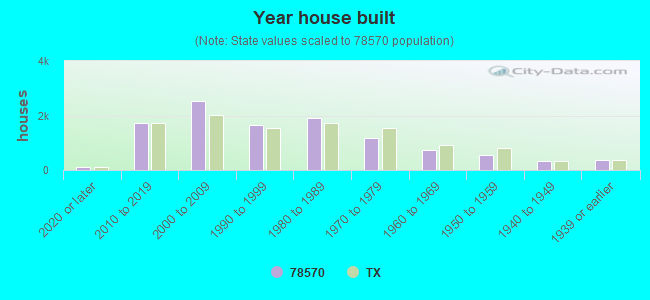


 : $11,991,604 in 44 contracts from 2000 to 2006

 According to the data from the years 2002 - 2018 the average number of fire incidents per year is 141. The highest number of fire incidents - 295 took place in 2011, and the least - 4 in 2003. The data has a declining trend.
 When looking into fire subcategories, the most incidents belonged to: Outside Fires (67.5%), and Structure Fires (13.9%).