Estimated zip code population in 2022: 13,321 Zip code population in 2010: 12,751 Zip code population in 2000: 9,151
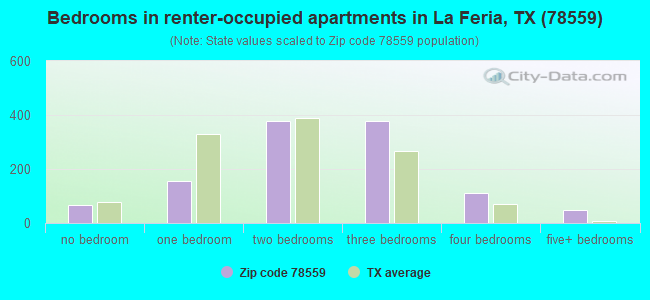
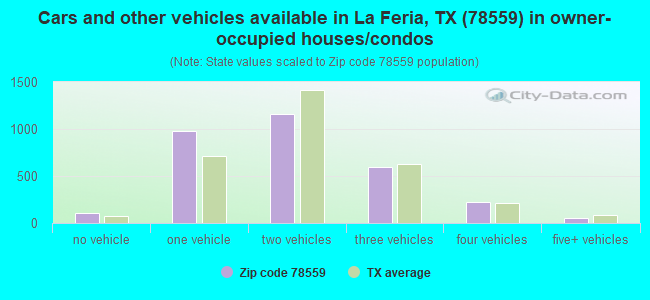
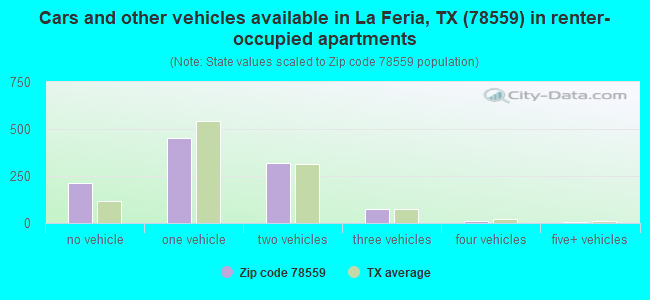
Houses and condos: 5,136 Renter-occupied apartments: 1,144
% of renters here:
27%
State:
38%
March 2022 cost of living index in zip code 78559: 79.3 (low, U.S. average is 100)
Land area: 35.2 sq. mi. Water area: 0.9 sq. mi.
Population density: 378 people per square mile
(very low).
OSM Map
General Map
Google Map
MSN Map
OSM Map
General Map
Google Map
MSN Map
OSM Map
General Map
Google Map
MSN Map
OSM Map
General Map
Google Map
MSN Map
Please wait while loading the map...
Real estate property taxes paid for housing units in 2022:
This zip code:
1.1% ($1,242)
Texas:
1.5% ($4,050)
Median real estate property taxes paid for housing units with mortgages in 2022: $2,055 (1.3%) Median real estate property taxes paid for housing units with no mortgage in 2022: $932 (1.1%)
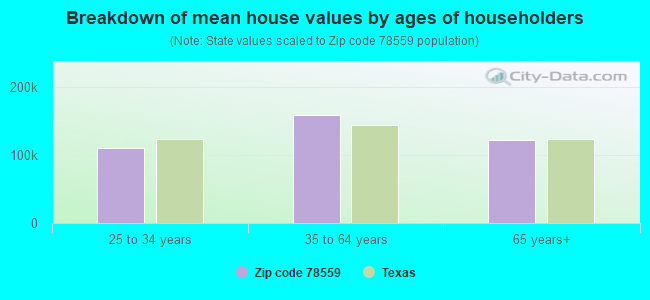
Estimated median house/condo value in 2022: $109,119
78559:
$109,119
Texas:
$275,400
According to our research of Texas and other state lists, there were 33 registered sex offenders living in 78559 zip code as of April 26, 2024. The ratio of all residents to sex offenders in zip code 78559 is 374 to 1. The ratio of registered sex offenders to all residents in this zip code is near the state average.
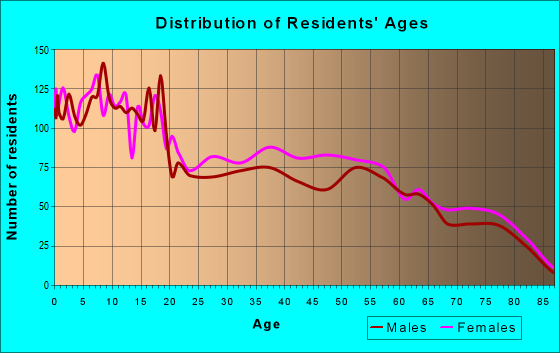
Median resident age:
This zip code:
31.4 years
Texas median age:
35.6 years
Average household size:
This zip code:
3.1 people
Texas:
2.6 people
Averages for the 2020 tax year for zip code 78559, filed in 2021:
Average Adjusted Gross Income (AGI) in 2020: $39,946 (Individual Income Tax Returns)
Here:
$39,946
State:
$77,054
Salary/wage: $37,119 (reported on 85.0% of returns)
Here:
$37,119
State:
$62,766
(% of AGI for various income ranges: 1198.3% for AGIs below $25k, 3467.8% for AGIs $25k-50k, 6217.2% for AGIs $50k-75k, 9958.3% for AGIs $75k-100k, 15466.8% for AGIs $100k-200k)
Taxable interest for individuals: $892 (reported on 11.6% of returns)
This zip code:
$892
Texas:
$2,665
(% of AGI for various income ranges: 4.2% for AGIs below $25k, 6.0% for AGIs $25k-50k, 24.0% for AGIs $50k-75k, 25.6% for AGIs $75k-100k, 67.6% for AGIs $100k-200k)
Ordinary dividends: $2,353 (reported on 3.6% of returns)
Here:
$2,353
State:
$10,044
(% of AGI for various income ranges: 3.3% for AGIs below $25k, 7.8% for AGIs $25k-50k, 6.0% for AGIs $50k-75k, 37.8% for AGIs $75k-100k, 71.6% for AGIs $100k-200k)
Net capital gain/loss in AGI: +$5,391 (reported on 4.2% of returns)
Here:
+$5,391
State:
+$39,590
(% of AGI for various income ranges: 2.7% for AGIs below $25k, 11.0% for AGIs $25k-50k, 42.8% for AGIs $50k-75k, 30.6% for AGIs $75k-100k, 282.8% for AGIs $100k-200k)
Profit/loss from business: +$5,425 (reported on 17.3% of returns)
Here:
+$5,425
State:
+$10,888
(% of AGI for various income ranges: 136.8% for AGIs below $25k, 81.5% for AGIs $50k-75k, 92.8% for AGIs $75k-100k, 669.2% for AGIs $100k-200k)
Taxable individual retirement arrangement distribution: $15,138 (reported on 4.0% of returns)
78559:
$15,138
Texas:
$24,740
(% of AGI for various income ranges: 21.1% for AGIs below $25k, 30.5% for AGIs $25k-50k, 124.0% for AGIs $50k-75k, 286.1% for AGIs $75k-100k, 473.6% for AGIs $100k-200k)
Total itemized deductions: $31,121 (reported on 2.7% of returns)
Here:
$31,121
State:
$40,428
(% of AGI for various income ranges: 68.4% for AGIs $25k-50k, 205.1% for AGIs $50k-75k, 387.8% for AGIs $75k-100k, 675.6% for AGIs $100k-200k)
Charity contributions: $7,375 (reported on 1.5% of returns)
Here:
$7,375
State:
$18,201
(% of AGI for various income ranges: 57.0% for AGIs $50k-75k, 115.2% for AGIs $100k-200k)
Taxes paid: $6,818 (reported on 2.1% of returns)
78559:
$6,818
State:
$7,821
(% of AGI for various income ranges: 5.3% for AGIs below $25k, 29.4% for AGIs $50k-75k, 70.0% for AGIs $75k-100k, 144.4% for AGIs $100k-200k)
Earned income credit: $2,888 (reported on 34.7% of returns)
Here:
$2,888
State:
$2,584
(% of AGI for various income ranges: 180.9% for AGIs below $25k, 123.6% for AGIs $25k-50k, 3.2% for AGIs $50k-75k)
Percentage of individuals using paid preparers for their 2020 taxes: 90.3%
Here:
90%
State:
92%
(% for various income ranges: 91.0% for AGIs below $25k, 90.6% for AGIs $25k-50k, 89.6% for AGIs $50k-75k, 88.5% for AGIs $75k-100k, 86.5% for AGIs $100k-200k, 100.0% for AGIs over 200k)
Averages for the 2012 tax year for zip code 78559, filed in 2013:
Average Adjusted Gross Income (AGI) in 2012: $33,823 (Individual Income Tax Returns)
Here:
$33,823
State:
$65,384
Salary/wage: $31,059 (reported on 85.7% of returns)
Here:
$31,059
State:
$52,524
(% of AGI for various income ranges: 77.6% for AGIs below $25k, 85.4% for AGIs $25k-50k, 79.1% for AGIs $50k-75k, 81.7% for AGIs $75k-100k, 79.8% for AGIs $100k-200k, 41.3% for AGIs over 200k)
Taxable interest for individuals: $1,249 (reported on 13.1% of returns)
This zip code:
$1,249
Texas:
$2,372
(% of AGI for various income ranges: 0.3% for AGIs below $25k, 0.4% for AGIs $25k-50k, 0.6% for AGIs $50k-75k, 0.2% for AGIs $75k-100k, 1.0% for AGIs $100k-200k)
Ordinary dividends: $3,015 (reported on 4.5% of returns)
Here:
$3,015
State:
$9,721
(% of AGI for various income ranges: 0.3% for AGIs below $25k, 0.2% for AGIs $25k-50k, 0.5% for AGIs $50k-75k, 1.1% for AGIs $100k-200k)
Net capital gain/loss in AGI: +$6,718 (reported on 3.8% of returns)
Here:
+$6,718
State:
+$35,319
(% of AGI for various income ranges: 0.2% for AGIs $50k-75k, 4.1% for AGIs $100k-200k)
Profit/loss from business: +$7,401 (reported on 18.9% of returns)
Here:
+$7,401
State:
+$13,732
(% of AGI for various income ranges: 12.9% for AGIs below $25k, 1.9% for AGIs $25k-50k, 2.0% for AGIs $50k-75k, 2.7% for AGIs $75k-100k, 0.7% for AGIs $100k-200k)
Taxable individual retirement arrangement distribution: $12,239 (reported on 5.1% of returns)
78559:
$12,239
Texas:
$19,511
(% of AGI for various income ranges: 1.4% for AGIs below $25k, 1.4% for AGIs $25k-50k, 1.7% for AGIs $50k-75k, 2.6% for AGIs $75k-100k, 3.3% for AGIs $100k-200k)
Total itemized deductions: $19,750 (26% of AGI, reported on 12.9% of returns)
Here:
$19,750
State:
$24,724
Here:
25.6% of AGI
State:
15.9% of AGI
(% of AGI for various income ranges: 2.2% for AGIs below $25k, 6.8% for AGIs $25k-50k, 10.4% for AGIs $50k-75k, 10.1% for AGIs $75k-100k, 13.1% for AGIs $100k-200k)
Charity contributions: $3,141 (reported on 9.8% of returns)
Here:
$3,141
State:
$6,808
(% of AGI for various income ranges: 0.2% for AGIs below $25k, 0.6% for AGIs $25k-50k, 1.4% for AGIs $50k-75k, 0.9% for AGIs $75k-100k, 2.0% for AGIs $100k-200k)
Taxes paid: $3,939 (reported on 12.5% of returns)
78559:
$3,939
State:
$6,921
(% of AGI for various income ranges: 0.3% for AGIs below $25k, 1.1% for AGIs $25k-50k, 2.0% for AGIs $50k-75k, 2.0% for AGIs $75k-100k, 3.0% for AGIs $100k-200k)
Earned income credit: $2,968 (reported on 43.2% of returns)
Here:
$2,968
State:
$2,570
(% of AGI for various income ranges: 14.1% for AGIs below $25k, 2.6% for AGIs $25k-50k)
Percentage of individuals using paid preparers for their 2012 taxes: 56.6%
Here:
57%
State:
51%
(% for various income ranges: 55.2% for AGIs below $25k, 57.3% for AGIs $25k-50k, 57.1% for AGIs $50k-75k, 61.9% for AGIs $75k-100k, 71.4% for AGIs $100k-200k)
Averages for the 2004 tax year for zip code 78559, filed in 2005:
Average Adjusted Gross Income (AGI) in 2004: $26,415 (Individual Income Tax Returns)
Here:
$26,415
State:
$47,881
Salary/wage: $24,794 (reported on 86.3% of returns)
Here:
$24,794
State:
$41,947
(% of AGI for various income ranges: 96.4% for AGIs below $10k, 83.2% for AGIs $10k-25k, 84.0% for AGIs $25k-50k, 77.8% for AGIs $50k-75k, 83.3% for AGIs $75k-100k, 67.9% for AGIs over 100k)
Taxable interest for individuals: $1,693 (reported on 19.0% of returns)
This zip code:
$1,693
Texas:
$2,255
(% of AGI for various income ranges: 1.8% for AGIs below $10k, 1.2% for AGIs $10k-25k, 1.1% for AGIs $25k-50k, 1.6% for AGIs $50k-75k, 0.7% for AGIs $75k-100k, 1.1% for AGIs over 100k)
Taxable dividends: $2,705 (reported on 6.9% of returns)
Here:
$2,705
State:
$4,261
(% of AGI for various income ranges: 0.5% for AGIs below $10k, 0.5% for AGIs $10k-25k, 0.7% for AGIs $25k-50k, 1.4% for AGIs $50k-75k, 0.4% for AGIs $75k-100k, 0.6% for AGIs over 100k)
Net capital gain/loss: +$6,470 (reported on 6.1% of returns)
Here:
+$6,470
State:
+$16,110
(% of AGI for various income ranges: 0.0% for AGIs below $10k, 0.2% for AGIs $10k-25k, 0.8% for AGIs $25k-50k, 0.6% for AGIs $50k-75k, 0.5% for AGIs $75k-100k, 7.8% for AGIs over 100k)
Profit/loss from business: +$5,420 (reported on 14.7% of returns)
Here:
+$5,420
State:
+$11,013
(% of AGI for various income ranges: 8.2% for AGIs below $10k, 5.1% for AGIs $10k-25k, 1.4% for AGIs $25k-50k, 2.4% for AGIs $50k-75k, 0.2% for AGIs $75k-100k, 4.1% for AGIs over 100k)
Profit/loss from farming: +$12 (reported on 2.1% of returns)
Here:
+$12
State:
-$9,403
(% of AGI for various income ranges: -0.1% for AGIs $10k-25k, -0.3% for AGIs $25k-50k, 0.9% for AGIs $50k-75k, -0.4% for AGIs $75k-100k, -0.1% for AGIs over 100k)
IRA payment deduction: $2,900 (reported on 1.0% of returns)
78559:
$2,900
Texas:
$3,120
Total itemized deductions: $16,514 (25% of AGI, reported on 9.5% of returns)
Here:
$16,514
State:
$19,631
Here:
25.3% of AGI
State:
18.9% of AGI
(% of AGI for various income ranges: 2.4% for AGIs $10k-25k, 5.3% for AGIs $25k-50k, 9.5% for AGIs $50k-75k, 9.2% for AGIs $75k-100k, 8.1% for AGIs over 100k)
Charity contributions deductions: $2,875 (4% of AGI, reported on 7.5% of returns)
Here:
$2,875
State:
$4,753
Here:
4.2% of AGI
State:
4.2% of AGI
(% of AGI for various income ranges: 0.2% for AGIs $10k-25k, 0.6% for AGIs $25k-50k, 1.2% for AGIs $50k-75k, 1.4% for AGIs $75k-100k, 1.6% for AGIs over 100k)
Total tax: $3,510 (reported on 53.7% of returns)
78559:
$3,510
State:
$9,058
(% of AGI for various income ranges: 3.0% for AGIs below $10k, 2.4% for AGIs $10k-25k, 4.9% for AGIs $25k-50k, 8.6% for AGIs $50k-75k, 10.2% for AGIs $75k-100k, 17.3% for AGIs over 100k)
Earned income credit: $2,313 (reported on 44.9% of returns)
Here:
$2,313
State:
$2,024
Percentage of individuals using paid preparers for their 2004 taxes: 63.3%
Here:
63%
State:
57%
(% for various income ranges: 59.2% for AGIs below $10k, 67.8% for AGIs $10k-25k, 62.9% for AGIs $25k-50k, 57.7% for AGIs $50k-75k, 55.2% for AGIs $75k-100k, 64.9% for AGIs over 100k)
Household received Food Stamps/SNAP in the past 12 months: 1,206 Household did not receive Food Stamps/SNAP in the past 12 months: 3,093
Women who had a birth in the past 12 months: 129 (88 now married, 40 unmarried) Women who did not have a birth in the past 12 months: 2,971 (1,311 now married, 1,660 unmarried)
Housing units in zip code 78559 with a mortgage: 1,356 (26 second mortgage, 28 both second mortgage and home equity loan) Houses without a mortgage: 67
Median monthly owner costs for units with a mortgage: $1,279 Median monthly owner costs for units without a mortgage: $423
Residents with income below the poverty level in 2022:
This zip code:
26.6%
Whole state:
14.0%
Residents with income below 50% of the poverty level in 2022:
This zip code:
18.4%
Whole state:
7.4%
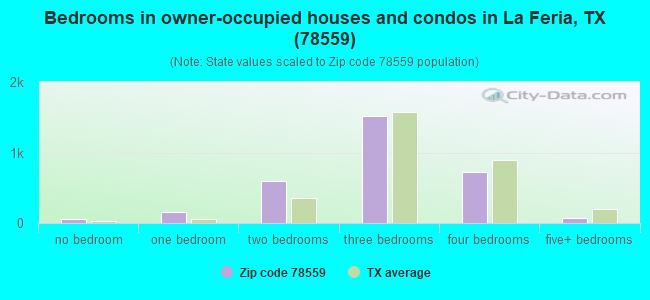
Median number of rooms in houses and condos:
Here:
5.5
State:
6.3
Median number of rooms in apartments:
Here:
4.3
State:
4.0
Notable locations in this zip code not listed on our city pages
Notable locations in zip code 78559: La Feria Pumping Station (A), La Feria Volunteer Fire Department (B), La Feria Police Department (C). Display/hide their locations on the map
In group quarters: 1 (-1 institutionalized population)
Size of family households: 1,073 2-persons, 285 3-persons, 519 4-persons, 640 5-persons, 181 6-persons, 203 7-or-more-persons
Size of nonfamily households: 1,280 1-person, 66 2-persons
2,083 married couples with children.
1,794 single-parent households (274 men, 1,520 women).
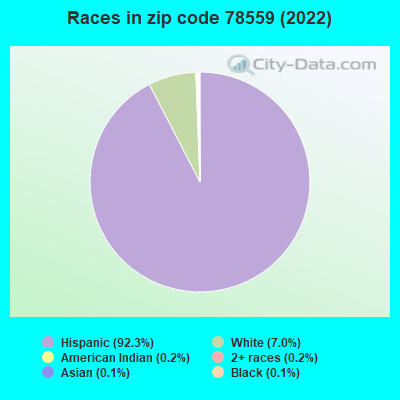
40.5% of residents of 78559 zip code speak English at home.
59.5% of residents speak Spanish at home (74% very well, 7% well, 10% not well, 10% not at all).
0.2% of residents speak Asian or Pacific Island language at home (5% very well, 95% not well).
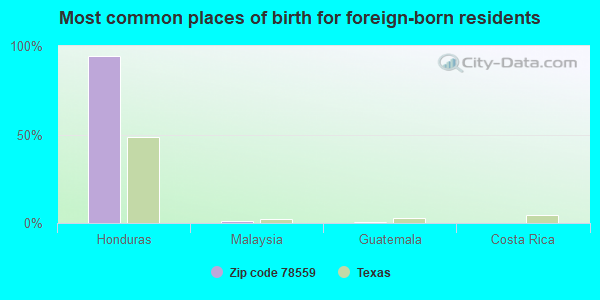
Foreign born population: 2,079 (15.6%) (32.0% of them are naturalized citizens)
This zip code:
15.6%
Whole state:
17.2%
94%Honduras
1%Malaysia
0%Guatemala
0%Costa Rica
0%Syria
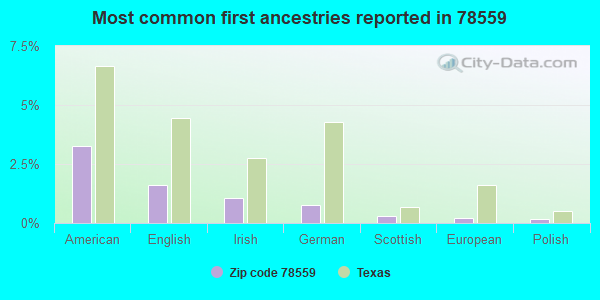
3%American
2%English
1%Irish
1%German
0%Scottish
0%European
0%Polish
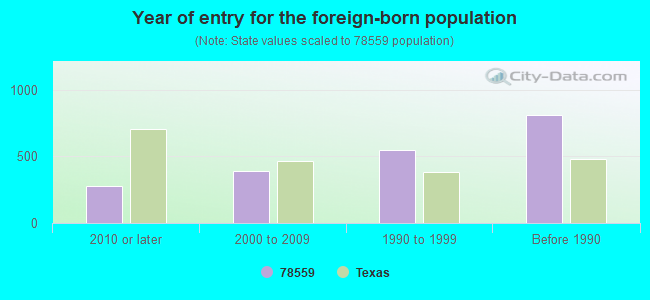
Year of entry for the foreign-born population
2812010 or later
3922000 to 2009
5481990 to 1999
812Before 1990
Housing units lacking complete plumbing facilities: 0.8% Housing units lacking complete kitchen facilities: 2.4%
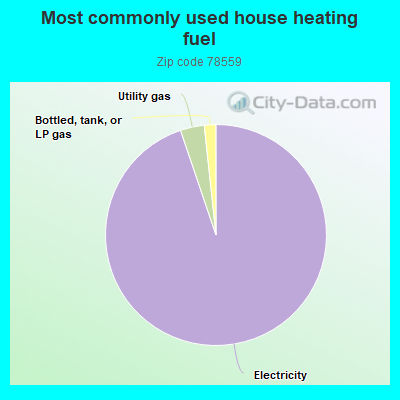
94.8%Electricity
3.5%Utility gas
1.7%Bottled, tank, or LP gas
Population in 1990: 8,446. Population change in the 1990s: +705 (+8.3%).
Place of birth for U.S.-born residents:
This state: 9,749
Northeast: 99
Midwest: 425
South: 592
West: 222
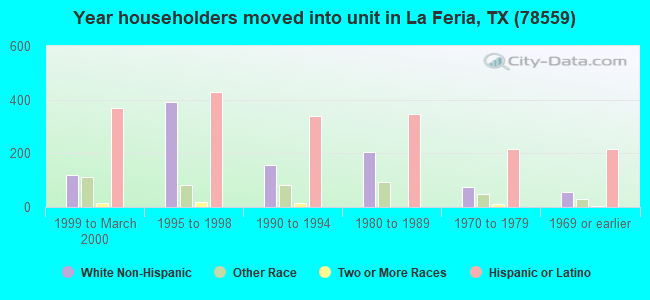
68% of the 78559 zip code residents lived in the same house 5 years ago. Out of people who lived in different houses, 59% lived in this county. Out of people who lived in different counties, 50% lived in Texas.
98% of the 78559 zip code residents lived in the same house 1 year ago. Out of people who lived in different houses, 85% moved from this county. Out of people who lived in different houses, 24% moved from different county within same state. Out of people who lived in different houses, 2% moved from different state.
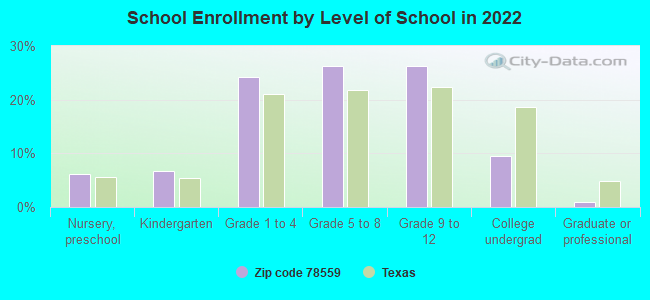
Private vs. public school enrollment:
Students in private schools in grades 1 to 8 (elementary and middle school):
Here:
0.0%
Texas:
8.8%
Students in private schools in grades 9 to 12 (high school):
Here:
0.0%
Texas:
8.0%
Students in private undergraduate colleges: 116
Here:
27.8%
Texas:
16.2%
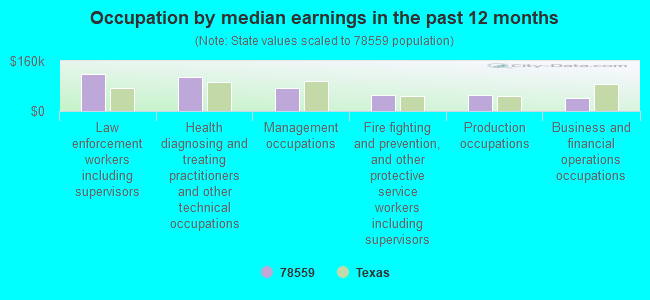
Occupation by median earnings in the past 12 months ($)
119,484Law enforcement workers including supervisors
107,731Health diagnosing and treating practitioners and other technical occupations
72,413Management occupations
51,832Fire fighting and prevention, and other protective service workers including supervisors
50,433Production occupations
42,129Business and financial operations occupations
Companies with federal contracts located in this zip code:
CARLOS FUENTES (124 W 5TH ST in LA FERIA, TX; small business)
$77,000 with National Oceanic and Atmospheric Administration/Under Secretary for Oceans and Atmosphere for Construction of Structures and Facilities -- Open Storage Facilities. Signed on 2001-08-15. Completion date: 2001-12-15.
TITAN FENCE SUPPLY CO OF SOUTH (1 2 MI W WHITE RANCH RD in LA FERIA, TX; small business) 6 employees, $270000 revenue. Small Disadvantaged Business
$2,000 with Agricultural Research Service (disused code) for Maintenance, Repair or Alteration of Real Property -- Other Non-Building Facilities. Signed on 2001-03-15. Completion date: 2001-03-15.
Top industries in this zip code by the number of employees in 2005:
Construction: Power and Communication Line and Related Structures Construction (50-99 employees: 1 establishment)
Accommodation and Food Services: Limited-Service Restaurants (20-49: 1, 10-19: 2)
Accommodation and Food Services: Full-Service Restaurants (20-49: 1, 10-19: 1)
Health Care and Social Assistance: Offices of Physicians (except Mental Health Specialists) (20-49: 1, 5-9: 1, 1-4: 1)
Health Care and Social Assistance: Child Day Care Services (10-19: 2, 5-9: 1, 1-4: 2)
Fatal accident statistics in 2013:
Fatal accident count: 1
Vehicles involved in fatal accidents: 2
Fatal accidents caused by drunken drivers: 1
Fatalities: 1
Persons involved in fatal accidents: 1
Pedestrians involved in fatal accidents: 1
Fatal accident statistics in 2011:
Fatal accident count: 2
Vehicles involved in fatal accidents: 4
Fatal accidents caused by drunken drivers: 1
Fatalities: 3
Persons involved in fatal accidents: 5
Pedestrians involved in fatal accidents: 0
Home Mortgage Disclosure Act Aggregated Statistics For Year 2009 (Based on 6 partial tracts)
A) FHA, FSA/RHS & VA Home Purchase Loans
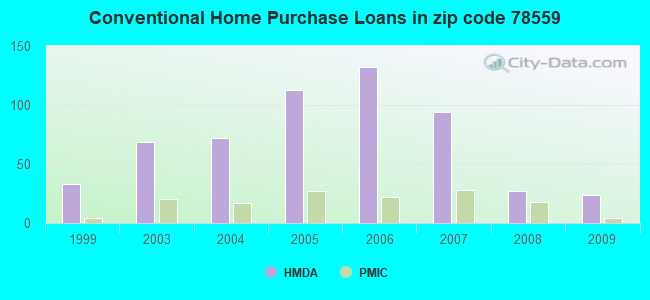
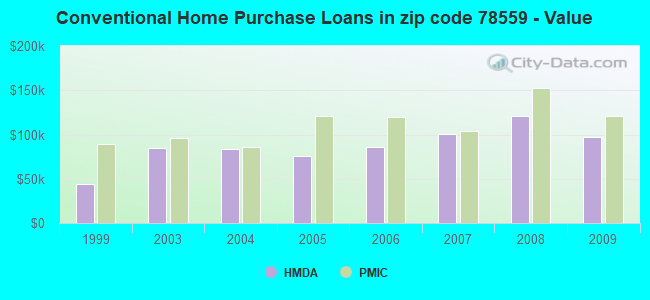
B) Conventional Home Purchase Loans
C) Refinancings
D) Home Improvement Loans
F) Non-occupant Loans on < 5 Family Dwellings (A B C & D)
G) Loans On Manufactured Home Dwelling (A B C & D)
Number
Average Value
Number
Average Value
Number
Average Value
Number
Average Value
Number
Average Value
Number
Average Value
LOANS ORIGINATED
25
$130,097
24
$97,508
45
$121,048
10
$44,007
10
$62,497
7
$34,026
APPLICATIONS APPROVED, NOT ACCEPTED
4
$52,680
3
$97,553
10
$169,047
1
$17,610
0
$0
1
$35,220
APPLICATIONS DENIED
1
$23,760
12
$86,746
71
$96,420
43
$18,734
1
$84,750
7
$13,976
APPLICATIONS WITHDRAWN
5
$67,898
6
$87,682
27
$99,285
8
$31,359
5
$55,028
0
$0
FILES CLOSED FOR INCOMPLETENESS
0
$0
0
$0
13
$52,138
6
$42,188
0
$0
2
$8,250
Aggregated Statistics For Year 2008 (Based on 6 partial tracts)
A) FHA, FSA/RHS & VA Home Purchase Loans
B) Conventional Home Purchase Loans
C) Refinancings
D) Home Improvement Loans
E) Loans on Dwellings For 5+ Families
F) Non-occupant Loans on < 5 Family Dwellings (A B C & D)
G) Loans On Manufactured Home Dwelling (A B C & D)
Number
Average Value
Number
Average Value
Number
Average Value
Number
Average Value
Number
Average Value
Number
Average Value
Number
Average Value
LOANS ORIGINATED
28
$94,631
27
$120,957
59
$127,019
26
$34,431
1
$148,580
7
$50,929
1
$108,960
APPLICATIONS APPROVED, NOT ACCEPTED
2
$49,525
3
$57,587
9
$91,917
4
$9,462
0
$0
3
$28,973
0
$0
APPLICATIONS DENIED
7
$71,547
18
$65,322
115
$90,836
71
$33,113
0
$0
6
$49,065
8
$31,501
APPLICATIONS WITHDRAWN
3
$83,610
6
$85,922
36
$107,769
7
$30,817
0
$0
2
$78,145
1
$11,010
FILES CLOSED FOR INCOMPLETENESS
0
$0
2
$58,330
10
$130,443
4
$27,098
0
$0
0
$0
0
$0
Aggregated Statistics For Year 2007 (Based on 6 partial tracts)
A) FHA, FSA/RHS & VA Home Purchase Loans
B) Conventional Home Purchase Loans
C) Refinancings
D) Home Improvement Loans
F) Non-occupant Loans on < 5 Family Dwellings (A B C & D)
G) Loans On Manufactured Home Dwelling (A B C & D)
Number
Average Value
Number
Average Value
Number
Average Value
Number
Average Value
Number
Average Value
Number
Average Value
LOANS ORIGINATED
18
$107,196
94
$100,638
84
$115,268
37
$26,411
26
$87,263
14
$30,830
APPLICATIONS APPROVED, NOT ACCEPTED
2
$159,245
14
$98,194
33
$112,077
6
$33,748
8
$130,039
2
$25,580
APPLICATIONS DENIED
9
$113,324
37
$88,645
173
$105,691
74
$36,570
8
$171,318
10
$33,082
APPLICATIONS WITHDRAWN
2
$77,560
8
$62,502
67
$110,228
11
$57,129
3
$52,260
2
$25,580
FILES CLOSED FOR INCOMPLETENESS
1
$84,750
2
$163,300
19
$207,431
3
$35,023
1
$84,750
0
$0
Aggregated Statistics For Year 2006 (Based on 6 partial tracts)
A) FHA, FSA/RHS & VA Home Purchase Loans
B) Conventional Home Purchase Loans
C) Refinancings
D) Home Improvement Loans
E) Loans on Dwellings For 5+ Families
F) Non-occupant Loans on < 5 Family Dwellings (A B C & D)
G) Loans On Manufactured Home Dwelling (A B C & D)
Number
Average Value
Number
Average Value
Number
Average Value
Number
Average Value
Number
Average Value
Number
Average Value
Number
Average Value
LOANS ORIGINATED
25
$92,405
132
$85,852
94
$104,133
39
$38,969
2
$122,940
19
$60,655
12
$22,373
APPLICATIONS APPROVED, NOT ACCEPTED
7
$131,424
56
$122,004
46
$94,179
7
$25,149
0
$0
3
$37,223
6
$30,263
APPLICATIONS DENIED
3
$64,190
62
$81,608
104
$89,024
69
$40,390
0
$0
14
$70,829
14
$29,578
APPLICATIONS WITHDRAWN
3
$113,730
37
$84,814
50
$96,194
15
$45,430
0
$0
4
$36,868
3
$37,600
FILES CLOSED FOR INCOMPLETENESS
0
$0
8
$61,625
7
$84,680
2
$60,535
0
$0
2
$51,180
0
$0
Aggregated Statistics For Year 2005 (Based on 6 partial tracts)
A) FHA, FSA/RHS & VA Home Purchase Loans
B) Conventional Home Purchase Loans
C) Refinancings
D) Home Improvement Loans
F) Non-occupant Loans on < 5 Family Dwellings (A B C & D)
G) Loans On Manufactured Home Dwelling (A B C & D)
Number
Average Value
Number
Average Value
Number
Average Value
Number
Average Value
Number
Average Value
Number
Average Value
LOANS ORIGINATED
15
$122,137
113
$75,798
115
$100,139
40
$21,825
22
$42,390
13
$22,365
APPLICATIONS APPROVED, NOT ACCEPTED
2
$83,645
37
$64,411
30
$55,931
6
$67,137
6
$46,042
10
$24,376
APPLICATIONS DENIED
10
$100,189
51
$63,147
144
$84,779
53
$30,667
13
$66,836
19
$32,135
APPLICATIONS WITHDRAWN
0
$0
27
$78,273
66
$90,527
12
$129,130
6
$25,492
3
$17,970
FILES CLOSED FOR INCOMPLETENESS
0
$0
6
$95,287
18
$81,764
0
$0
0
$0
0
$0
Aggregated Statistics For Year 2004 (Based on 6 partial tracts)
A) FHA, FSA/RHS & VA Home Purchase Loans
B) Conventional Home Purchase Loans
C) Refinancings
D) Home Improvement Loans
F) Non-occupant Loans on < 5 Family Dwellings (A B C & D)
G) Loans On Manufactured Home Dwelling (A B C & D)
Number
Average Value
Number
Average Value
Number
Average Value
Number
Average Value
Number
Average Value
Number
Average Value
LOANS ORIGINATED
7
$74,073
72
$83,313
109
$91,978
33
$12,094
9
$55,323
13
$22,977
APPLICATIONS APPROVED, NOT ACCEPTED
1
$104,560
20
$66,299
17
$69,877
8
$38,784
1
$70,440
3
$29,893
APPLICATIONS DENIED
2
$62,185
46
$46,841
113
$68,335
47
$19,777
14
$53,536
24
$24,752
APPLICATIONS WITHDRAWN
3
$77,560
13
$50,561
45
$85,151
9
$31,662
3
$29,343
2
$30,395
FILES CLOSED FOR INCOMPLETENESS
0
$0
2
$101,255
22
$102,287
1
$27,520
0
$0
0
$0
Aggregated Statistics For Year 2003 (Based on 6 partial tracts)
A) FHA, FSA/RHS & VA Home Purchase Loans
B) Conventional Home Purchase Loans
C) Refinancings
D) Home Improvement Loans
F) Non-occupant Loans on < 5 Family Dwellings (A B C & D)
Number
Average Value
Number
Average Value
Number
Average Value
Number
Average Value
Number
Average Value
LOANS ORIGINATED
13
$103,856
69
$85,185
141
$99,941
17
$7,889
14
$44,926
APPLICATIONS APPROVED, NOT ACCEPTED
0
$0
4
$93,530
23
$91,716
3
$41,733
3
$14,303
APPLICATIONS DENIED
2
$61,055
15
$41,010
110
$63,934
44
$14,220
6
$20,728
APPLICATIONS WITHDRAWN
2
$75,390
6
$45,153
50
$50,741
3
$4,770
2
$22,560
FILES CLOSED FOR INCOMPLETENESS
0
$0
1
$91,350
4
$63,285
0
$0
0
$0
Aggregated Statistics For Year 1999 (Based on 1 partial tract)
A) FHA, FSA/RHS & VA Home Purchase Loans
B) Conventional Home Purchase Loans
C) Refinancings
D) Home Improvement Loans
F) Non-occupant Loans on < 5 Family Dwellings (A B C & D)
2002 - 2018 National Fire Incident Reporting System (NFIRS) incidents
According to the data from the years 2002 - 2018 the average number of fires per year is 15. The highest number of fires - 99 took place in 2002, and the least - 2 in 2010. The data has a declining trend.
When looking into fire subcategories, the most incidents belonged to: Outside Fires (66.3%), and Structure Fires (17.2%).
Fire incident types reported to NFIRS in Zip Code 78559


+$12
-$9,403
(% of AGI for various income ranges: -0.1% for AGIs $10k-25k, -0.3% for AGIs $25k-50k, 0.9% for AGIs $50k-75k, -0.4% for AGIs $75k-100k, -0.1% for AGIs over 100k)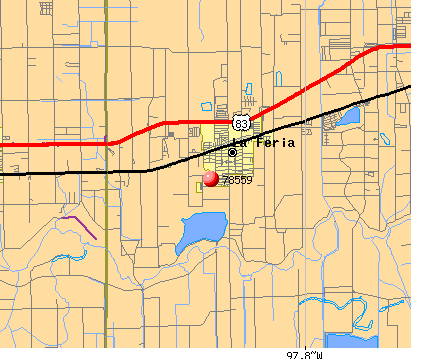 Nearest zip codes: 78570, 78592, 78552, 78593, 78567, 78535.
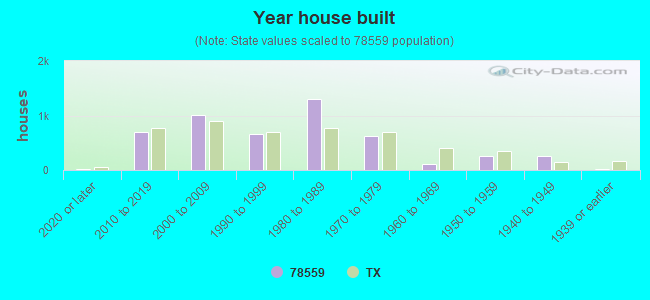


 According to the data from the years 2002 - 2018 the average number of fires per year is 15. The highest number of fires - 99 took place in 2002, and the least - 2 in 2010. The data has a declining trend.
 When looking into fire subcategories, the most incidents belonged to: Outside Fires (66.3%), and Structure Fires (17.2%).