Estimated zip code population in 2022: 41,921 Zip code population in 2010: 34,111 Zip code population in 2000: 29,965
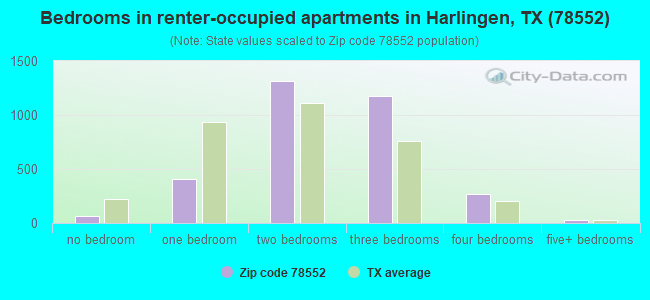
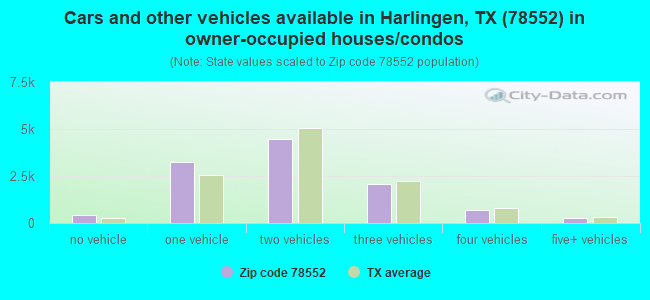
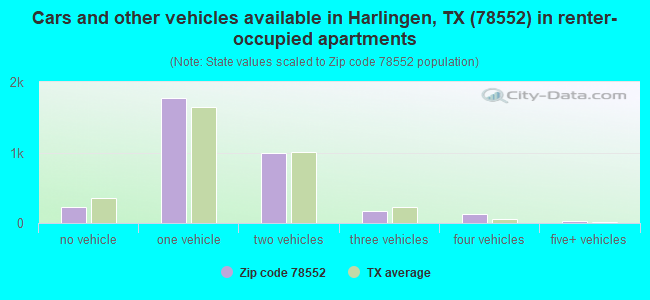
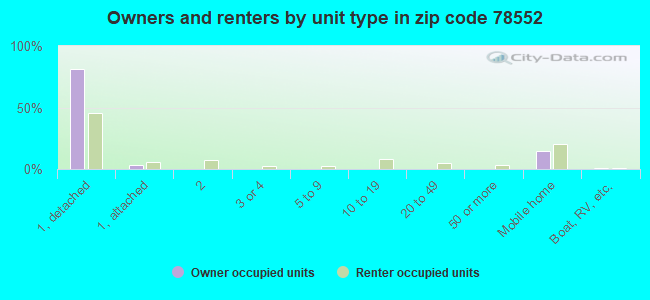
Houses and condos: 16,738 Renter-occupied apartments: 3,314
% of renters here:
23%
State:
38%
March 2022 cost of living index in zip code 78552: 79.5 (low, U.S. average is 100)
Land area: 49.2 sq. mi. Water area: 0.4 sq. mi.
Population density: 853 people per square mile
(low).
OSM Map
General Map
Google Map
MSN Map
OSM Map
General Map
Google Map
MSN Map
OSM Map
General Map
Google Map
MSN Map
OSM Map
General Map
Google Map
MSN Map
Please wait while loading the map...
Real estate property taxes paid for housing units in 2022:
This zip code:
1.5% ($2,290)
Texas:
1.5% ($4,050)
Median real estate property taxes paid for housing units with mortgages in 2022: $3,240 (1.6%) Median real estate property taxes paid for housing units with no mortgage in 2022: $1,537 (1.6%)
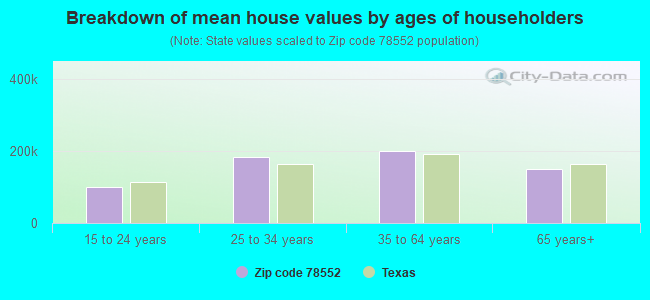
Estimated median house/condo value in 2022: $155,636
78552:
$155,636
Texas:
$275,400
According to our research of Texas and other state lists, there were 91 registered sex offenders living in 78552 zip code as of April 26, 2024. The ratio of all residents to sex offenders in zip code 78552 is 417 to 1. The ratio of registered sex offenders to all residents in this zip code is near the state average.
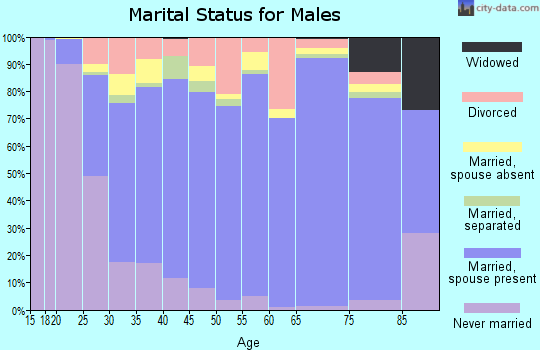
Median resident age:
This zip code:
34.6 years
Texas median age:
35.6 years
Average household size:
This zip code:
2.9 people
Texas:
2.6 people
Averages for the 2020 tax year for zip code 78552, filed in 2021:
Average Adjusted Gross Income (AGI) in 2020: $56,161 (Individual Income Tax Returns)
Here:
$56,161
State:
$77,054
Salary/wage: $48,707 (reported on 84.1% of returns)
Here:
$48,707
State:
$62,766
(% of AGI for various income ranges: 1186.8% for AGIs below $25k, 3423.2% for AGIs $25k-50k, 6302.8% for AGIs $50k-75k, 9074.0% for AGIs $75k-100k, 17122.6% for AGIs $100k-200k, 75445.3% for AGIs over 200k)
Taxable interest for individuals: $1,667 (reported on 15.9% of returns)
This zip code:
$1,667
Texas:
$2,665
(% of AGI for various income ranges: 8.8% for AGIs below $25k, 14.8% for AGIs $25k-50k, 31.3% for AGIs $50k-75k, 50.0% for AGIs $75k-100k, 96.9% for AGIs $100k-200k, 863.3% for AGIs over 200k)
Ordinary dividends: $7,409 (reported on 7.8% of returns)
Here:
$7,409
State:
$10,044
(% of AGI for various income ranges: 8.5% for AGIs below $25k, 16.9% for AGIs $25k-50k, 49.3% for AGIs $50k-75k, 68.7% for AGIs $75k-100k, 151.9% for AGIs $100k-200k, 3437.3% for AGIs over 200k)
Net capital gain/loss in AGI: +$14,537 (reported on 8.3% of returns)
Here:
+$14,537
State:
+$39,590
(% of AGI for various income ranges: 4.2% for AGIs below $25k, 16.9% for AGIs $25k-50k, 54.1% for AGIs $50k-75k, 96.7% for AGIs $75k-100k, 316.7% for AGIs $100k-200k, 8954.7% for AGIs over 200k)
Profit/loss from business: +$10,586 (reported on 18.0% of returns)
Here:
+$10,586
State:
+$10,888
(% of AGI for various income ranges: 116.4% for AGIs below $25k, 57.7% for AGIs $25k-50k, 110.5% for AGIs $50k-75k, 234.7% for AGIs $75k-100k, 461.2% for AGIs $100k-200k, 9053.3% for AGIs over 200k)
Taxable individual retirement arrangement distribution: $16,810 (reported on 5.3% of returns)
78552:
$16,810
Texas:
$24,740
(% of AGI for various income ranges: 23.7% for AGIs below $25k, 42.7% for AGIs $25k-50k, 124.7% for AGIs $50k-75k, 254.0% for AGIs $75k-100k, 436.4% for AGIs $100k-200k, 1856.7% for AGIs over 200k)
Self-employed (Keogh) retirement plans: $27,200 (reported on 0.2% of returns)
78552:
$27,200
Texas:
$29,298
(% of AGI for various income ranges: 78.5% for AGIs $100k-200k)
Total itemized deductions: $35,908 (reported on 4.2% of returns)
Here:
$35,908
State:
$40,428
(% of AGI for various income ranges: 15.5% for AGIs below $25k, 70.2% for AGIs $25k-50k, 209.1% for AGIs $50k-75k, 280.8% for AGIs $75k-100k, 615.4% for AGIs $100k-200k, 5614.0% for AGIs over 200k)
Charity contributions: $15,538 (reported on 3.2% of returns)
Here:
$15,538
State:
$18,201
(% of AGI for various income ranges: 10.2% for AGIs $25k-50k, 28.9% for AGIs $50k-75k, 53.2% for AGIs $75k-100k, 172.5% for AGIs $100k-200k, 3144.7% for AGIs over 200k)
Taxes paid: $6,834 (reported on 3.7% of returns)
78552:
$6,834
State:
$7,821
(% of AGI for various income ranges: 1.7% for AGIs below $25k, 10.4% for AGIs $25k-50k, 37.1% for AGIs $50k-75k, 52.9% for AGIs $75k-100k, 124.1% for AGIs $100k-200k, 846.0% for AGIs over 200k)
Earned income credit: $2,847 (reported on 27.9% of returns)
Here:
$2,847
State:
$2,584
(% of AGI for various income ranges: 165.0% for AGIs below $25k, 114.9% for AGIs $25k-50k, 2.3% for AGIs $50k-75k)
Percentage of individuals using paid preparers for their 2020 taxes: 92.2%
Here:
92%
State:
92%
(% for various income ranges: 91.2% for AGIs below $25k, 93.1% for AGIs $25k-50k, 93.0% for AGIs $50k-75k, 93.1% for AGIs $75k-100k, 92.3% for AGIs $100k-200k, 91.8% for AGIs over 200k)
Averages for the 2012 tax year for zip code 78552, filed in 2013:
Average Adjusted Gross Income (AGI) in 2012: $47,256 (Individual Income Tax Returns)
Here:
$47,256
State:
$65,384
Salary/wage: $40,184 (reported on 84.6% of returns)
Here:
$40,184
State:
$52,524
(% of AGI for various income ranges: 78.1% for AGIs below $25k, 81.8% for AGIs $25k-50k, 77.2% for AGIs $50k-75k, 78.0% for AGIs $75k-100k, 76.4% for AGIs $100k-200k, 46.4% for AGIs over 200k)
Taxable interest for individuals: $2,091 (reported on 19.7% of returns)
This zip code:
$2,091
Texas:
$2,372
(% of AGI for various income ranges: 0.5% for AGIs below $25k, 0.6% for AGIs $25k-50k, 0.7% for AGIs $50k-75k, 0.7% for AGIs $75k-100k, 1.0% for AGIs $100k-200k, 1.5% for AGIs over 200k)
Ordinary dividends: $6,195 (reported on 8.9% of returns)
Here:
$6,195
State:
$9,721
(% of AGI for various income ranges: 0.7% for AGIs below $25k, 0.6% for AGIs $25k-50k, 1.0% for AGIs $50k-75k, 1.1% for AGIs $75k-100k, 1.4% for AGIs $100k-200k, 1.9% for AGIs over 200k)
Net capital gain/loss in AGI: +$15,559 (reported on 8.2% of returns)
Here:
+$15,559
State:
+$35,319
(% of AGI for various income ranges: 0.2% for AGIs $25k-50k, 0.5% for AGIs $50k-75k, 0.5% for AGIs $75k-100k, 1.3% for AGIs $100k-200k, 11.4% for AGIs over 200k)
Profit/loss from business: +$11,892 (reported on 17.9% of returns)
Here:
+$11,892
State:
+$13,732
(% of AGI for various income ranges: 10.1% for AGIs below $25k, 2.2% for AGIs $25k-50k, 1.7% for AGIs $50k-75k, 1.7% for AGIs $75k-100k, 3.3% for AGIs $100k-200k, 7.7% for AGIs over 200k)
Taxable individual retirement arrangement distribution: $14,581 (reported on 7.1% of returns)
78552:
$14,581
Texas:
$19,511
(% of AGI for various income ranges: 1.7% for AGIs below $25k, 1.8% for AGIs $25k-50k, 2.4% for AGIs $50k-75k, 2.9% for AGIs $75k-100k, 2.6% for AGIs $100k-200k, 1.8% for AGIs over 200k)
Self-employment retirement plans: $16,525 (reported on 0.3% of returns)
78552:
$16,525
Texas:
$23,938
Total itemized deductions: $21,289 (19% of AGI, reported on 19.1% of returns)
Here:
$21,289
State:
$24,724
Here:
19.2% of AGI
State:
15.9% of AGI
(% of AGI for various income ranges: 2.9% for AGIs below $25k, 7.5% for AGIs $25k-50k, 10.5% for AGIs $50k-75k, 11.2% for AGIs $75k-100k, 11.6% for AGIs $100k-200k, 7.1% for AGIs over 200k)
Charity contributions: $4,821 (reported on 14.3% of returns)
Here:
$4,821
State:
$6,808
(% of AGI for various income ranges: 0.2% for AGIs below $25k, 0.8% for AGIs $25k-50k, 1.5% for AGIs $50k-75k, 1.5% for AGIs $75k-100k, 2.1% for AGIs $100k-200k, 2.1% for AGIs over 200k)
Taxes paid: $5,291 (reported on 18.3% of returns)
78552:
$5,291
State:
$6,921
(% of AGI for various income ranges: 0.5% for AGIs below $25k, 1.5% for AGIs $25k-50k, 2.2% for AGIs $50k-75k, 2.7% for AGIs $75k-100k, 3.0% for AGIs $100k-200k, 2.0% for AGIs over 200k)
Earned income credit: $2,888 (reported on 34.0% of returns)
Here:
$2,888
State:
$2,570
(% of AGI for various income ranges: 12.4% for AGIs below $25k, 2.3% for AGIs $25k-50k)
Percentage of individuals using paid preparers for their 2012 taxes: 55.9%
Here:
56%
State:
51%
(% for various income ranges: 55.1% for AGIs below $25k, 52.8% for AGIs $25k-50k, 56.3% for AGIs $50k-75k, 56.7% for AGIs $75k-100k, 60.8% for AGIs $100k-200k, 85.2% for AGIs over 200k)
Averages for the 2004 tax year for zip code 78552, filed in 2005:
Average Adjusted Gross Income (AGI) in 2004: $37,834 (Individual Income Tax Returns)
Here:
$37,834
State:
$47,881
Salary/wage: $32,973 (reported on 82.8% of returns)
Here:
$32,973
State:
$41,947
(% of AGI for various income ranges: 129.7% for AGIs below $10k, 79.0% for AGIs $10k-25k, 80.1% for AGIs $25k-50k, 75.9% for AGIs $50k-75k, 80.4% for AGIs $75k-100k, 55.8% for AGIs over 100k)
Taxable interest for individuals: $2,576 (reported on 28.2% of returns)
This zip code:
$2,576
Texas:
$2,255
(% of AGI for various income ranges: 5.0% for AGIs below $10k, 1.9% for AGIs $10k-25k, 1.6% for AGIs $25k-50k, 2.0% for AGIs $50k-75k, 1.4% for AGIs $75k-100k, 2.1% for AGIs over 100k)
Taxable dividends: $4,467 (reported on 14.0% of returns)
Here:
$4,467
State:
$4,261
(% of AGI for various income ranges: 4.0% for AGIs below $10k, 1.0% for AGIs $10k-25k, 1.0% for AGIs $25k-50k, 1.4% for AGIs $50k-75k, 1.0% for AGIs $75k-100k, 2.6% for AGIs over 100k)
Net capital gain/loss: +$11,810 (reported on 11.9% of returns)
Here:
+$11,810
State:
+$16,110
(% of AGI for various income ranges: -0.3% for AGIs below $10k, 0.2% for AGIs $10k-25k, 0.4% for AGIs $25k-50k, 0.9% for AGIs $50k-75k, 1.6% for AGIs $75k-100k, 9.7% for AGIs over 100k)
Profit/loss from business: +$9,443 (reported on 16.5% of returns)
Here:
+$9,443
State:
+$11,013
(% of AGI for various income ranges: 13.7% for AGIs below $10k, 5.9% for AGIs $10k-25k, 1.9% for AGIs $25k-50k, 2.6% for AGIs $50k-75k, 1.8% for AGIs $75k-100k, 5.8% for AGIs over 100k)
IRA payment deduction: $3,152 (reported on 2.0% of returns)
78552:
$3,152
Texas:
$3,120
(% of AGI for various income ranges: 0.5% for AGIs below $10k, 0.1% for AGIs $10k-25k, 0.2% for AGIs $25k-50k, 0.2% for AGIs $50k-75k, 0.2% for AGIs $75k-100k, 0.2% for AGIs over 100k)
Self-employed pension: $18,059 (reported on 0.4% of returns)
Here:
$18,059
Texas:
$16,401
Total itemized deductions: $18,397 (21% of AGI, reported on 18.0% of returns)
Here:
$18,397
State:
$19,631
Here:
21.0% of AGI
State:
18.9% of AGI
(% of AGI for various income ranges: 5.0% for AGIs below $10k, 3.5% for AGIs $10k-25k, 7.9% for AGIs $25k-50k, 10.3% for AGIs $50k-75k, 12.9% for AGIs $75k-100k, 9.5% for AGIs over 100k)
Charity contributions deductions: $4,270 (5% of AGI, reported on 14.3% of returns)
Here:
$4,270
State:
$4,753
Here:
4.6% of AGI
State:
4.2% of AGI
(% of AGI for various income ranges: 0.3% for AGIs below $10k, 0.4% for AGIs $10k-25k, 0.9% for AGIs $25k-50k, 1.7% for AGIs $50k-75k, 2.0% for AGIs $75k-100k, 2.5% for AGIs over 100k)
Total tax: $6,608 (reported on 61.9% of returns)
78552:
$6,608
State:
$9,058
(% of AGI for various income ranges: 4.5% for AGIs below $10k, 2.7% for AGIs $10k-25k, 5.5% for AGIs $25k-50k, 8.5% for AGIs $50k-75k, 10.0% for AGIs $75k-100k, 19.5% for AGIs over 100k)
Earned income credit: $2,288 (reported on 34.2% of returns)
Here:
$2,288
State:
$2,024
Percentage of individuals using paid preparers for their 2004 taxes: 63.2%
Here:
63%
State:
57%
(% for various income ranges: 60.9% for AGIs below $10k, 66.1% for AGIs $10k-25k, 60.5% for AGIs $25k-50k, 60.3% for AGIs $50k-75k, 60.6% for AGIs $75k-100k, 70.9% for AGIs over 100k)
Likely homosexual households (counted as self-reported same-sex unmarried-partner households)
Lesbian couples: 0.1% of all households
Gay men: 0.1% of all households
Household received Food Stamps/SNAP in the past 12 months: 2,338 Household did not receive Food Stamps/SNAP in the past 12 months: 12,140
Women who had a birth in the past 12 months: 649 (310 now married, 330 unmarried) Women who did not have a birth in the past 12 months: 7,700 (3,278 now married, 4,424 unmarried)
Housing units in zip code 78552 with a mortgage: 5,371 (60 second mortgage, 58 both second mortgage and home equity loan) Houses without a mortgage: 17
Median monthly owner costs for units with a mortgage: $1,401 Median monthly owner costs for units without a mortgage: $461
Residents with income below the poverty level in 2022:
This zip code:
19.8%
Whole state:
14.0%
Residents with income below 50% of the poverty level in 2022:
This zip code:
12.5%
Whole state:
7.4%
Median number of rooms in houses and condos:
Here:
5.6
State:
6.3
Median number of rooms in apartments:
Here:
4.4
State:
4.0
Notable locations in this zip code not listed on our city pages
Notable locations in zip code 78552: Harlingen Municipal Golf Course (A), Adams Gardens (B), Harlingen Fire Department Station 6 (C), Harlingen Fire Department Station 7 (D), Palm Valley Police Department (E). Display/hide their locations on the map
Parks in zip code 78552 include: Victor Park (1), Botts Park (2), Dixieland Park (3), Victor Park (4), Dixieland Park (5). Display/hide their locations on the map
5,734 married couples with children.
3,936 single-parent households (1,035 men, 2,901 women).
52.5% of residents of 78552 zip code speak English at home.
45.6% of residents speak Spanish at home (74% very well, 9% well, 9% not well, 7% not at all).
0.8% of residents speak other Indo-European language at home (87% very well, 10% well, 3% not well).
1.3% of residents speak Asian or Pacific Island language at home (57% very well, 13% well, 30% not well).
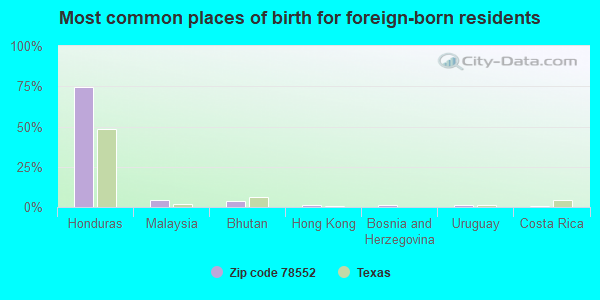
Foreign born population: 6,119 (14.6%) (48.8% of them are naturalized citizens)
This zip code:
14.6%
Whole state:
17.2%
74%Honduras
4%Malaysia
4%Bhutan
1%Hong Kong
1%Bosnia and Herzegovina
1%Uruguay
1%Costa Rica
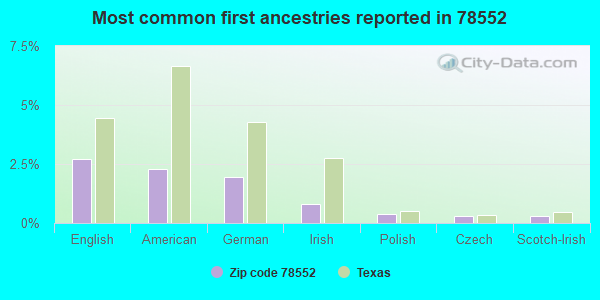
3%English
2%American
2%German
1%Irish
0%Polish
0%Czech
0%Scotch-Irish
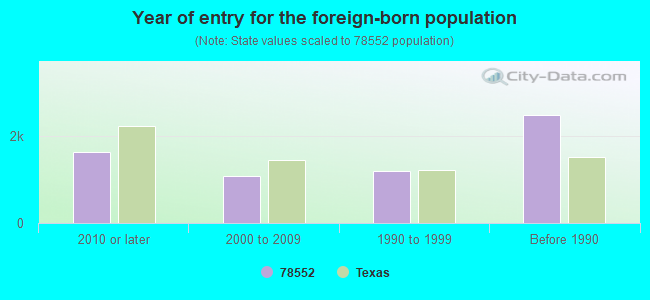
Year of entry for the foreign-born population
1,6272010 or later
1,0842000 to 2009
1,1821990 to 1999
2,470Before 1990
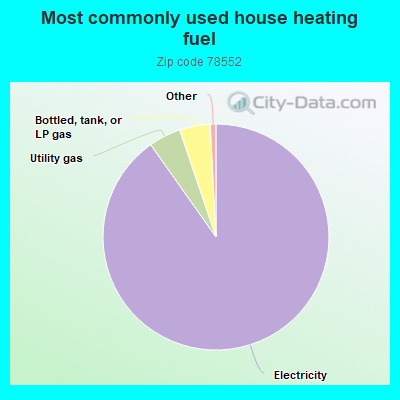
Housing units lacking complete plumbing facilities: 1.6% Housing units lacking complete kitchen facilities: 2.2%
90.2%Electricity
4.6%Utility gas
4.4%Bottled, tank, or LP gas
Population in 1990: 21,672. Population change in the 1990s: +8,293 (+38.3%).
Place of birth for U.S.-born residents:
This state: 29,892
Northeast: 560
Midwest: 2,155
South: 1,270
West: 1,283
62% of the 78552 zip code residents lived in the same house 5 years ago. Out of people who lived in different houses, 67% lived in this county. Out of people who lived in different counties, 50% lived in Texas.
95% of the 78552 zip code residents lived in the same house 1 year ago. Out of people who lived in different houses, 41% moved from this county. Out of people who lived in different houses, 47% moved from different county within same state. Out of people who lived in different houses, 12% moved from different state. Out of people who lived in different houses, 5% moved from abroad.
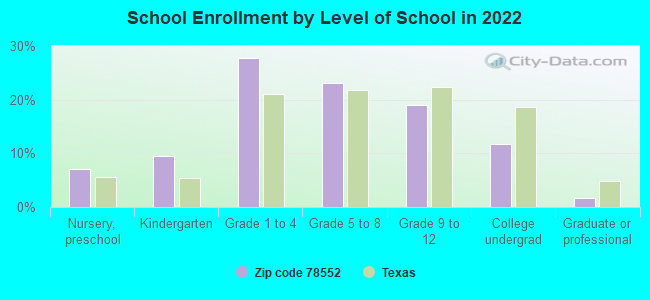
Private vs. public school enrollment:
Students in private schools in grades 1 to 8 (elementary and middle school): 148
Here:
2.6%
Texas:
8.8%
Students in private schools in grades 9 to 12 (high school): 86
Here:
4.1%
Texas:
8.0%
Students in private undergraduate colleges: 44
Here:
3.5%
Texas:
16.2%
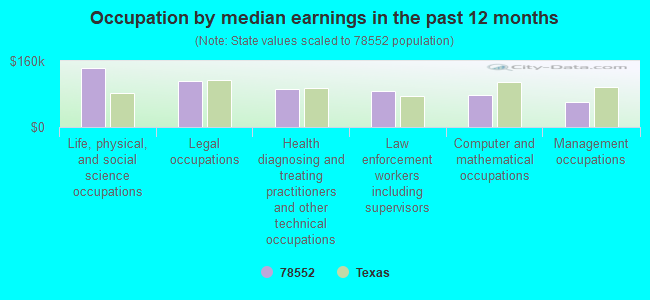
Occupation by median earnings in the past 12 months ($)
143,095Life, physical, and social science occupations
112,178Legal occupations
92,733Health diagnosing and treating practitioners and other technical occupations
88,308Law enforcement workers including supervisors
77,029Computer and mathematical occupations
60,603Management occupations
Companies with federal contracts located in this zip code (HARLINGEN, TX):
EARL O'CONNELL (1111 PALM VALLEY DR E; small business) : $469,000 in 8 contractsfrom 1999 to 2002
Contracts for Lease or Rental of Facilities -- Office Buildings by Public Buildings Service Signed by year:2000: $276,000; 2001: $69,000; 2002: $25,000; 2003: $0; 2004: $0; 2005: $0; 2006: $0.
Biggest contracts:
$69,000 with Public Buildings Service for Lease or Rental of Facilities -- Office Buildings. Signed on 2001-03-15. Completion date: 2001-03-15.
$69,000, same as above.Signed on 2000-12-15. Completion date: 2000-12-15.
$69,000, same as above.Signed on 2000-03-15. Completion date: 2000-03-15.
$69,000, same as above.Signed on 1999-12-15. Completion date: 1999-12-15.
JONES MOVING & STORAGE CO (2404 WILSON RD; small business) : $36,019 in 2 contractsfrom 1999 to 2005
$33,019 with Army for Packing/Crating Services. Signed on 2005-12-23. Completion date: 2006-05-31.
$3,000 with Public Buildings Service for Relocation Services. Signed on 1999-12-15. Completion date: 2000-01-15.
RIO GRANDE COUNCIL 775 (6912 W EXPRESSWAY 83)
$19,930 with Army for Food Services. Signed on 2005-06-01. Completion date: 2005-06-11.
LUCILLE PAYNE (5521 BAMBOO CIRCLE; small business) : $18,830 in 6 contractsfrom 2003 to 2004
Contracts for Operation of Government-Owned Facilities -- Recreation Facilities (Non-Building) by U.S. Army Corps of Engineers - civil program financing only, Army Signed by year:2000: $0; 2001: $0; 2002: $0; 2003: $6,510; 2004: $12,320; 2005: $0; 2006: $0.
Biggest contracts:
$6,510 with U.S. Army Corps of Engineers - civil program financing only for Operation of Government-Owned Facilities -- Recreation Facilities (Non-Building). Taking place in AR. Signed on 2003-04-06. Completion date: 2002-09-09.
$6,300, same as above.Signed on 2004-02-05. Completion date: 2002-09-09.
$6,300 with Army for Operation of Government-Owned Facilities -- Recreation Facilities (Non-Building). Taking place in AR. Signed on 2004-02-05. Completion date: 2002-09-09.
$0 with U.S. Army Corps of Engineers - civil program financing only for Operation of Government-Owned Facilities -- Recreation Facilities (Non-Building). Taking place in AR. Signed on 2003-04-06. Completion date: 2002-09-09.
PENAS ELECTRIC, INC (23899 WILCOX RD; small business) : $8,700 in 2 contractsfrom 2001 to 2003
$5,200 with Navy for Maintenance, Repair or Alteration of Real Property -- Miscellaneous Buildings. Signed on 2001-09-19. Completion date: 2001-10-19.
$3,500 with Navy for Maintenance, Repair or Alteration of Real Property -- Office Buildings. Signed on 2003-08-16. Completion date: 2003-09-30.
ALAMO DOOR SYSTEMS, INC (2821 W SPUR 54; small business)
$8,659 with Army for Maintenance, Repair and Rebuilding of Equipment -- Miscellaneous. Signed on 2006-03-20. Completion date: 2006-05-02.
CASA ENGINEERING LLC (1415 N STUART PLACE RD; small business)
$8,300 with Navy for Engineering and Technical Services. Signed on 2005-09-20. Completion date: 2005-10-20.
PROHASKA, JOAN (5507 BAMBOO CR; small business) : $3,300 in 2 contractsin 2003
$6,394 with U.S. Army Corps of Engineers - civil program financing only for Operation of Government-Owned Facilities -- Recreation Facilities (Non-Building). Taking place in AR. Signed on 2003-04-03. Completion date: 2003-09-08.
-$3,094, same as above.Signed on 2003-07-17. Completion date: 2003-09-08.
SAFEGUARD PEST CONTROL, INC (5402 S EXPRESSWAY 83; small business) : $960 in 2 contractsin 2002
$960 with Navy for Insect and Rodent Control Services. Signed on 2002-09-30. Completion date: 2002-09-22.
$0, same as above.Signed on 2002-09-30. Completion date: 2002-09-22.
JACOBSEN, ROBERT (7101 W BUSINESS 83 LOT 20; small business) : $0 in 2 contractsin 2006
$13,197 with Army for Custodial Janitorial Services. Taking place in IA. Signed on 2006-02-21. Completion date: 2007-04-19.
-$13,197, same as above.Signed on 2006-05-05. Completion date: 2007-04-19.
Top industries in this zip code by the number of employees in 2005:
Health Care and Social Assistance: Home Health Care Services (250-499 employees: 1 establishment, 100-249 employees: 1 establishment, 20-49 employees: 1 establishment)
2002 - 2018 National Fire Incident Reporting System (NFIRS) incidents
According to the data from the years 2002 - 2018 the average number of fires per year is 39. The highest number of fires - 108 took place in 2002, and the least - 0 in 2010. The data has a declining trend.
When looking into fire subcategories, the most incidents belonged to: Outside Fires (60.6%), and Structure Fires (17.5%).
Fire incident types reported to NFIRS in Zip Code 78552

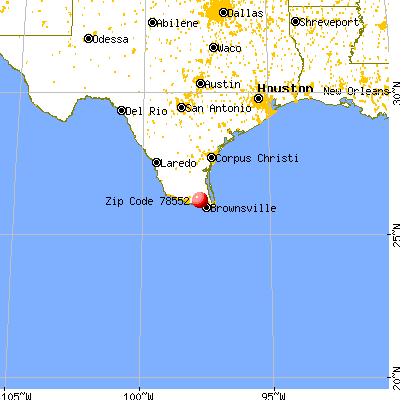


 Nearest zip codes: 78535, 78559, 78550, 78593, 78567, 78586.


 : $469,000 in 8 contracts from 1999 to 2002
 According to the data from the years 2002 - 2018 the average number of fires per year is 39. The highest number of fires - 108 took place in 2002, and the least - 0 in 2010. The data has a declining trend.
 When looking into fire subcategories, the most incidents belonged to: Outside Fires (60.6%), and Structure Fires (17.5%).