Estimated zip code population in 2022: 3,241 Zip code population in 2010: 2,868 Zip code population in 2000: 2,069
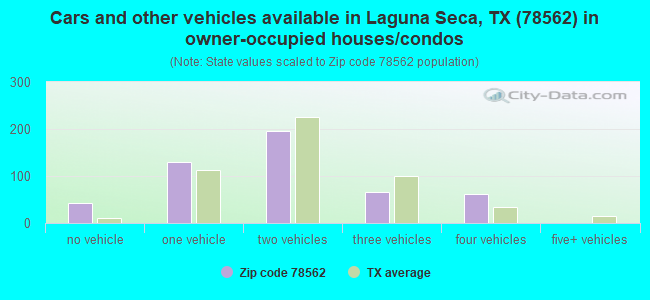
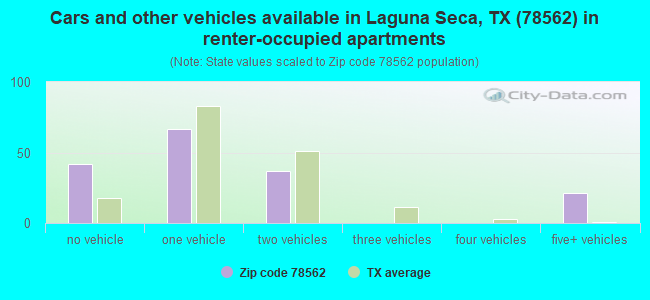
Houses and condos: 766 Renter-occupied apartments: 165
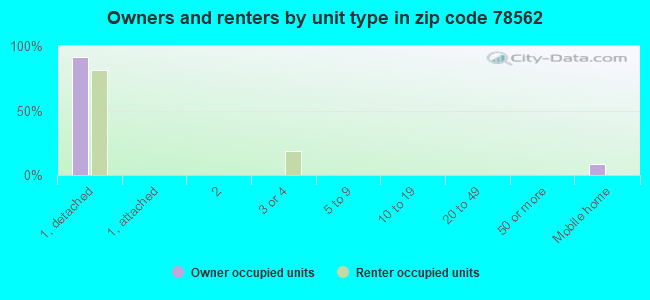
% of renters here:
25%
State:
38%
March 2022 cost of living index in zip code 78562: 79.3 (low, U.S. average is 100)
Land area: 25.3 sq. mi. Water area: 1.1 sq. mi.
Population density: 128 people per square mile
(very low).
OSM Map
General Map
Google Map
MSN Map
OSM Map
General Map
Google Map
MSN Map
OSM Map
General Map
Google Map
MSN Map
OSM Map
General Map
Google Map
MSN Map
Please wait while loading the map...
Real estate property taxes paid for housing units in 2022:
This zip code:
1.2% ($1,667)
Texas:
1.5% ($4,050)
Median real estate property taxes paid for housing units with mortgages in 2022: $3,277 (2.1%) Median real estate property taxes paid for housing units with no mortgage in 2022: $1,312 (1.2%)
Business Search- 14 Million verified businesses
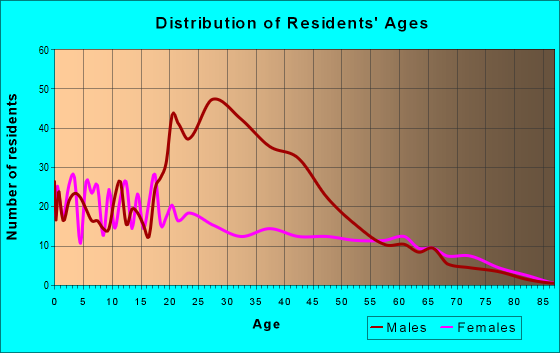
Males: 1,879
(58.0%)
Females: 1,362
(42.0%)
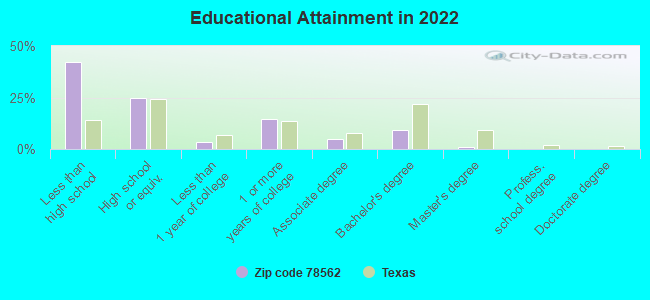
For population 25 years and over in 78562:
High school or higher: 55.3%
Bachelor's degree or higher: 9.8%
Graduate or professional degree: 0.9%
Unemployed: 1.8%
Mean travel time to work (commute): 22.7 minutes
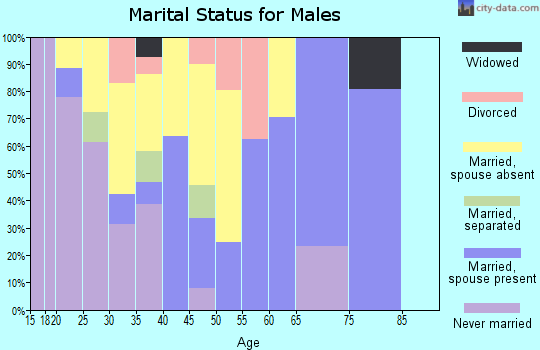
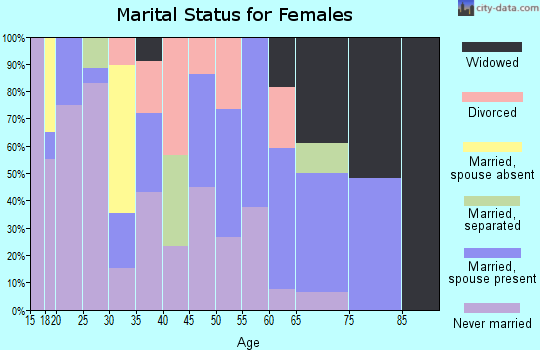
For population 15 years and over in 78562:
Never married: 47.0%
Now married: 37.0%
Separated: 0.7%
Widowed: 6.5%
Divorced: 8.9%
Zip code 78562 compared to state average:
Median house value below state average.
Unemployed percentage below state average.
Black race population percentage significantly below state average.
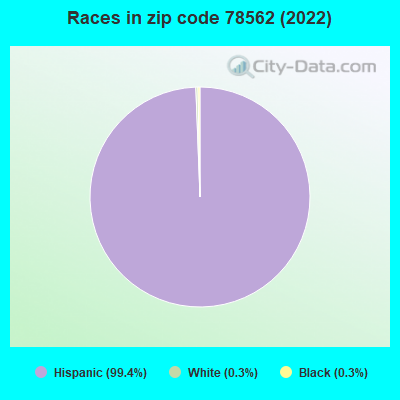
Hispanic race population percentage above state average.
Foreign-born population percentage above state average.
Length of stay since moving in significantly above state average.
Number of college students below state average.
Percentage of population with a bachelor's degree or higher significantly below state average.
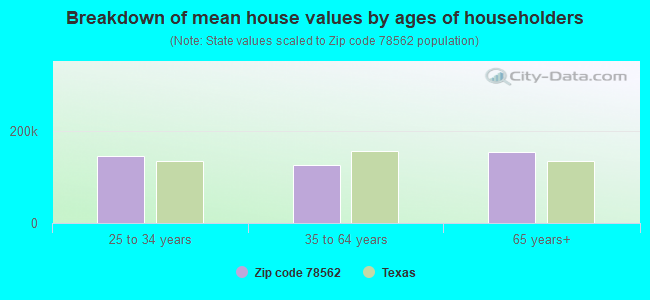
Estimated median house/condo value in 2022: $138,279
78562:
$138,279
Texas:
$275,400
According to our research of Texas and other state lists, there were 6 registered sex offenders living in 78562 zip code as of April 27, 2024. The ratio of all residents to sex offenders in zip code 78562 is 696 to 1. The ratio of registered sex offenders to all residents in this zip code is lower than the state average.
Median resident age:
This zip code:
32.2 years
Texas median age:
35.6 years
Average household size:
This zip code:
3.2 people
Texas:
2.6 people
Averages for the 2004 tax year for zip code 78562, filed in 2005:
Average Adjusted Gross Income (AGI) in 2004: $16,946 (Individual Income Tax Returns)
Here:
$16,946
State:
$47,881
Salary/wage: $16,639 (reported on 90.2% of returns)
Here:
$16,639
State:
$41,947
(% of AGI for various income ranges: 77.9% for AGIs below $10k, 88.0% for AGIs $10k-25k, 94.2% for AGIs $25k-50k, 82.3% for AGIs $50k-75k)
Taxable interest for individuals: $261 (reported on 5.4% of returns)
This zip code:
$261
Texas:
$2,255
Profit/loss from business: +$4,657 (reported on 23.4% of returns)
Here:
+$4,657
State:
+$11,013
Total itemized deductions: $17,400 (41% of AGI, reported on 3.0% of returns)
Here:
$17,400
State:
$19,631
Here:
41.0% of AGI
State:
18.9% of AGI
Charity contributions deductions: $2,000 (4% of AGI, reported on 2.0% of returns)
Here:
$2,000
State:
$4,753
Here:
4.3% of AGI
State:
4.2% of AGI
Total tax: $1,301 (reported on 43.3% of returns)
78562:
$1,301
State:
$9,058
(% of AGI for various income ranges: 4.1% for AGIs below $10k, 2.5% for AGIs $10k-25k, 3.9% for AGIs $25k-50k, 5.9% for AGIs $50k-75k)
Earned income credit: $2,641 (reported on 70.5% of returns)
Here:
$2,641
State:
$2,024
Percentage of individuals using paid preparers for their 2004 taxes: 65.6%
Here:
66%
State:
57%
(% for various income ranges: 59.7% for AGIs below $10k, 69.2% for AGIs $10k-25k, 63.6% for AGIs $25k-50k, 61.1% for AGIs $50k-75k)
Household received Food Stamps/SNAP in the past 12 months: 173 Household did not receive Food Stamps/SNAP in the past 12 months: 490
Women who did not have a birth in the past 12 months: 767 (263 now married, 506 unmarried)
Housing units in zip code 78562 with a mortgage: 175 Median monthly owner costs for units with a mortgage: $1,152 Median monthly owner costs for units without a mortgage: $444
Residents with income below the poverty level in 2022:
This zip code:
23.8%
Whole state:
14.0%
Residents with income below 50% of the poverty level in 2022:
This zip code:
5.1%
Whole state:
7.4%
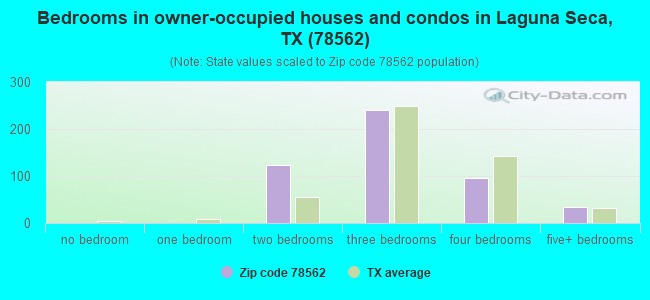
Median number of rooms in houses and condos:
Here:
5.3
State:
6.3
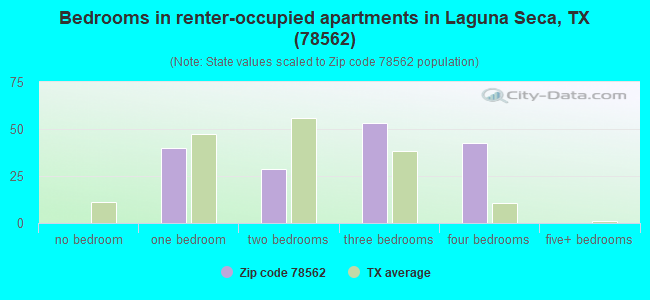
Median number of rooms in apartments:
Here:
4.8
State:
4.0
Notable locations in this zip code not listed on our city pages
In group quarters: 1,116 (-1 institutionalized population)
Size of family households: 29 2-persons, 89 3-persons, 120 4-persons, 30 5-persons, 40 6-persons, 57 7-or-more-persons
Size of nonfamily households: 262 1-person, 28 2-persons
328 married couples with children.
198 single-parent households (49 men, 149 women).
8.4% of residents of 78562 zip code speak English at home.
91.1% of residents speak Spanish at home (57% very well, 17% well, 12% not well, 14% not at all).
0.2% of residents speak other language at home (100% not at all).
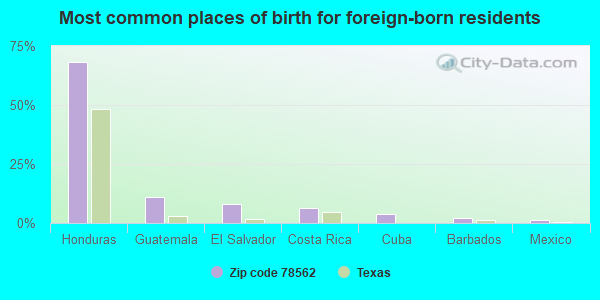
Foreign born population: 983 (30.3%) (10.8% of them are naturalized citizens)
This zip code:
30.3%
Whole state:
17.2%
68%Honduras
11%Guatemala
8%El Salvador
6%Costa Rica
4%Cuba
2%Barbados
1%Mexico
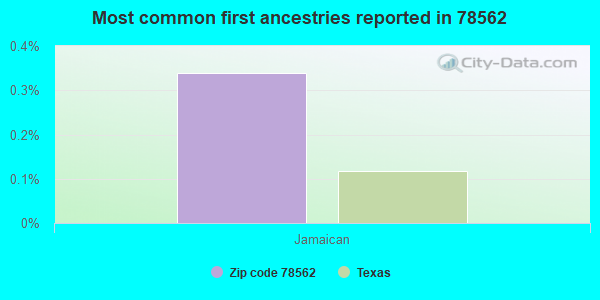
0%Jamaican
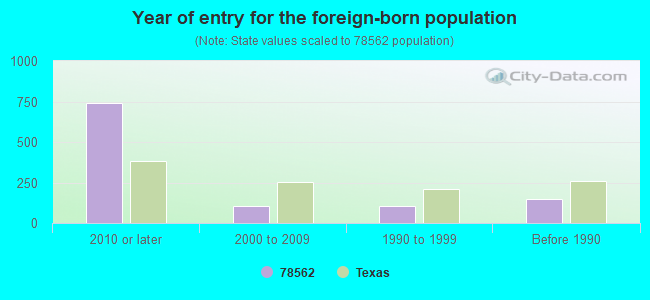
Year of entry for the foreign-born population
7422010 or later
1072000 to 2009
1051990 to 1999
151Before 1990
Housing units lacking complete plumbing facilities: 6.7% Housing units lacking complete kitchen facilities: 4.5%
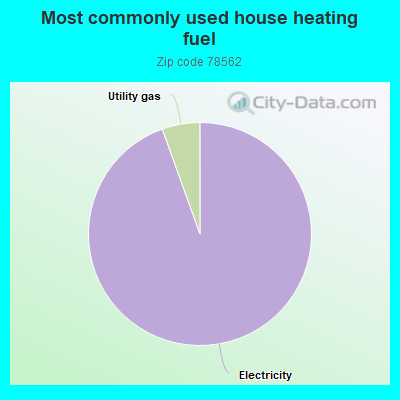
94.8%Electricity
5.5%Utility gas
Place of birth for U.S.-born residents:
This state: 2,069
Northeast: 10
Midwest: 61
South: 32
West: 32
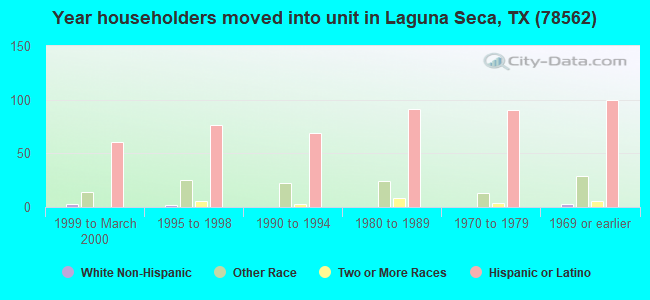
81% of the 78562 zip code residents lived in the same house 5 years ago. Out of people who lived in different houses, 90% lived in this county. Out of people who lived in different counties, 50% lived in Texas.
57% of the 78562 zip code residents lived in the same house 1 year ago. Out of people who lived in different houses, 23% moved from this county. Out of people who lived in different houses, 15% moved from different county within same state. Out of people who lived in different houses, 9% moved from different state. Out of people who lived in different houses, 59% moved from abroad.
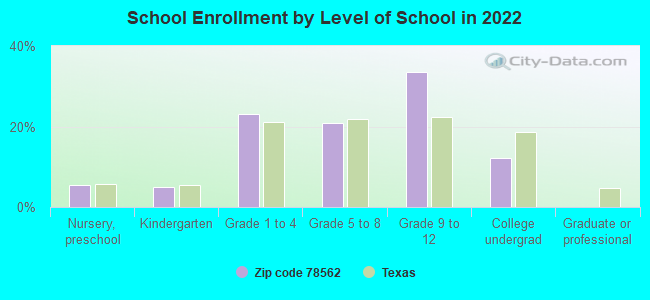
Private vs. public school enrollment:
Students in private schools in grades 1 to 8 (elementary and middle school):
Here:
0.0%
Texas:
8.8%
Students in private schools in grades 9 to 12 (high school):
Here:
0.0%
Texas:
8.0%
Students in private undergraduate colleges:
Here:
0.0%
Texas:
16.2%
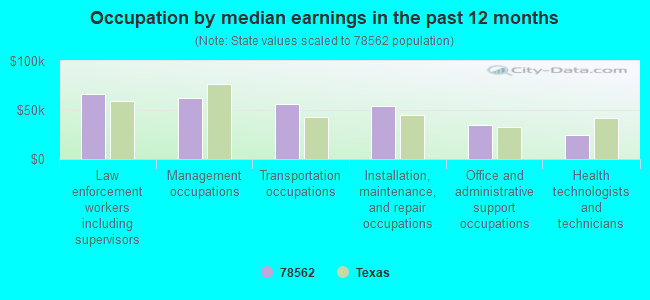
Occupation by median earnings in the past 12 months ($)
66,551Law enforcement workers including supervisors
62,221Management occupations
56,181Transportation occupations
54,410Installation, maintenance, and repair occupations
34,291Office and administrative support occupations
24,426Health technologists and technicians
Companies with federal contracts located in this zip code:
TEXCON MANAGEMENT GROUP, INC. (1300 N HWY 107 in LA VILLA, TX) : $500,000 in 5 contractsin 2000
Contracts for Other Housekeeping Services by U.S. Marshals Service Signed by year:2000: $500,000; 2001: $0; 2002: $0; 2003: $0; 2004: $0; 2005: $0; 2006: $0.
Biggest contracts:
$100,000 with U.S. Marshals Service for Other Housekeeping Services. Signed on 2000-06-15. Completion date: 2000-09-15.
$100,000, same as above.Signed on 2000-08-15. Completion date: 2000-09-15.
$100,000, same as above.Signed on 2000-07-15. Completion date: 2000-09-15.
$100,000, same as above.Signed on 2000-08-15. Completion date: 2000-09-15.
Top industries in this zip code by the number of employees in 2005:
Accommodation and Food Services: Full-Service Restaurants (10-19 employees: 1 establishment)
Administrative and Support and Waste Management and Remediation Services: Office Administrative Services (10-19: 1)
People in group quarters in 2010:
783 people in local jails and other municipal confinement facilities
Fatal accident statistics in 2010:
Fatal accident count: 1
Vehicles involved in fatal accidents: 1
Fatal accidents caused by drunken drivers: 1
Fatalities: 1
Persons involved in fatal accidents: 2
Pedestrians involved in fatal accidents: 0
Home Mortgage Disclosure Act Aggregated Statistics For Year 2009 (Based on 2 partial tracts)
A) FHA, FSA/RHS & VA Home Purchase Loans
B) Conventional Home Purchase Loans
C) Refinancings
D) Home Improvement Loans
Number
Average Value
Number
Average Value
Number
Average Value
Number
Average Value
LOANS ORIGINATED
1
$89,560
1
$40,430
2
$101,850
1
$14,840
APPLICATIONS APPROVED, NOT ACCEPTED
0
$0
0
$0
1
$33,610
0
$0
APPLICATIONS DENIED
0
$0
0
$0
2
$85,130
2
$34,120
APPLICATIONS WITHDRAWN
0
$0
0
$0
0
$0
0
$0
FILES CLOSED FOR INCOMPLETENESS
0
$0
0
$0
1
$44,530
0
$0
Aggregated Statistics For Year 2008 (Based on 2 partial tracts)
A) FHA, FSA/RHS & VA Home Purchase Loans
B) Conventional Home Purchase Loans
C) Refinancings
D) Home Improvement Loans
F) Non-occupant Loans on < 5 Family Dwellings (A B C & D)
G) Loans On Manufactured Home Dwelling (A B C & D)
Number
Average Value
Number
Average Value
Number
Average Value
Number
Average Value
Number
Average Value
Number
Average Value
LOANS ORIGINATED
1
$43,330
1
$104,070
2
$91,695
1
$22,860
1
$19,960
0
$0
APPLICATIONS APPROVED, NOT ACCEPTED
0
$0
0
$0
2
$57,150
0
$0
0
$0
0
$0
APPLICATIONS DENIED
0
$0
1
$76,430
4
$68,625
3
$18,710
0
$0
1
$12,970
APPLICATIONS WITHDRAWN
0
$0
1
$33,440
1
$148,590
0
$0
0
$0
0
$0
FILES CLOSED FOR INCOMPLETENESS
0
$0
0
$0
0
$0
0
$0
0
$0
0
$0
Aggregated Statistics For Year 2007 (Based on 2 partial tracts)
B) Conventional Home Purchase Loans
C) Refinancings
D) Home Improvement Loans
F) Non-occupant Loans on < 5 Family Dwellings (A B C & D)
Number
Average Value
Number
Average Value
Number
Average Value
Number
Average Value
LOANS ORIGINATED
3
$115,780
4
$88,585
3
$27,693
1
$94,850
APPLICATIONS APPROVED, NOT ACCEPTED
1
$15,520
1
$95,370
1
$16,380
0
$0
APPLICATIONS DENIED
3
$131,247
7
$83,911
5
$27,432
0
$0
APPLICATIONS WITHDRAWN
1
$76,600
2
$81,715
1
$15,870
0
$0
FILES CLOSED FOR INCOMPLETENESS
0
$0
1
$14,330
0
$0
0
$0
Aggregated Statistics For Year 2006 (Based on 2 partial tracts)
B) Conventional Home Purchase Loans
C) Refinancings
D) Home Improvement Loans
F) Non-occupant Loans on < 5 Family Dwellings (A B C & D)
G) Loans On Manufactured Home Dwelling (A B C & D)
Number
Average Value
Number
Average Value
Number
Average Value
Number
Average Value
Number
Average Value
LOANS ORIGINATED
2
$106,625
6
$107,535
1
$27,810
1
$65,340
0
$0
APPLICATIONS APPROVED, NOT ACCEPTED
2
$67,215
1
$172,820
0
$0
0
$0
0
$0
APPLICATIONS DENIED
5
$67,626
7
$67,339
3
$20,587
1
$45,380
1
$28,150
APPLICATIONS WITHDRAWN
2
$78,305
1
$116,690
1
$25,080
0
$0
0
$0
FILES CLOSED FOR INCOMPLETENESS
0
$0
1
$88,710
0
$0
0
$0
0
$0
Aggregated Statistics For Year 2005 (Based on 2 partial tracts)
A) FHA, FSA/RHS & VA Home Purchase Loans
B) Conventional Home Purchase Loans
C) Refinancings
D) Home Improvement Loans
F) Non-occupant Loans on < 5 Family Dwellings (A B C & D)
G) Loans On Manufactured Home Dwelling (A B C & D)
Number
Average Value
Number
Average Value
Number
Average Value
Number
Average Value
Number
Average Value
Number
Average Value
LOANS ORIGINATED
2
$51,520
5
$64,930
5
$71,038
1
$29,850
1
$47,940
1
$25,250
APPLICATIONS APPROVED, NOT ACCEPTED
0
$0
1
$63,630
2
$50,070
1
$29,340
0
$0
1
$10,580
APPLICATIONS DENIED
1
$55,270
3
$64,090
8
$63,208
3
$33,723
1
$49,990
1
$29,000
APPLICATIONS WITHDRAWN
0
$0
1
$103,040
4
$75,192
0
$0
0
$0
0
$0
FILES CLOSED FOR INCOMPLETENESS
0
$0
0
$0
1
$88,370
0
$0
0
$0
0
$0
Aggregated Statistics For Year 2004 (Based on 2 partial tracts)
A) FHA, FSA/RHS & VA Home Purchase Loans
B) Conventional Home Purchase Loans
C) Refinancings
D) Home Improvement Loans
F) Non-occupant Loans on < 5 Family Dwellings (A B C & D)
G) Loans On Manufactured Home Dwelling (A B C & D)
Number
Average Value
Number
Average Value
Number
Average Value
Number
Average Value
Number
Average Value
Number
Average Value
LOANS ORIGINATED
1
$61,590
4
$68,538
6
$60,392
1
$37,020
1
$27,980
1
$16,720
APPLICATIONS APPROVED, NOT ACCEPTED
0
$0
0
$0
2
$39,580
1
$11,770
0
$0
0
$0
APPLICATIONS DENIED
0
$0
5
$56,742
7
$47,354
4
$17,912
1
$74,380
1
$28,490
APPLICATIONS WITHDRAWN
0
$0
1
$130,850
4
$64,955
0
$0
0
$0
0
$0
FILES CLOSED FOR INCOMPLETENESS
0
$0
0
$0
0
$0
0
$0
0
$0
0
$0
Aggregated Statistics For Year 2003 (Based on 2 partial tracts)
B) Conventional Home Purchase Loans
C) Refinancings
D) Home Improvement Loans
F) Non-occupant Loans on < 5 Family Dwellings (A B C & D)
Number
Average Value
Number
Average Value
Number
Average Value
Number
Average Value
LOANS ORIGINATED
2
$96,560
5
$62,986
1
$19,110
0
$0
APPLICATIONS APPROVED, NOT ACCEPTED
1
$33,610
3
$50,727
0
$0
0
$0
APPLICATIONS DENIED
2
$31,900
9
$54,440
6
$12,340
1
$30,710
APPLICATIONS WITHDRAWN
1
$62,270
2
$61,075
0
$0
1
$40,260
FILES CLOSED FOR INCOMPLETENESS
0
$0
0
$0
0
$0
0
$0
Aggregated Statistics For Year 2002 (Based on 2 partial tracts)
B) Conventional Home Purchase Loans
C) Refinancings
D) Home Improvement Loans
Number
Average Value
Number
Average Value
Number
Average Value
LOANS ORIGINATED
3
$62,100
3
$56,867
2
$8,445
APPLICATIONS APPROVED, NOT ACCEPTED
1
$42,480
1
$36,510
0
$0
APPLICATIONS DENIED
3
$49,360
4
$38,855
5
$8,768
APPLICATIONS WITHDRAWN
1
$25,590
1
$60,730
0
$0
FILES CLOSED FOR INCOMPLETENESS
0
$0
1
$70,800
0
$0
Aggregated Statistics For Year 2001 (Based on 2 partial tracts)
A) FHA, FSA/RHS & VA Home Purchase Loans
B) Conventional Home Purchase Loans
C) Refinancings
D) Home Improvement Loans
F) Non-occupant Loans on < 5 Family Dwellings (A B C & D)
Number
Average Value
Number
Average Value
Number
Average Value
Number
Average Value
Number
Average Value
LOANS ORIGINATED
1
$40,430
5
$30,844
4
$56,682
6
$3,042
1
$19,790
APPLICATIONS APPROVED, NOT ACCEPTED
0
$0
3
$33,780
2
$27,125
0
$0
0
$0
APPLICATIONS DENIED
0
$0
5
$33,916
6
$41,825
4
$9,810
1
$31,050
APPLICATIONS WITHDRAWN
0
$0
0
$0
2
$38,810
1
$8,870
0
$0
FILES CLOSED FOR INCOMPLETENESS
0
$0
0
$0
1
$59,030
0
$0
0
$0
Aggregated Statistics For Year 2000 (Based on 2 partial tracts)
A) FHA, FSA/RHS & VA Home Purchase Loans
B) Conventional Home Purchase Loans
C) Refinancings
D) Home Improvement Loans
F) Non-occupant Loans on < 5 Family Dwellings (A B C & D)
Number
Average Value
Number
Average Value
Number
Average Value
Number
Average Value
Number
Average Value
LOANS ORIGINATED
0
$0
1
$51,860
3
$73,983
7
$5,240
0
$0
APPLICATIONS APPROVED, NOT ACCEPTED
1
$38,380
1
$48,620
1
$24,910
0
$0
0
$0
APPLICATIONS DENIED
0
$0
9
$30,898
3
$39,863
4
$10,022
1
$18,250
APPLICATIONS WITHDRAWN
0
$0
1
$14,670
1
$73,360
0
$0
0
$0
FILES CLOSED FOR INCOMPLETENESS
0
$0
0
$0
1
$26,950
0
$0
0
$0
Aggregated Statistics For Year 1999 (Based on 1 partial tract)
B) Conventional Home Purchase Loans
C) Refinancings
D) Home Improvement Loans
F) Non-occupant Loans on < 5 Family Dwellings (A B C & D)
Detailed PMIC statistics for the following Tracts:0246.00
2003 - 2016 National Fire Incident Reporting System (NFIRS) incidents
According to the data from the years 2003 - 2016 the average number of fire incidents per year is 27. The highest number of fire incidents - 70 took place in 2005, and the least - 0 in 2012. The data has a rising trend.
When looking into fire subcategories, the most incidents belonged to: Outside Fires (78.8%), and Structure Fires (12.2%).
Fire incident types reported to NFIRS in Zip Code 78562


 Nearest zip codes: 78593, 78543, 78538, 78594, 78570, 78558.
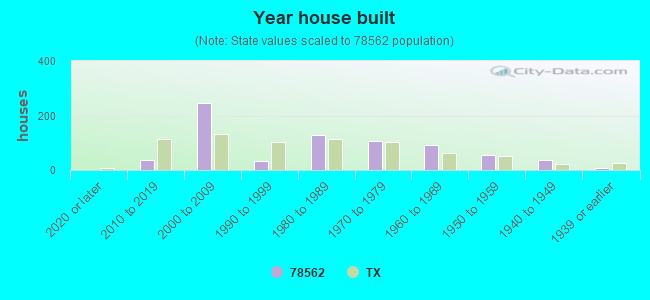


 : $500,000 in 5 contracts in 2000
 According to the data from the years 2003 - 2016 the average number of fire incidents per year is 27. The highest number of fire incidents - 70 took place in 2005, and the least - 0 in 2012. The data has a rising trend.
 When looking into fire subcategories, the most incidents belonged to: Outside Fires (78.8%), and Structure Fires (12.2%).