Estimated zip code population in 2022: 10,362 Zip code population in 2010: 10,657 Zip code population in 2000: 7,447
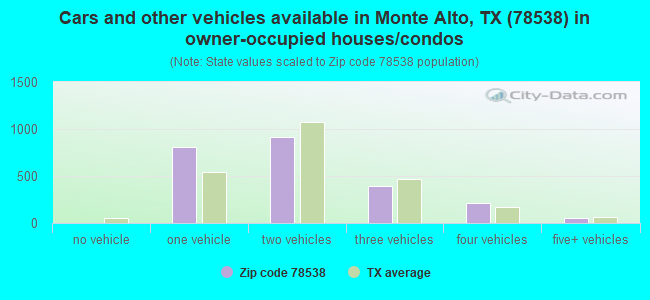
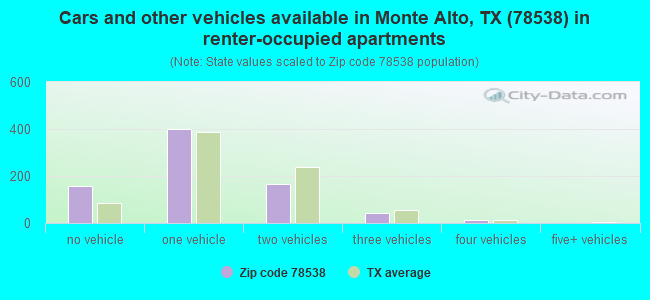
Houses and condos: 3,608 Renter-occupied apartments: 777
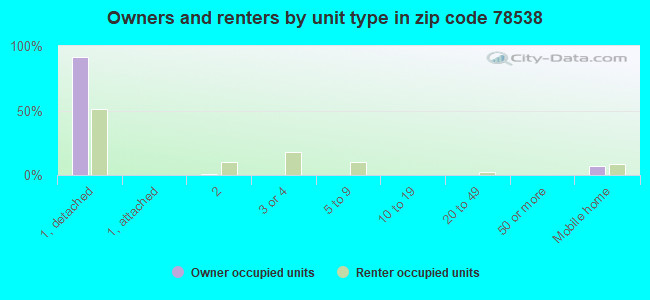
% of renters here:
25%
State:
38%
March 2022 cost of living index in zip code 78538: 77.4 (low, U.S. average is 100)
Land area: 71.0 sq. mi. Water area: 3.8 sq. mi.
Population density: 146 people per square mile
(very low).
OSM Map
General Map
Google Map
MSN Map
OSM Map
General Map
Google Map
MSN Map
OSM Map
General Map
Google Map
MSN Map
OSM Map
General Map
Google Map
MSN Map
Please wait while loading the map...
Real estate property taxes paid for housing units in 2022:
This zip code:
1.3% ($1,223)
Texas:
1.5% ($4,050)
Median real estate property taxes paid for housing units with mortgages in 2022: $1,890 (1.6%) Median real estate property taxes paid for housing units with no mortgage in 2022: $1,056 (1.5%)
Business Search- 14 Million verified businesses
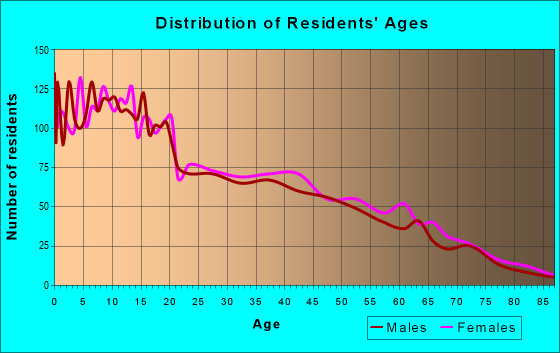
Males: 5,248
(50.7%)
Females: 5,113
(49.3%)
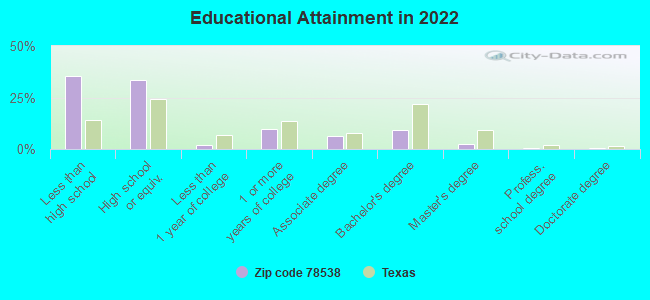
For population 25 years and over in 78538:
High school or higher: 62.1%
Bachelor's degree or higher: 12.4%
Graduate or professional degree: 3.5%
Unemployed: 7.9%
Mean travel time to work (commute): 22.7 minutes
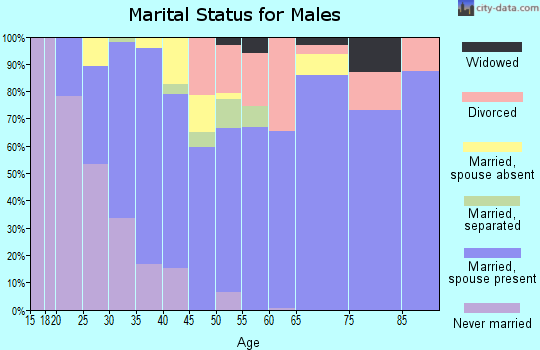
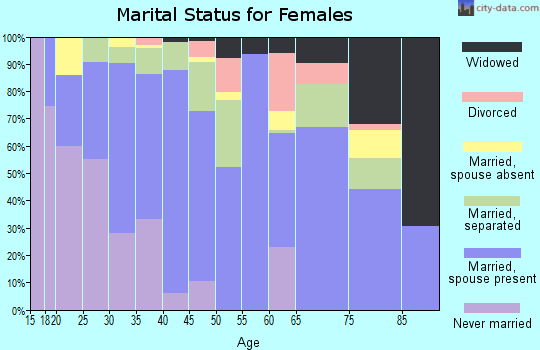
For population 15 years and over in 78538:
Never married: 39.4%
Now married: 45.5%
Separated: 2.5%
Widowed: 5.9%
Divorced: 6.7%
Zip code 78538 compared to state average:
Median household income below state average.
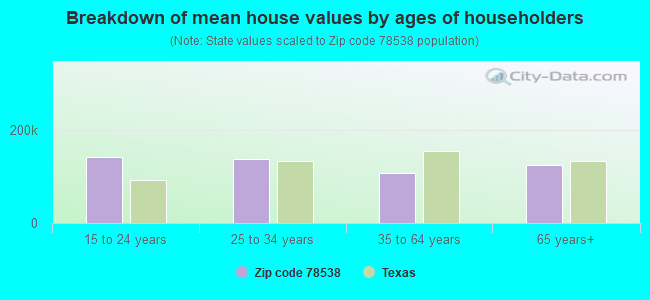
Median house value significantly below state average.
Unemployed percentage above state average.
Black race population percentage significantly below state average.
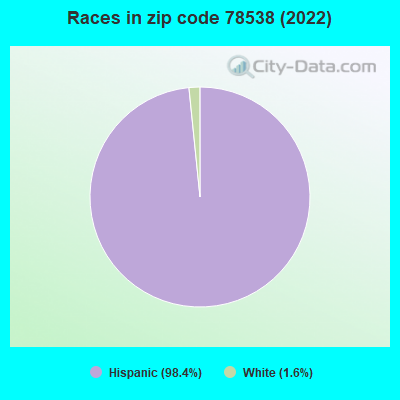
Hispanic race population percentage above state average.
Renting percentage below state average.
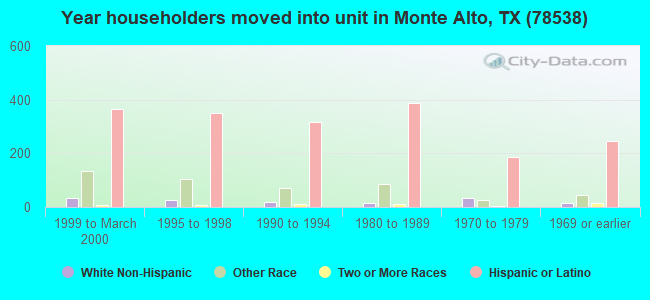
Length of stay since moving in significantly above state average.
Percentage of population with a bachelor's degree or higher significantly below state average.
Averages for the 2020 tax year for zip code 78538, filed in 2021:
Average Adjusted Gross Income (AGI) in 2020: $31,488 (Individual Income Tax Returns)
Here:
$31,488
State:
$77,054
Salary/wage: $30,596 (reported on 85.4% of returns)
Here:
$30,596
State:
$62,766
(% of AGI for various income ranges: 1255.9% for AGIs below $25k, 3485.4% for AGIs $25k-50k, 6078.8% for AGIs $50k-75k, 10292.1% for AGIs $75k-100k, 16698.3% for AGIs $100k-200k)
Taxable interest for individuals: $836 (reported on 6.6% of returns)
This zip code:
$836
Texas:
$2,665
(% of AGI for various income ranges: 2.1% for AGIs below $25k, 2.2% for AGIs $25k-50k, 28.7% for AGIs $50k-75k, 44.3% for AGIs $75k-100k, 20.0% for AGIs $100k-200k)
Ordinary dividends: $1,889 (reported on 1.8% of returns)
Here:
$1,889
State:
$10,044
(% of AGI for various income ranges: 3.6% for AGIs below $25k, 14.0% for AGIs $50k-75k, 25.8% for AGIs $100k-200k)
Net capital gain/loss in AGI: +$2,978 (reported on 1.8% of returns)
Here:
+$2,978
State:
+$39,590
(% of AGI for various income ranges: 6.4% for AGIs $25k-50k, 16.5% for AGIs $50k-75k, 102.5% for AGIs $100k-200k)
Profit/loss from business: +$2,554 (reported on 27.2% of returns)
Here:
+$2,554
State:
+$10,888
(% of AGI for various income ranges: 186.6% for AGIs below $25k, 205.0% for AGIs $100k-200k)
Taxable individual retirement arrangement distribution: $12,000 (reported on 2.2% of returns)
78538:
$12,000
Texas:
$24,740
(% of AGI for various income ranges: 5.5% for AGIs below $25k, 26.3% for AGIs $25k-50k, 83.2% for AGIs $50k-75k, 384.3% for AGIs $75k-100k)
Total itemized deductions: $25,308 (reported on 2.4% of returns)
Here:
$25,308
State:
$40,428
(% of AGI for various income ranges: 95.0% for AGIs $25k-50k, 175.5% for AGIs $50k-75k, 832.9% for AGIs $75k-100k)
Charity contributions: $5,500 (reported on 1.6% of returns)
Here:
$5,500
State:
$18,201
(% of AGI for various income ranges: 18.3% for AGIs $25k-50k, 153.6% for AGIs $75k-100k)
Taxes paid: $7,190 (reported on 2.0% of returns)
78538:
$7,190
State:
$7,821
(% of AGI for various income ranges: 19.0% for AGIs $25k-50k, 55.2% for AGIs $50k-75k, 188.6% for AGIs $75k-100k)
Earned income credit: $3,346 (reported on 46.2% of returns)
Here:
$3,346
State:
$2,584
(% of AGI for various income ranges: 253.5% for AGIs below $25k, 151.0% for AGIs $25k-50k, 4.2% for AGIs $50k-75k)
Percentage of individuals using paid preparers for their 2020 taxes: 91.8%
Here:
92%
State:
92%
(% for various income ranges: 90.5% for AGIs below $25k, 93.0% for AGIs $25k-50k, 95.8% for AGIs $50k-75k, 89.5% for AGIs $75k-100k, 94.1% for AGIs $100k-200k)
Averages for the 2012 tax year for zip code 78538, filed in 2013:
Average Adjusted Gross Income (AGI) in 2012: $26,514 (Individual Income Tax Returns)
Here:
$26,514
State:
$65,384
Salary/wage: $25,086 (reported on 87.8% of returns)
Here:
$25,086
State:
$52,524
(% of AGI for various income ranges: 77.8% for AGIs below $25k, 92.7% for AGIs $25k-50k, 85.7% for AGIs $50k-75k, 89.3% for AGIs $75k-100k, 67.4% for AGIs $100k-200k)
Taxable interest for individuals: $911 (reported on 7.3% of returns)
This zip code:
$911
Texas:
$2,372
(% of AGI for various income ranges: 0.2% for AGIs below $25k, 0.8% for AGIs $50k-75k, 0.4% for AGIs $100k-200k)
Ordinary dividends: $1,733 (reported on 1.6% of returns)
Here:
$1,733
State:
$9,721
Net capital gain/loss in AGI: +$720 (reported on 1.4% of returns)
Here:
+$720
State:
+$35,319
Profit/loss from business: +$6,200 (reported on 24.5% of returns)
Here:
+$6,200
State:
+$13,732
(% of AGI for various income ranges: 16.6% for AGIs below $25k, 0.3% for AGIs $25k-50k, 0.6% for AGIs $50k-75k)
Taxable individual retirement arrangement distribution: $11,083 (reported on 1.6% of returns)
78538:
$11,083
Texas:
$19,511
Total itemized deductions: $20,077 (32% of AGI, reported on 10.6% of returns)
Here:
$20,077
State:
$24,724
Here:
32.3% of AGI
State:
15.9% of AGI
(% of AGI for various income ranges: 1.4% for AGIs below $25k, 9.5% for AGIs $25k-50k, 16.1% for AGIs $50k-75k, 12.6% for AGIs $75k-100k, 9.9% for AGIs $100k-200k)
Charity contributions: $2,746 (reported on 7.1% of returns)
Here:
$2,746
State:
$6,808
(% of AGI for various income ranges: 1.0% for AGIs $25k-50k, 1.0% for AGIs $50k-75k, 1.5% for AGIs $75k-100k, 1.3% for AGIs $100k-200k)
Taxes paid: $3,672 (reported on 9.8% of returns)
78538:
$3,672
State:
$6,921
(% of AGI for various income ranges: 0.2% for AGIs below $25k, 1.3% for AGIs $25k-50k, 2.7% for AGIs $50k-75k, 2.5% for AGIs $75k-100k, 2.4% for AGIs $100k-200k)
Earned income credit: $3,320 (reported on 57.1% of returns)
Here:
$3,320
State:
$2,570
(% of AGI for various income ranges: 18.0% for AGIs below $25k, 3.3% for AGIs $25k-50k)
Percentage of individuals using paid preparers for their 2012 taxes: 59.2%
Here:
59%
State:
51%
(% for various income ranges: 58.5% for AGIs below $25k, 57.1% for AGIs $25k-50k, 68.0% for AGIs $50k-75k, 55.6% for AGIs $75k-100k, 77.8% for AGIs $100k-200k)
Averages for the 2004 tax year for zip code 78538, filed in 2005:
Average Adjusted Gross Income (AGI) in 2004: $19,308 (Individual Income Tax Returns)
Here:
$19,308
State:
$47,881
Salary/wage: $18,361 (reported on 90.3% of returns)
Here:
$18,361
State:
$41,947
(% of AGI for various income ranges: 88.1% for AGIs below $10k, 87.3% for AGIs $10k-25k, 91.8% for AGIs $25k-50k, 83.2% for AGIs $50k-75k, 83.9% for AGIs $75k-100k, 39.6% for AGIs over 100k)
Taxable interest for individuals: $1,744 (reported on 9.3% of returns)
This zip code:
$1,744
Texas:
$2,255
(% of AGI for various income ranges: 1.2% for AGIs below $10k, 0.5% for AGIs $10k-25k, 1.0% for AGIs $25k-50k, 0.7% for AGIs $50k-75k, 0.3% for AGIs $75k-100k, 3.3% for AGIs over 100k)
Taxable dividends: $1,209 (reported on 2.3% of returns)
Here:
$1,209
State:
$4,261
(% of AGI for various income ranges: 0.2% for AGIs $10k-25k, 0.2% for AGIs $25k-50k, 0.1% for AGIs $50k-75k, 0.2% for AGIs $75k-100k)
Net capital gain/loss: +$3,391 (reported on 2.2% of returns)
Here:
+$3,391
State:
+$16,110
(% of AGI for various income ranges: 0.0% for AGIs below $10k, 0.0% for AGIs $10k-25k, 0.4% for AGIs $50k-75k, 5.8% for AGIs $75k-100k)
Profit/loss from business: +$5,213 (reported on 17.7% of returns)
Here:
+$5,213
State:
+$11,013
(% of AGI for various income ranges: 20.1% for AGIs below $10k, 7.7% for AGIs $10k-25k, -0.4% for AGIs $25k-50k, 1.4% for AGIs $50k-75k, 2.5% for AGIs $75k-100k)
Profit/loss from farming: +$258 (reported on 1.0% of returns)
Here:
+$258
State:
-$9,403
IRA payment deduction: $2,800 (reported on 0.3% of returns)
78538:
$2,800
Texas:
$3,120
Total itemized deductions: $17,804 (36% of AGI, reported on 5.2% of returns)
Here:
$17,804
State:
$19,631
Here:
36.4% of AGI
State:
18.9% of AGI
(% of AGI for various income ranges: 1.3% for AGIs $10k-25k, 7.7% for AGIs $25k-50k, 7.0% for AGIs $50k-75k, 18.6% for AGIs $75k-100k)
Charity contributions deductions: $2,200 (4% of AGI, reported on 4.0% of returns)
Here:
$2,200
State:
$4,753
Here:
4.3% of AGI
State:
4.2% of AGI
(% of AGI for various income ranges: 0.1% for AGIs $10k-25k, 0.6% for AGIs $25k-50k, 0.9% for AGIs $50k-75k, 2.3% for AGIs $75k-100k)
Total tax: $2,120 (reported on 43.6% of returns)
78538:
$2,120
State:
$9,058
(% of AGI for various income ranges: 3.4% for AGIs below $10k, 2.3% for AGIs $10k-25k, 3.8% for AGIs $25k-50k, 8.3% for AGIs $50k-75k, 11.6% for AGIs $75k-100k, 16.8% for AGIs over 100k)
Earned income credit: $2,546 (reported on 63.4% of returns)
Here:
$2,546
State:
$2,024
Percentage of individuals using paid preparers for their 2004 taxes: 64.9%
Here:
65%
State:
57%
(% for various income ranges: 60.7% for AGIs below $10k, 70.1% for AGIs $10k-25k, 59.6% for AGIs $25k-50k, 57.1% for AGIs $50k-75k, 58.3% for AGIs $75k-100k, 76.5% for AGIs over 100k)
Household received Food Stamps/SNAP in the past 12 months: 1,374 Household did not receive Food Stamps/SNAP in the past 12 months: 1,815
Women who had a birth in the past 12 months: 239 (62 now married, 171 unmarried) Women who did not have a birth in the past 12 months: 2,267 (866 now married, 1,404 unmarried)
Housing units in zip code 78538 with a mortgage: 691 Median monthly owner costs for units with a mortgage: $1,243 Median monthly owner costs for units without a mortgage: $377
Residents with income below the poverty level in 2022:
This zip code:
33.7%
Whole state:
14.0%
Residents with income below 50% of the poverty level in 2022:
This zip code:
22.5%
Whole state:
7.4%
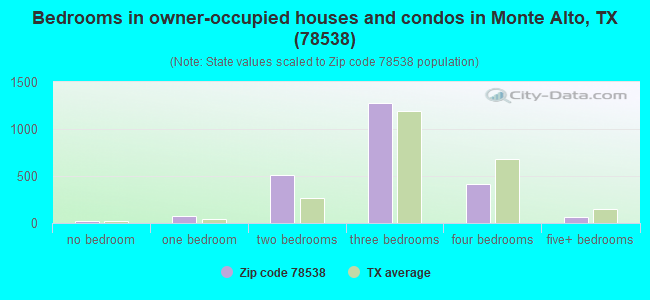
Median number of rooms in houses and condos:
Here:
5.2
State:
6.3
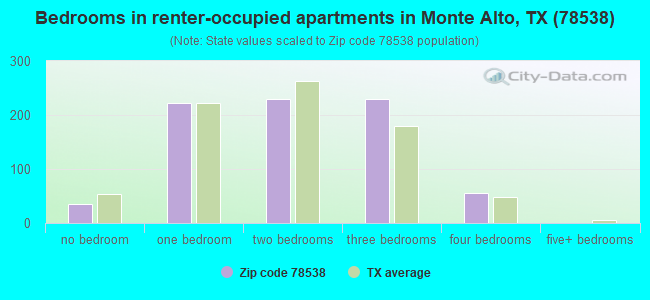
Median number of rooms in apartments:
Here:
3.9
State:
4.0
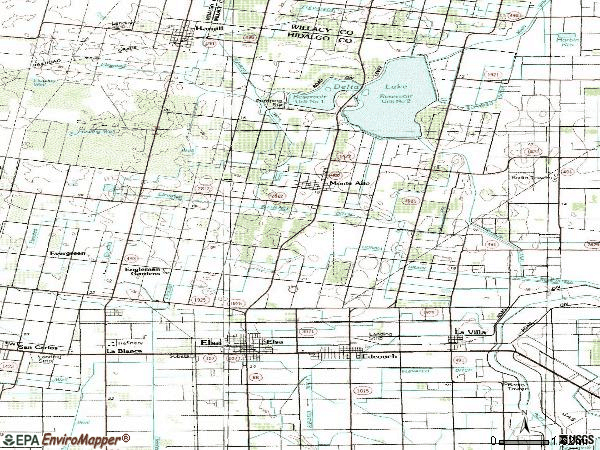
Notable locations in this zip code not listed on our city pages
Reservoirs: Unit Number Two (A), Unit Number One (B), Delta Lake (C), Delta Lake 2 (D), Delta Lake 1 (E), Engelman Gardens Reservoir (F). Display/hide their locations on the map
Size of family households: 656 2-persons, 618 3-persons, 527 4-persons, 480 5-persons, 74 6-persons, 105 7-or-more-persons
Size of nonfamily households: 562 1-person, 90 2-persons
1,639 married couples with children.
784 single-parent households (204 men, 580 women).
8.5% of residents of 78538 zip code speak English at home.
91.2% of residents speak Spanish at home (64% very well, 19% well, 7% not well, 11% not at all).
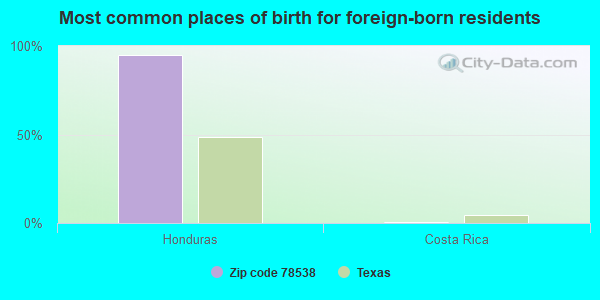
Foreign born population: 2,319 (22.4%) (34.3% of them are naturalized citizens)
This zip code:
22.4%
Whole state:
17.2%
95%Honduras
1%Costa Rica
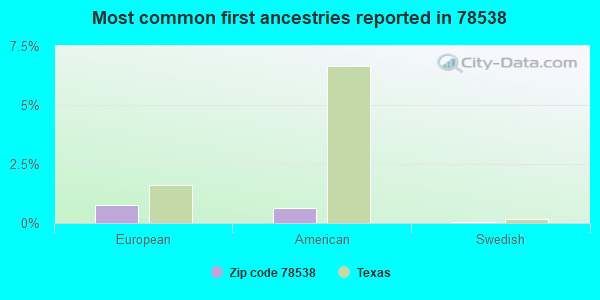
1%European
1%American
0%Swedish
Year of entry for the foreign-born population
1722010 or later
5022000 to 2009
4951990 to 1999
1,138Before 1990
Housing units lacking complete plumbing facilities: 6.1% Housing units lacking complete kitchen facilities: 4.1%
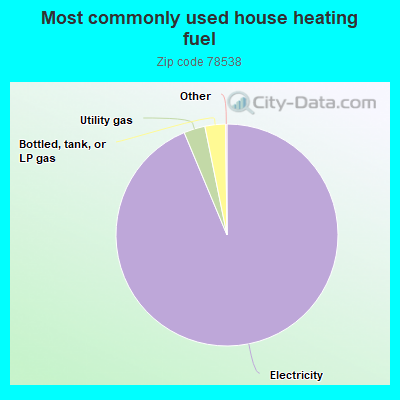
93.8%Electricity
3.1%Utility gas
3.0%Bottled, tank, or LP gas
Population in 1990: 16,225.
Place of birth for U.S.-born residents:
This state: 6,877
Northeast: 30
Midwest: 260
South: 192
West: 490
72% of the 78538 zip code residents lived in the same house 5 years ago. Out of people who lived in different houses, 77% lived in this county. Out of people who lived in different counties, 50% lived in Texas.
99% of the 78538 zip code residents lived in the same house 1 year ago. Out of people who lived in different houses, 56% moved from this county. Out of people who lived in different houses, 79% moved from different state.
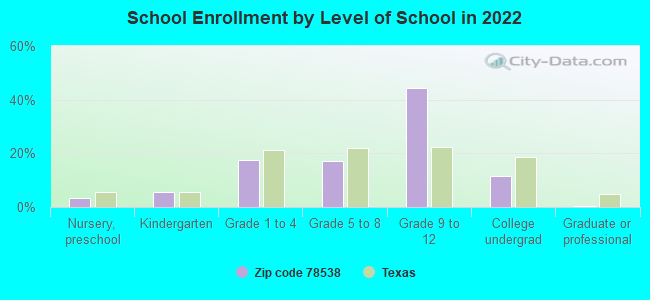
Private vs. public school enrollment:
Students in private schools in grades 1 to 8 (elementary and middle school): 9
Here:
1.0%
Texas:
8.8%
Students in private schools in grades 9 to 12 (high school):
Here:
0.0%
Texas:
8.0%
Students in private undergraduate colleges: 67
Here:
19.5%
Texas:
16.2%
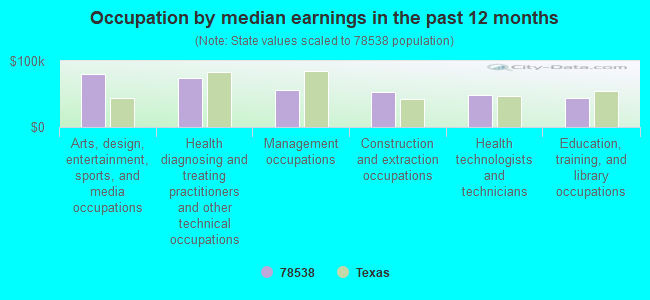
Occupation by median earnings in the past 12 months ($)
79,950Arts, design, entertainment, sports, and media occupations
73,672Health diagnosing and treating practitioners and other technical occupations
55,839Management occupations
52,299Construction and extraction occupations
49,115Health technologists and technicians
43,284Education, training, and library occupations
Top industries in this zip code by the number of employees in 2005:
Construction: Water and Sewer Line and Related Structures Construction (20-49 employees: 1 establishment, 10-19 employees: 1 establishment)
Educational Services: Elementary and Secondary Schools (20-49: 1, 10-19: 1)
Health Care and Social Assistance: Freestanding Ambulatory Surgical and Emergency Centers (20-49: 1)
Health Care and Social Assistance: All Other Outpatient Care Centers (20-49: 1)
Health Care and Social Assistance: Services for the Elderly and Persons with Disabilities (20-49: 1)
Professional, Scientific, and Technical Services: Surveying and Mapping (except Geophysical) Services (10-19: 1, 1-4: 1)
Health Care and Social Assistance: Child Day Care Services (10-19: 1, 1-4: 1)
Finance and Insurance: Commercial Banking (5-9: 1)
People in group quarters in 2000:
5 people in other workers' dormitories
Fatal accident statistics in 2011:
Fatal accident count: 1
Vehicles involved in fatal accidents: 2
Fatal accidents caused by drunken drivers: 1
Fatalities: 1
Persons involved in fatal accidents: 4
Pedestrians involved in fatal accidents: 0
Fatal accident statistics in 2010:
Fatal accident count: 1
Vehicles involved in fatal accidents: 2
Fatal accidents caused by drunken drivers: 0
Fatalities: 1
Persons involved in fatal accidents: 4
Pedestrians involved in fatal accidents: 0
Home Mortgage Disclosure Act Aggregated Statistics For Year 2009 (Based on 8 partial tracts)
A) FHA, FSA/RHS & VA Home Purchase Loans
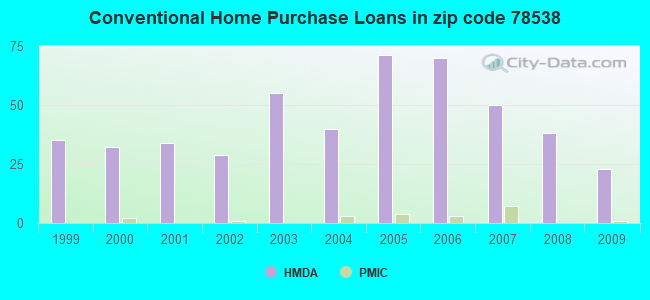
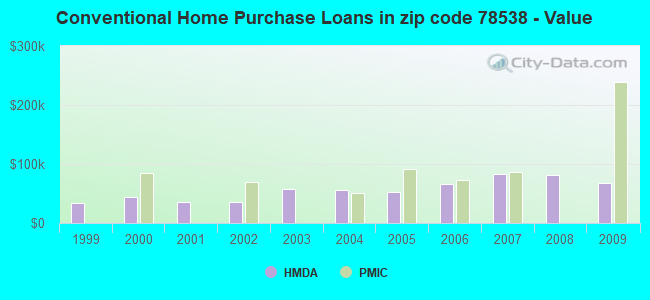
B) Conventional Home Purchase Loans
C) Refinancings
D) Home Improvement Loans
F) Non-occupant Loans on < 5 Family Dwellings (A B C & D)
G) Loans On Manufactured Home Dwelling (A B C & D)
Number
Average Value
Number
Average Value
Number
Average Value
Number
Average Value
Number
Average Value
Number
Average Value
LOANS ORIGINATED
8
$78,024
23
$67,582
24
$93,331
5
$45,938
6
$87,620
3
$32,617
APPLICATIONS APPROVED, NOT ACCEPTED
1
$110,910
0
$0
10
$59,283
5
$13,478
0
$0
0
$0
APPLICATIONS DENIED
2
$83,770
13
$89,066
43
$70,489
47
$20,043
2
$52,480
7
$12,894
APPLICATIONS WITHDRAWN
2
$70,680
4
$136,152
19
$123,328
3
$41,607
0
$0
0
$0
FILES CLOSED FOR INCOMPLETENESS
2
$81,095
0
$0
4
$77,665
7
$37,891
0
$0
0
$0
Aggregated Statistics For Year 2008 (Based on 8 partial tracts)
A) FHA, FSA/RHS & VA Home Purchase Loans
B) Conventional Home Purchase Loans
C) Refinancings
D) Home Improvement Loans
F) Non-occupant Loans on < 5 Family Dwellings (A B C & D)
G) Loans On Manufactured Home Dwelling (A B C & D)
Number
Average Value
Number
Average Value
Number
Average Value
Number
Average Value
Number
Average Value
Number
Average Value
LOANS ORIGINATED
6
$89,270
38
$80,713
40
$93,737
21
$32,828
16
$66,059
5
$29,392
APPLICATIONS APPROVED, NOT ACCEPTED
1
$59,860
7
$146,921
16
$108,159
6
$47,390
2
$56,505
2
$31,815
APPLICATIONS DENIED
2
$53,605
40
$81,644
105
$74,841
52
$27,167
2
$44,020
18
$40,253
APPLICATIONS WITHDRAWN
1
$115,020
5
$76,632
31
$80,548
8
$47,009
1
$62,890
2
$66,550
FILES CLOSED FOR INCOMPLETENESS
4
$106,500
0
$0
4
$36,568
3
$51,767
0
$0
0
$0
Aggregated Statistics For Year 2007 (Based on 8 partial tracts)
A) FHA, FSA/RHS & VA Home Purchase Loans
B) Conventional Home Purchase Loans
C) Refinancings
D) Home Improvement Loans
F) Non-occupant Loans on < 5 Family Dwellings (A B C & D)
G) Loans On Manufactured Home Dwelling (A B C & D)
Number
Average Value
Number
Average Value
Number
Average Value
Number
Average Value
Number
Average Value
Number
Average Value
LOANS ORIGINATED
0
$0
50
$83,117
45
$81,925
34
$21,380
13
$62,962
10
$22,172
APPLICATIONS APPROVED, NOT ACCEPTED
0
$0
3
$45,317
19
$63,998
6
$16,310
3
$37,057
1
$77,250
APPLICATIONS DENIED
1
$68,500
40
$85,324
108
$87,369
59
$30,640
13
$81,054
8
$29,646
APPLICATIONS WITHDRAWN
0
$0
7
$83,496
40
$106,164
5
$35,516
4
$50,908
0
$0
FILES CLOSED FOR INCOMPLETENESS
0
$0
1
$64,030
11
$86,101
3
$33,457
1
$74,830
0
$0
Aggregated Statistics For Year 2006 (Based on 8 partial tracts)
A) FHA, FSA/RHS & VA Home Purchase Loans
B) Conventional Home Purchase Loans
C) Refinancings
D) Home Improvement Loans
E) Loans on Dwellings For 5+ Families
F) Non-occupant Loans on < 5 Family Dwellings (A B C & D)
G) Loans On Manufactured Home Dwelling (A B C & D)
Number
Average Value
Number
Average Value
Number
Average Value
Number
Average Value
Number
Average Value
Number
Average Value
Number
Average Value
LOANS ORIGINATED
7
$64,739
70
$65,787
58
$80,186
29
$24,642
1
$259,550
23
$62,257
5
$25,902
APPLICATIONS APPROVED, NOT ACCEPTED
0
$0
18
$50,661
22
$72,671
0
$0
0
$0
1
$36,590
3
$36,010
APPLICATIONS DENIED
3
$54,103
73
$68,582
96
$71,346
47
$28,152
1
$74,320
7
$61,237
9
$29,102
APPLICATIONS WITHDRAWN
0
$0
24
$79,390
36
$86,647
10
$25,209
0
$0
4
$42,542
3
$28,237
FILES CLOSED FOR INCOMPLETENESS
1
$149,790
3
$54,603
6
$101,727
0
$0
0
$0
0
$0
1
$149,790
Aggregated Statistics For Year 2005 (Based on 8 partial tracts)
A) FHA, FSA/RHS & VA Home Purchase Loans
B) Conventional Home Purchase Loans
C) Refinancings
D) Home Improvement Loans
E) Loans on Dwellings For 5+ Families
F) Non-occupant Loans on < 5 Family Dwellings (A B C & D)
G) Loans On Manufactured Home Dwelling (A B C & D)
Number
Average Value
Number
Average Value
Number
Average Value
Number
Average Value
Number
Average Value
Number
Average Value
Number
Average Value
LOANS ORIGINATED
6
$74,810
71
$52,850
51
$79,759
25
$26,670
0
$0
17
$38,062
21
$25,940
APPLICATIONS APPROVED, NOT ACCEPTED
1
$34,300
22
$65,680
16
$79,549
4
$40,695
0
$0
2
$78,045
5
$22,678
APPLICATIONS DENIED
5
$80,512
52
$48,737
103
$63,728
60
$29,919
0
$0
9
$48,896
21
$28,246
APPLICATIONS WITHDRAWN
0
$0
27
$76,915
50
$66,610
9
$117,368
3
$106,160
9
$92,604
0
$0
FILES CLOSED FOR INCOMPLETENESS
0
$0
3
$55,203
13
$86,499
1
$74,320
0
$0
0
$0
1
$74,320
Aggregated Statistics For Year 2004 (Based on 8 partial tracts)
A) FHA, FSA/RHS & VA Home Purchase Loans
B) Conventional Home Purchase Loans
C) Refinancings
D) Home Improvement Loans
F) Non-occupant Loans on < 5 Family Dwellings (A B C & D)
G) Loans On Manufactured Home Dwelling (A B C & D)
Number
Average Value
Number
Average Value
Number
Average Value
Number
Average Value
Number
Average Value
Number
Average Value
LOANS ORIGINATED
5
$60,776
40
$55,593
85
$57,636
26
$23,361
19
$47,756
11
$32,778
APPLICATIONS APPROVED, NOT ACCEPTED
0
$0
9
$41,582
15
$69,873
7
$26,297
4
$44,285
4
$16,087
APPLICATIONS DENIED
4
$30,022
56
$44,687
120
$54,618
56
$17,490
10
$43,168
23
$20,518
APPLICATIONS WITHDRAWN
0
$0
15
$59,917
46
$75,500
10
$29,488
3
$37,630
1
$40,410
FILES CLOSED FOR INCOMPLETENESS
1
$58,310
0
$0
17
$90,794
1
$20,160
0
$0
0
$0
Aggregated Statistics For Year 2003 (Based on 8 partial tracts)
A) FHA, FSA/RHS & VA Home Purchase Loans
B) Conventional Home Purchase Loans
C) Refinancings
D) Home Improvement Loans
F) Non-occupant Loans on < 5 Family Dwellings (A B C & D)
Number
Average Value
Number
Average Value
Number
Average Value
Number
Average Value
Number
Average Value
LOANS ORIGINATED
2
$54,075
55
$57,991
64
$67,634
28
$22,746
15
$100,714
APPLICATIONS APPROVED, NOT ACCEPTED
0
$0
5
$30,566
20
$66,940
1
$25,160
0
$0
APPLICATIONS DENIED
3
$62,520
28
$34,736
116
$51,928
65
$11,968
4
$32,585
APPLICATIONS WITHDRAWN
0
$0
19
$52,135
58
$61,811
5
$3,886
2
$71,415
FILES CLOSED FOR INCOMPLETENESS
0
$0
4
$109,402
3
$106,363
1
$54,880
0
$0
Aggregated Statistics For Year 2002 (Based on 6 partial tracts)
A) FHA, FSA/RHS & VA Home Purchase Loans
B) Conventional Home Purchase Loans
C) Refinancings
D) Home Improvement Loans
F) Non-occupant Loans on < 5 Family Dwellings (A B C & D)
Number
Average Value
Number
Average Value
Number
Average Value
Number
Average Value
Number
Average Value
LOANS ORIGINATED
1
$68,500
29
$36,373
30
$55,660
28
$10,022
8
$25,824
APPLICATIONS APPROVED, NOT ACCEPTED
0
$0
9
$47,318
4
$31,652
3
$9,210
0
$0
APPLICATIONS DENIED
3
$30,223
32
$43,168
31
$36,501
31
$8,038
5
$59,034
APPLICATIONS WITHDRAWN
0
$0
16
$29,489
14
$45,252
4
$7,502
1
$17,960
FILES CLOSED FOR INCOMPLETENESS
0
$0
0
$0
2
$89,390
0
$0
0
$0
Aggregated Statistics For Year 2001 (Based on 6 partial tracts)
A) FHA, FSA/RHS & VA Home Purchase Loans
B) Conventional Home Purchase Loans
C) Refinancings
D) Home Improvement Loans
E) Loans on Dwellings For 5+ Families
F) Non-occupant Loans on < 5 Family Dwellings (A B C & D)
Number
Average Value
Number
Average Value
Number
Average Value
Number
Average Value
Number
Average Value
Number
Average Value
LOANS ORIGINATED
1
$102,100
34
$34,767
27
$66,269
93
$3,379
1
$1,182,310
10
$36,127
APPLICATIONS APPROVED, NOT ACCEPTED
0
$0
6
$42,650
7
$39,667
2
$15,605
0
$0
0
$0
APPLICATIONS DENIED
0
$0
47
$37,455
36
$38,888
55
$8,370
0
$0
4
$27,458
APPLICATIONS WITHDRAWN
0
$0
10
$29,730
8
$50,505
12
$9,100
0
$0
0
$0
FILES CLOSED FOR INCOMPLETENESS
0
$0
0
$0
4
$50,732
0
$0
0
$0
0
$0
Aggregated Statistics For Year 2000 (Based on 6 partial tracts)
A) FHA, FSA/RHS & VA Home Purchase Loans
B) Conventional Home Purchase Loans
C) Refinancings
D) Home Improvement Loans
E) Loans on Dwellings For 5+ Families
F) Non-occupant Loans on < 5 Family Dwellings (A B C & D)
Number
Average Value
Number
Average Value
Number
Average Value
Number
Average Value
Number
Average Value
Number
Average Value
LOANS ORIGINATED
3
$51,303
32
$44,688
19
$59,204
106
$6,039
1
$110,750
8
$48,052
APPLICATIONS APPROVED, NOT ACCEPTED
3
$32,310
12
$38,832
4
$39,670
2
$13,365
0
$0
0
$0
APPLICATIONS DENIED
1
$23,260
68
$32,439
17
$34,291
46
$9,942
0
$0
3
$16,863
APPLICATIONS WITHDRAWN
1
$40,060
8
$36,621
6
$80,012
0
$0
0
$0
3
$60,567
FILES CLOSED FOR INCOMPLETENESS
0
$0
0
$0
3
$46,633
0
$0
0
$0
0
$0
Aggregated Statistics For Year 1999 (Based on 4 partial tracts)
A) FHA, FSA/RHS & VA Home Purchase Loans
B) Conventional Home Purchase Loans
C) Refinancings
D) Home Improvement Loans
F) Non-occupant Loans on < 5 Family Dwellings (A B C & D)
2002 - 2018 National Fire Incident Reporting System (NFIRS) incidents
Based on the data from the years 2002 - 2018 the average number of fires per year is 11. The highest number of reported fire incidents - 80 took place in 2007, and the least - 0 in 2012. The data has a dropping trend.
When looking into fire subcategories, the most reports belonged to: Outside Fires (77.8%), and Structure Fires (14.8%).
Fire incident types reported to NFIRS in Zip Code 78538


+$258
-$9,403
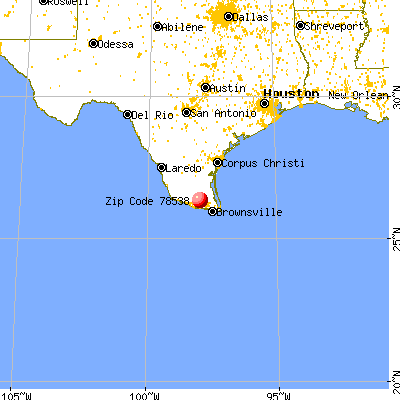
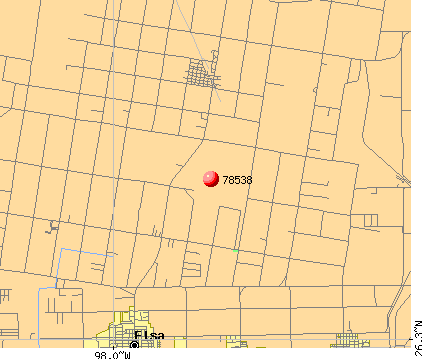 Nearest zip codes: 78543, 78558, 78549, 78562, 78561, 78542.
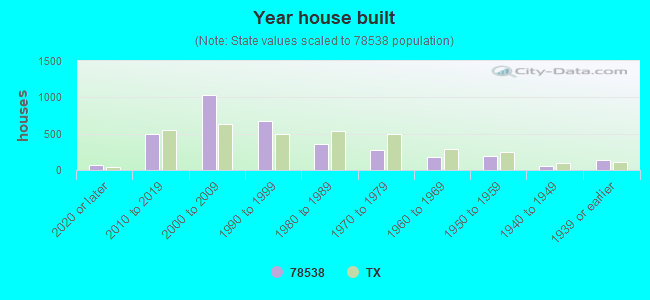


 Based on the data from the years 2002 - 2018 the average number of fires per year is 11. The highest number of reported fire incidents - 80 took place in 2007, and the least - 0 in 2012. The data has a dropping trend.
 When looking into fire subcategories, the most reports belonged to: Outside Fires (77.8%), and Structure Fires (14.8%).