Estimated zip code population in 2022: 78,816 Zip code population in 2010: 75,221 Zip code population in 2000: 114,124
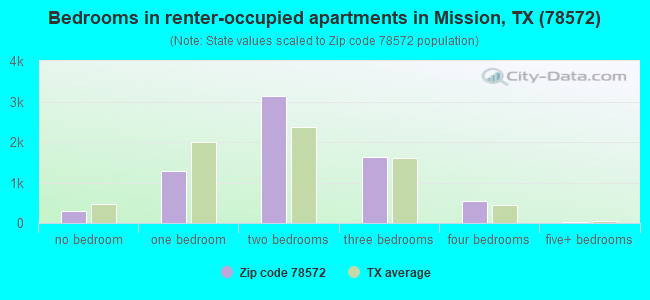
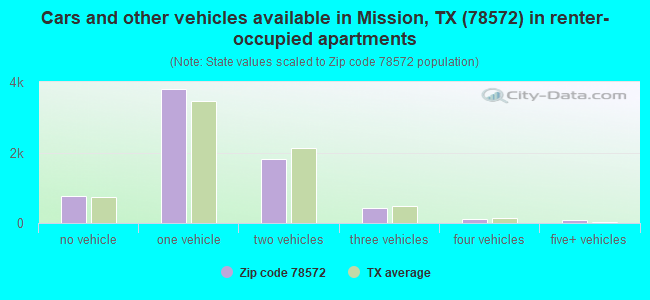
Houses and condos: 33,063 Renter-occupied apartments: 6,970
% of renters here:
26%
State:
38%
March 2022 cost of living index in zip code 78572: 81.3 (low, U.S. average is 100)
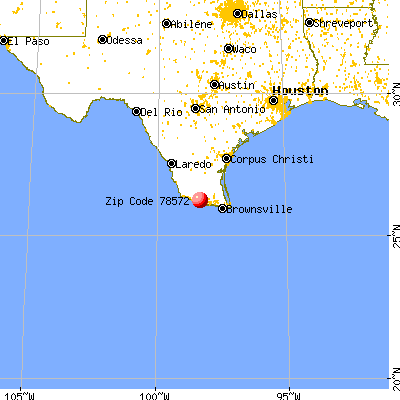
Land area: 77.5 sq. mi. Water area: 1.1 sq. mi.
Population density: 1,017 people per square mile
(low).
OSM Map
General Map
Google Map
MSN Map
OSM Map
General Map
Google Map
MSN Map
OSM Map
General Map
Google Map
MSN Map
OSM Map
General Map
Google Map
MSN Map
Please wait while loading the map...
Real estate property taxes paid for housing units in 2022:
This zip code:
1.7% ($2,230)
Texas:
1.5% ($4,050)
Median real estate property taxes paid for housing units with mortgages in 2022: $3,558 (1.9%) Median real estate property taxes paid for housing units with no mortgage in 2022: $1,544 (1.6%)
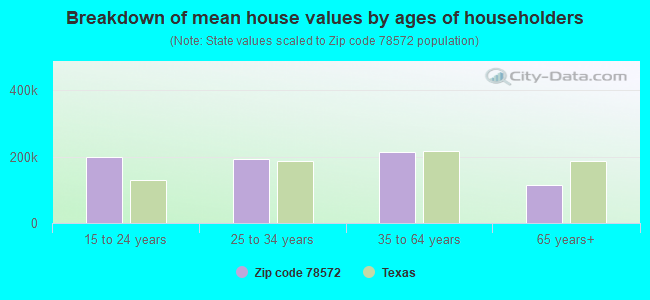
Estimated median house/condo value in 2022: $131,451
78572:
$131,451
Texas:
$275,400
According to our research of Texas and other state lists, there were 116 registered sex offenders living in 78572 zip code as of April 27, 2024. The ratio of all residents to sex offenders in zip code 78572 is 680 to 1. The ratio of registered sex offenders to all residents in this zip code is lower than the state average.
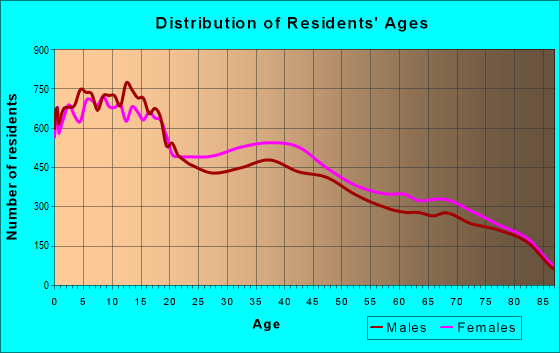
Median resident age:
This zip code:
38.2 years
Texas median age:
35.6 years
Average household size:
This zip code:
2.9 people
Texas:
2.6 people
Averages for the 2020 tax year for zip code 78572, filed in 2021:
Average Adjusted Gross Income (AGI) in 2020: $46,036 (Individual Income Tax Returns)
Here:
$46,036
State:
$77,054
Salary/wage: $41,042 (reported on 79.4% of returns)
Here:
$41,042
State:
$62,766
(% of AGI for various income ranges: 1125.9% for AGIs below $25k, 3309.5% for AGIs $25k-50k, 6265.3% for AGIs $50k-75k, 9231.9% for AGIs $75k-100k, 16567.5% for AGIs $100k-200k, 85037.1% for AGIs over 200k)
Taxable interest for individuals: $2,283 (reported on 13.5% of returns)
This zip code:
$2,283
Texas:
$2,665
(% of AGI for various income ranges: 7.4% for AGIs below $25k, 15.0% for AGIs $25k-50k, 28.1% for AGIs $50k-75k, 68.4% for AGIs $75k-100k, 172.9% for AGIs $100k-200k, 2250.6% for AGIs over 200k)
Ordinary dividends: $8,195 (reported on 6.0% of returns)
Here:
$8,195
State:
$10,044
(% of AGI for various income ranges: 5.2% for AGIs below $25k, 13.2% for AGIs $25k-50k, 31.8% for AGIs $50k-75k, 68.1% for AGIs $75k-100k, 194.7% for AGIs $100k-200k, 5684.1% for AGIs over 200k)
Net capital gain/loss in AGI: +$16,003 (reported on 6.8% of returns)
Here:
+$16,003
State:
+$39,590
(% of AGI for various income ranges: 5.2% for AGIs below $25k, 14.1% for AGIs $25k-50k, 49.6% for AGIs $50k-75k, 89.6% for AGIs $75k-100k, 557.2% for AGIs $100k-200k, 13509.4% for AGIs over 200k)
Profit/loss from business: +$7,960 (reported on 25.9% of returns)
Here:
+$7,960
State:
+$10,888
(% of AGI for various income ranges: 220.7% for AGIs below $25k, 87.1% for AGIs $25k-50k, 115.6% for AGIs $50k-75k, 241.8% for AGIs $75k-100k, 458.8% for AGIs $100k-200k, 12216.5% for AGIs over 200k)
Taxable individual retirement arrangement distribution: $15,994 (reported on 4.0% of returns)
78572:
$15,994
Texas:
$24,740
(% of AGI for various income ranges: 19.6% for AGIs below $25k, 42.1% for AGIs $25k-50k, 95.8% for AGIs $50k-75k, 221.9% for AGIs $75k-100k, 525.6% for AGIs $100k-200k, 1313.5% for AGIs over 200k)
Self-employed (Keogh) retirement plans: $29,575 (reported on 0.1% of returns)
78572:
$29,575
Texas:
$29,298
(% of AGI for various income ranges: 695.9% for AGIs over 200k)
Total itemized deductions: $33,094 (reported on 3.6% of returns)
Here:
$33,094
State:
$40,428
(% of AGI for various income ranges: 13.0% for AGIs below $25k, 76.5% for AGIs $25k-50k, 252.4% for AGIs $50k-75k, 382.6% for AGIs $75k-100k, 668.9% for AGIs $100k-200k, 5487.6% for AGIs over 200k)
Charity contributions: $11,680 (reported on 2.7% of returns)
Here:
$11,680
State:
$18,201
(% of AGI for various income ranges: 0.8% for AGIs below $25k, 11.4% for AGIs $25k-50k, 45.9% for AGIs $50k-75k, 75.3% for AGIs $75k-100k, 172.7% for AGIs $100k-200k, 2701.8% for AGIs over 200k)
Taxes paid: $8,254 (reported on 3.4% of returns)
78572:
$8,254
State:
$7,821
(% of AGI for various income ranges: 3.1% for AGIs below $25k, 16.3% for AGIs $25k-50k, 76.4% for AGIs $50k-75k, 98.3% for AGIs $75k-100k, 181.9% for AGIs $100k-200k, 868.8% for AGIs over 200k)
Earned income credit: $2,965 (reported on 33.1% of returns)
Here:
$2,965
State:
$2,584
(% of AGI for various income ranges: 192.5% for AGIs below $25k, 122.6% for AGIs $25k-50k, 2.3% for AGIs $50k-75k)
Percentage of individuals using paid preparers for their 2020 taxes: 90.5%
Here:
91%
State:
92%
(% for various income ranges: 89.3% for AGIs below $25k, 92.1% for AGIs $25k-50k, 91.6% for AGIs $50k-75k, 91.2% for AGIs $75k-100k, 90.5% for AGIs $100k-200k, 90.8% for AGIs over 200k)
Averages for the 2012 tax year for zip code 78572, filed in 2013:
Average Adjusted Gross Income (AGI) in 2012: $41,801 (Individual Income Tax Returns)
Here:
$41,801
State:
$65,384
Salary/wage: $36,723 (reported on 81.1% of returns)
Here:
$36,723
State:
$52,524
(% of AGI for various income ranges: 74.5% for AGIs below $25k, 80.9% for AGIs $25k-50k, 79.7% for AGIs $50k-75k, 79.4% for AGIs $75k-100k, 76.0% for AGIs $100k-200k, 44.0% for AGIs over 200k)
Taxable interest for individuals: $2,310 (reported on 15.8% of returns)
This zip code:
$2,310
Texas:
$2,372
(% of AGI for various income ranges: 0.5% for AGIs below $25k, 0.7% for AGIs $25k-50k, 0.7% for AGIs $50k-75k, 0.6% for AGIs $75k-100k, 0.9% for AGIs $100k-200k, 1.6% for AGIs over 200k)
Ordinary dividends: $8,767 (reported on 6.9% of returns)
Here:
$8,767
State:
$9,721
(% of AGI for various income ranges: 0.5% for AGIs below $25k, 0.5% for AGIs $25k-50k, 0.7% for AGIs $50k-75k, 0.9% for AGIs $75k-100k, 1.1% for AGIs $100k-200k, 4.4% for AGIs over 200k)
Net capital gain/loss in AGI: +$15,597 (reported on 5.8% of returns)
Here:
+$15,597
State:
+$35,319
(% of AGI for various income ranges: 0.4% for AGIs below $25k, 0.4% for AGIs $25k-50k, 0.5% for AGIs $50k-75k, 0.7% for AGIs $75k-100k, 1.5% for AGIs $100k-200k, 8.5% for AGIs over 200k)
Profit/loss from business: +$10,139 (reported on 25.0% of returns)
Here:
+$10,139
State:
+$13,732
(% of AGI for various income ranges: 17.1% for AGIs below $25k, 3.2% for AGIs $25k-50k, 1.9% for AGIs $50k-75k, 1.9% for AGIs $75k-100k, 4.1% for AGIs $100k-200k, 6.3% for AGIs over 200k)
Taxable individual retirement arrangement distribution: $12,974 (reported on 5.1% of returns)
78572:
$12,974
Texas:
$19,511
(% of AGI for various income ranges: 1.1% for AGIs below $25k, 1.7% for AGIs $25k-50k, 2.1% for AGIs $50k-75k, 2.5% for AGIs $75k-100k, 1.9% for AGIs $100k-200k, 0.6% for AGIs over 200k)
Self-employment retirement plans: $23,025 (reported on 0.2% of returns)
78572:
$23,025
Texas:
$23,938
Total itemized deductions: $22,341 (23% of AGI, reported on 19.8% of returns)
Here:
$22,341
State:
$24,724
Here:
22.7% of AGI
State:
15.9% of AGI
(% of AGI for various income ranges: 3.7% for AGIs below $25k, 12.4% for AGIs $25k-50k, 16.1% for AGIs $50k-75k, 14.3% for AGIs $75k-100k, 12.1% for AGIs $100k-200k, 7.6% for AGIs over 200k)
Charity contributions: $3,667 (reported on 12.6% of returns)
Here:
$3,667
State:
$6,808
(% of AGI for various income ranges: 0.2% for AGIs below $25k, 0.7% for AGIs $25k-50k, 1.1% for AGIs $50k-75k, 1.2% for AGIs $75k-100k, 1.6% for AGIs $100k-200k, 1.8% for AGIs over 200k)
Taxes paid: $5,610 (reported on 18.8% of returns)
78572:
$5,610
State:
$6,921
(% of AGI for various income ranges: 0.7% for AGIs below $25k, 2.2% for AGIs $25k-50k, 2.9% for AGIs $50k-75k, 3.3% for AGIs $75k-100k, 3.7% for AGIs $100k-200k, 2.6% for AGIs over 200k)
Earned income credit: $3,112 (reported on 40.6% of returns)
Here:
$3,112
State:
$2,570
(% of AGI for various income ranges: 14.8% for AGIs below $25k, 2.4% for AGIs $25k-50k)
Percentage of individuals using paid preparers for their 2012 taxes: 69.1%
Here:
69%
State:
51%
(% for various income ranges: 69.2% for AGIs below $25k, 66.9% for AGIs $25k-50k, 68.9% for AGIs $50k-75k, 69.1% for AGIs $75k-100k, 72.1% for AGIs $100k-200k, 85.4% for AGIs over 200k)
Averages for the 2004 tax year for zip code 78572, filed in 2005:
Average Adjusted Gross Income (AGI) in 2004: $31,228 (Individual Income Tax Returns)
Here:
$31,228
State:
$47,881
Salary/wage: $28,163 (reported on 80.3% of returns)
Here:
$28,163
State:
$41,947
(% of AGI for various income ranges: 86.0% for AGIs below $10k, 77.0% for AGIs $10k-25k, 80.5% for AGIs $25k-50k, 78.5% for AGIs $50k-75k, 79.1% for AGIs $75k-100k, 56.3% for AGIs over 100k)
Taxable interest for individuals: $2,612 (reported on 20.9% of returns)
This zip code:
$2,612
Texas:
$2,255
(% of AGI for various income ranges: 2.8% for AGIs below $10k, 1.1% for AGIs $10k-25k, 1.6% for AGIs $25k-50k, 1.4% for AGIs $50k-75k, 1.2% for AGIs $75k-100k, 2.5% for AGIs over 100k)
Taxable dividends: $3,384 (reported on 8.7% of returns)
Here:
$3,384
State:
$4,261
(% of AGI for various income ranges: 1.1% for AGIs below $10k, 0.5% for AGIs $10k-25k, 0.7% for AGIs $25k-50k, 0.9% for AGIs $50k-75k, 1.2% for AGIs $75k-100k, 1.4% for AGIs over 100k)
Net capital gain/loss: +$10,011 (reported on 7.7% of returns)
Here:
+$10,011
State:
+$16,110
(% of AGI for various income ranges: -0.1% for AGIs below $10k, 0.2% for AGIs $10k-25k, 0.5% for AGIs $25k-50k, 0.9% for AGIs $50k-75k, 2.0% for AGIs $75k-100k, 6.7% for AGIs over 100k)
Profit/loss from business: +$9,144 (reported on 25.1% of returns)
Here:
+$9,144
State:
+$11,013
(% of AGI for various income ranges: 26.4% for AGIs below $10k, 13.3% for AGIs $10k-25k, 2.8% for AGIs $25k-50k, 1.8% for AGIs $50k-75k, 1.5% for AGIs $75k-100k, 8.6% for AGIs over 100k)
IRA payment deduction: $3,438 (reported on 1.1% of returns)
78572:
$3,438
Texas:
$3,120
(% of AGI for various income ranges: 0.1% for AGIs $10k-25k, 0.1% for AGIs $25k-50k, 0.2% for AGIs $50k-75k, 0.2% for AGIs $75k-100k, 0.1% for AGIs over 100k)
Self-employed pension: $19,135 (reported on 0.3% of returns)
Here:
$19,135
Texas:
$16,401
Total itemized deductions: $19,413 (24% of AGI, reported on 16.0% of returns)
Here:
$19,413
State:
$19,631
Here:
24.4% of AGI
State:
18.9% of AGI
(% of AGI for various income ranges: 3.6% for AGIs below $10k, 3.7% for AGIs $10k-25k, 13.0% for AGIs $25k-50k, 15.3% for AGIs $50k-75k, 14.3% for AGIs $75k-100k, 9.1% for AGIs over 100k)
Charity contributions deductions: $3,417 (4% of AGI, reported on 12.0% of returns)
Here:
$3,417
State:
$4,753
Here:
3.9% of AGI
State:
4.2% of AGI
(% of AGI for various income ranges: 0.2% for AGIs below $10k, 0.3% for AGIs $10k-25k, 1.0% for AGIs $25k-50k, 1.6% for AGIs $50k-75k, 2.1% for AGIs $75k-100k, 2.1% for AGIs over 100k)
Total tax: $5,427 (reported on 57.6% of returns)
78572:
$5,427
State:
$9,058
(% of AGI for various income ranges: 5.4% for AGIs below $10k, 3.3% for AGIs $10k-25k, 4.6% for AGIs $25k-50k, 7.5% for AGIs $50k-75k, 9.1% for AGIs $75k-100k, 20.9% for AGIs over 100k)
Earned income credit: $2,563 (reported on 47.0% of returns)
Here:
$2,563
State:
$2,024
Percentage of individuals using paid preparers for their 2004 taxes: 74.6%
Here:
75%
State:
57%
(% for various income ranges: 74.0% for AGIs below $10k, 78.6% for AGIs $10k-25k, 70.5% for AGIs $25k-50k, 67.9% for AGIs $50k-75k, 65.5% for AGIs $75k-100k, 77.6% for AGIs over 100k)
Household received Food Stamps/SNAP in the past 12 months: 5,699 Household did not receive Food Stamps/SNAP in the past 12 months: 21,344
Women who had a birth in the past 12 months: 996 (581 now married, 408 unmarried) Women who did not have a birth in the past 12 months: 16,373 (7,449 now married, 8,916 unmarried)
Housing units in zip code 78572 with a mortgage: 7,180 (204 second mortgage, 28 home equity loan, 187 both second mortgage and home equity loan) Houses without a mortgage: 118
Median monthly owner costs for units with a mortgage: $1,500 Median monthly owner costs for units without a mortgage: $435
Residents with income below the poverty level in 2022:
This zip code:
23.1%
Whole state:
14.0%
Residents with income below 50% of the poverty level in 2022:
This zip code:
11.2%
Whole state:
7.4%
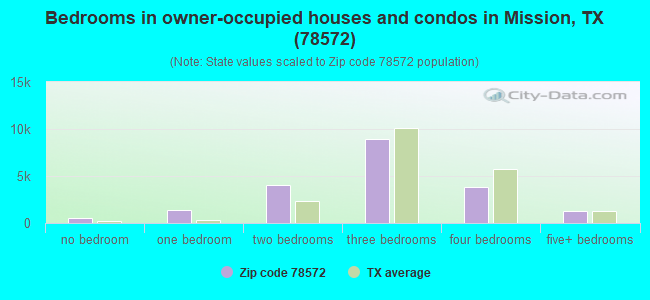
Median number of rooms in houses and condos:
Here:
5.2
State:
6.3
Median number of rooms in apartments:
Here:
3.8
State:
4.0
Notable locations in this zip code not listed on our city pages
12,220 married couples with children.
5,261 single-parent households (759 men, 4,502 women).
19.3% of residents of 78572 zip code speak English at home.
78.7% of residents speak Spanish at home (65% very well, 12% well, 10% not well, 13% not at all).
0.7% of residents speak other Indo-European language at home (80% very well, 15% well, 3% not well, 2% not at all).
1.0% of residents speak Asian or Pacific Island language at home (41% very well, 25% well, 27% not well, 6% not at all).
0.2% of residents speak other language at home (76% very well, 24% well).
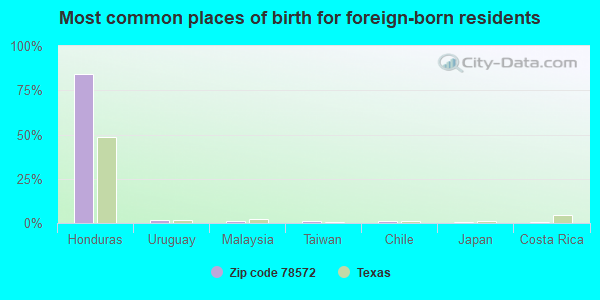
Foreign born population: 23,312 (29.6%) (43.9% of them are naturalized citizens)
This zip code:
29.6%
Whole state:
17.2%
84%Honduras
2%Uruguay
1%Malaysia
1%Taiwan
1%Chile
1%Japan
1%Costa Rica
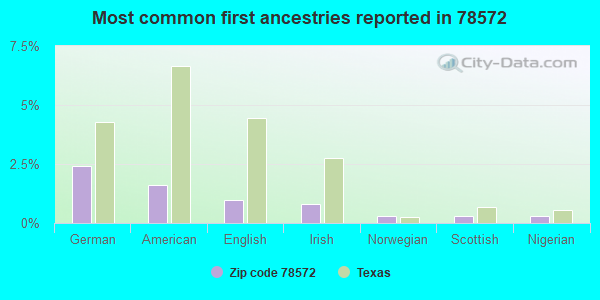
2%German
2%American
1%English
1%Irish
0%Norwegian
0%Scottish
0%Nigerian
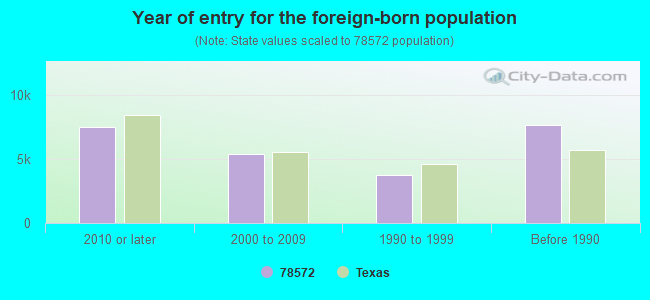
Year of entry for the foreign-born population
7,4742010 or later
5,4132000 to 2009
3,7561990 to 1999
7,647Before 1990
Facilities with environmental interests located in this zip code:
ANN RICHARDS MIDDLE SCHOOL (7005 ANN RICHARDS RD in MISSION, TX)
(Geographic Names Information System) (National Center for Education Statistics) - STATE ID-108912045 Organizations: LA JOYA ISD (SCHOOL DISTRICT)
B L GRAY JUNIOR HIGH (1106 N SHARY RD in MISSION, TX)
(National Center for Education Statistics) - STATE ID-108911041 Organizations: SHARYLAND ISD (SCHOOL DISTRICT)
BARNICK SPRAYING SERVICE (MOORE FIELD 3 MI N OF in MISSION, TX)
(Resource Conservation and Recovery Act (tracking hazardous waste))
Housing units lacking complete plumbing facilities: 2.4% Housing units lacking complete kitchen facilities: 1.4%
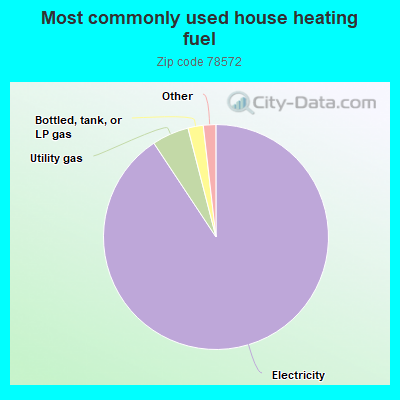
90.7%Electricity
5.3%Utility gas
2.2%Bottled, tank, or LP gas
0.9%No fuel used
0.9%Solar energy
Population in 1990: 67,604. Population change in the 1990s: +46,520 (+68.8%).
Place of birth for U.S.-born residents:
This state: 45,115
Northeast: 404
Midwest: 5,509
South: 1,485
West: 1,545
65% of the 78572 zip code residents lived in the same house 5 years ago. Out of people who lived in different houses, 74% lived in this county. Out of people who lived in different counties, 50% lived in Texas.
88% of the 78572 zip code residents lived in the same house 1 year ago. Out of people who lived in different houses, 59% moved from this county. Out of people who lived in different houses, 12% moved from different county within same state. Out of people who lived in different houses, 18% moved from different state. Out of people who lived in different houses, 10% moved from abroad.
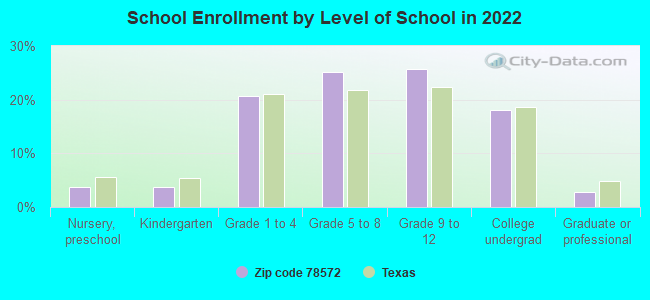
Private vs. public school enrollment:
Students in private schools in grades 1 to 8 (elementary and middle school): 380
Here:
3.8%
Texas:
8.8%
Students in private schools in grades 9 to 12 (high school): 105
Here:
1.9%
Texas:
8.0%
Students in private undergraduate colleges: 564
Here:
14.2%
Texas:
16.2%
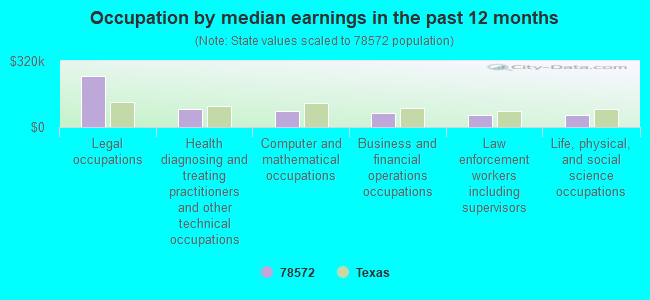
Occupation by median earnings in the past 12 months ($)
247,140Legal occupations
85,566Health diagnosing and treating practitioners and other technical occupations
79,301Computer and mathematical occupations
69,367Business and financial operations occupations
57,493Law enforcement workers including supervisors
55,893Life, physical, and social science occupations
Companies with biggest federal contracts located in this zip code (MISSION, TX):
COLAIR, INC (1221 EAST EXPRESSWAY 83; small business) : $696,224 in 13 contractsfrom 2004 to 2006
Contracts for Construction of Structures and Facilities -- Heating and Cooling Plants, Maintenance, Repair or Alteration of Real Property -- Miscellaneous Buildings, Other Architect and Engineering Services, Maintenance, Repair or Alteration of Real Property -- Office Buildings, and moreby Army, Navy, Animal and Plant Health Inspection Service, Public Buildings Service, and others Signed by year:2000: $0; 2001: $0; 2002: $0; 2003: $0; 2004: $52,743; 2005: $185,550; 2006: $457,931.
Biggest contracts:
$247,776 with Army for Construction of Structures and Facilities -- Heating and Cooling Plants. Signed on 2006-03-14. Completion date: 2006-12-29.
$203,000 with Navy for Maintenance, Repair or Alteration of Real Property -- Miscellaneous Buildings. Signed on 2006-04-03. Completion date: 2006-09-03.
$127,495 with Animal and Plant Health Inspection Service for Other Architect and Engineering Services. Signed on 2005-08-03. Completion date: 2006-02-13.
$42,850 with Public Buildings Service for Maintenance, Repair or Alteration of Real Property -- Office Buildings. Signed on 2004-08-25. Completion date: 2004-12-23.
PAUL VANDER ECKEN JR (625 NORTH BENTSEN PALM; small business) : $89,921 in 8 contractsfrom 2002 to 2006
Contracts for Custodial Janitorial Services by Army, U.S. Army Corps of Engineers - civil program financing only Signed by year:2000: $0; 2001: $0; 2002: $27,507; 2003: $0; 2004: $33,654; 2005: $18,240; 2006: $10,520.
Biggest contracts:
$16,827 with Army for Custodial Janitorial Services. Taking place in IA. Signed on 2004-01-21. Completion date: 2004-03-31.
$16,827 with U.S. Army Corps of Engineers - civil program financing only for Custodial Janitorial Services. Taking place in IA. Signed on 2004-01-21. Completion date: 2004-03-31.
$16,827, same as above.Signed on 2002-12-23. Completion date: 2004-03-31.
$10,680, same as above.Signed on 2002-01-18. Completion date: 2002-09-30.
SABO JR, CHARLES (1720 RIO DR; small business)
$61,470 with Army for Engineering and Technical Services. Signed on 2005-11-06. Completion date: 2006-09-30.
HAWTHORN SUITES LTD,MISSION TX (3700 PLANTATION GROVE; small business) : $54,755 in 4 contractsfrom 2005 to 2006
$50,304 with Army for Lodging - Hotel/Motel. Signed on 2006-03-03. Completion date: 2006-03-30.
$5,056, same as above.Signed on 2006-03-20. Completion date: 2006-03-30.
$0, same as above.Signed on 2006-06-26. Completion date: 2006-03-30.
-$605 with Army for Lodging - Hotel/Motel. Taking place in KS. Signed on 2005-03-14. Completion date: 2004-08-10.
LANTZ, VERLEA & BILLIE (301 N SHARY RD; small business) : $44,030 in 9 contractsfrom 2001 to 2006
Contracts for Custodial Janitorial Services, Surveillance Services by Army, U.S. Army Corps of Engineers - civil program financing only Signed by year:2000: $0; 2001: $6,320; 2002: $0; 2003: $6,320; 2004: $12,480; 2005: $13,600; 2006: $5,310.
Biggest contracts:
$6,800 with Army for Custodial Janitorial Services. Taking place in IA. Signed on 2005-04-26. Completion date: 2006-03-31.
$6,800 with U.S. Army Corps of Engineers - civil program financing only for Custodial Janitorial Services. Taking place in IA. Signed on 2005-04-26. Completion date: 2006-03-31.
$6,320 with U.S. Army Corps of Engineers - civil program financing only for Surveillance Services. Taking place in IA. Signed on 2004-02-26. Completion date: 2002-09-30.
$6,320 with Army for Surveillance Services. Taking place in IA. Signed on 2004-02-26. Completion date: 2002-09-30.
SCHWANKE, KENNETH L (4224 S CONWAY LOT 115; small business) : $24,500 in 2 contractsin 2004
$12,250 with U.S. Army Corps of Engineers - civil program financing only for Facilities Operations Support Services. Taking place in KY. Signed on 2004-03-11. Completion date: 2004-10-29.
$12,250 with Army for Facilities Operations Support Services. Taking place in KY. Signed on 2004-03-11. Completion date: 2004-10-29.
SAM TRAVIS (7130 W 83 EXPWY #24; small business) : $13,653 in 13 contractsfrom 2002 to 2006
Contracts for Other Housekeeping Services, Surveillance Services by Army, U.S. Army Corps of Engineers - civil program financing only Signed by year:2000: $0; 2001: $0; 2002: $2,067; 2003: $1,716; 2004: $4,160; 2005: $4,160; 2006: $1,550.
Biggest contracts:
$9,830 with Army for Other Housekeeping Services. Taking place in GA. Signed on 2006-02-15. Completion date: 2006-12-30.
$2,067 with U.S. Army Corps of Engineers - civil program financing only for Surveillance Services. Taking place in TN. Signed on 2002-01-31. Completion date: 2002-09-30.
$2,040 with Army for Surveillance Services. Taking place in TN. Signed on 2005-03-10. Completion date: 2004-01-26.
$2,040 with U.S. Army Corps of Engineers - civil program financing only for Surveillance Services. Taking place in TN. Signed on 2005-03-10. Completion date: 2004-01-26.
SEHIE, BEVERLY A (500 N BRYAN RD; small business)
$12,500 with Army for Custodial Janitorial Services. Taking place in IA. Signed on 2006-02-22. Completion date: 2006-05-01.
GERALD F SCHNEIDER (2409 W BOGEY DR; small business) : $8,946 in 7 contractsfrom 2002 to 2003
Contracts for Operation of Government-Owned Facilities -- Recreation Facilities (Non-Building) by U.S. Army Corps of Engineers - civil program financing only, Army Signed by year:2000: $0; 2001: $0; 2002: $994; 2003: $7,952; 2004: $0; 2005: $0; 2006: $0.
Biggest contracts:
$6,816 with U.S. Army Corps of Engineers - civil program financing only for Operation of Government-Owned Facilities -- Recreation Facilities (Non-Building). Taking place in AR. Signed on 2003-04-01. Completion date: 2002-09-30.
$1,136, same as above.Signed on 2003-10-27. Completion date: 2002-09-30.
$1,136 with Army for Operation of Government-Owned Facilities -- Recreation Facilities (Non-Building). Taking place in AR. Signed on 2003-10-27. Completion date: 2002-09-30.
$1,065 with U.S. Army Corps of Engineers - civil program financing only for Operation of Government-Owned Facilities -- Recreation Facilities (Non-Building). Taking place in AR. Signed on 2002-10-25. Completion date: 2002-09-30.
BAKER, ROBERT (CIRCLE T PARK, 1820 CLAY T; small business)
$8,460 with U.S. Army Corps of Engineers - civil program financing only for Recreation Site Maintenance Services (non-construction). Signed on 2003-03-18. Completion date: 2003-09-22.
Top industries in this zip code by the number of employees in 2005:
Health Care and Social Assistance: Home Health Care Services (250-499 employees: 2 establishments, 100-249 employees: 3 establishments, 50-99 employees: 1 establishment, 20-49 employees: 5 establishments, 1-4 employees: 3 establishments)
Health Care and Social Assistance: Services for the Elderly and Persons with Disabilities (250-499: 1, 100-249: 1, 20-49: 4, 10-19: 10, 5-9: 5, 1-4: 2)
2002 - 2018 National Fire Incident Reporting System (NFIRS) incidents
According to the data from the years 2002 - 2018 the average number of fire incidents per year is 305. The highest number of fire incidents - 527 took place in 2006, and the least - 199 in 2009. The data has a declining trend.
When looking into fire subcategories, the most incidents belonged to: Outside Fires (59.1%), and Structure Fires (19.8%).
Fire incident types reported to NFIRS in Zip Code 78572


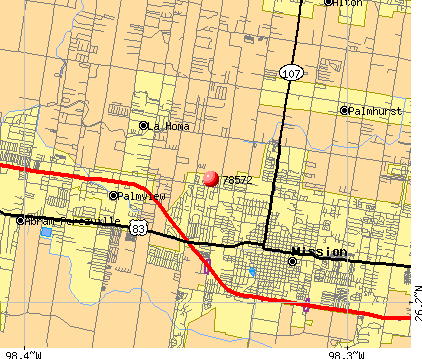 Nearest zip codes: 78574, 78573, 78560, 78501, 78576, 78503.
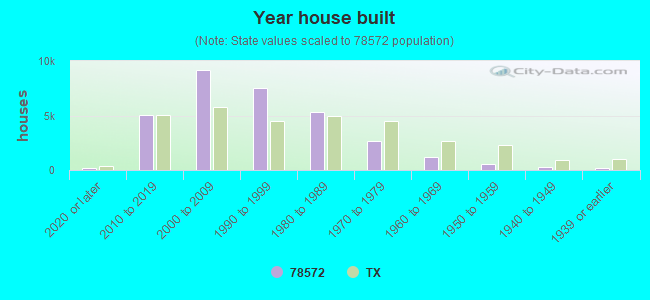


 According to the data from the years 2002 - 2018 the average number of fire incidents per year is 305. The highest number of fire incidents - 527 took place in 2006, and the least - 199 in 2009. The data has a declining trend.
 When looking into fire subcategories, the most incidents belonged to: Outside Fires (59.1%), and Structure Fires (19.8%).