Estimated zip code population in 2022: 20,074 Zip code population in 2010: 20,840 Zip code population in 2000: 20,808
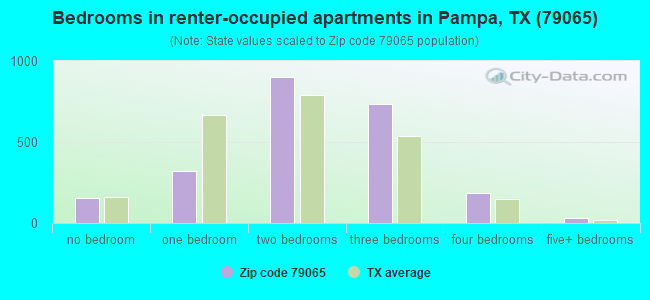
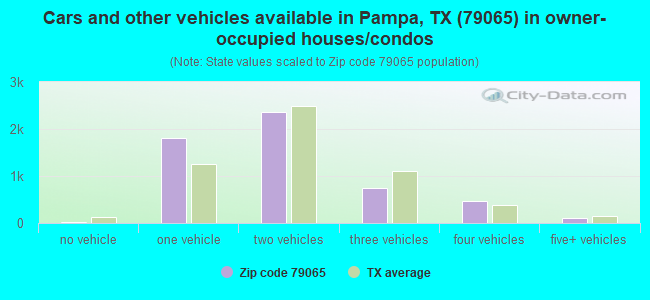
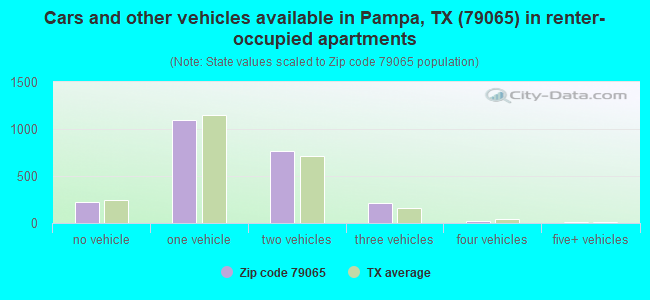
Houses and condos: 9,515 Renter-occupied apartments: 2,330
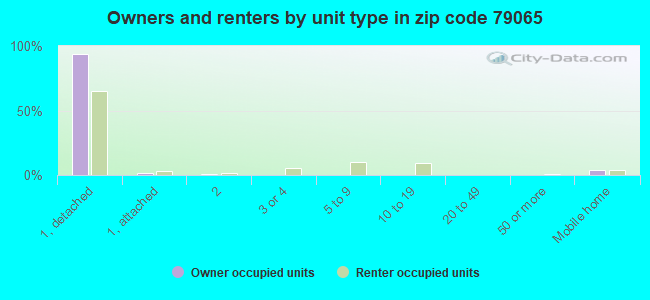
% of renters here:
30%
State:
38%
March 2022 cost of living index in zip code 79065: 76.4 (low, U.S. average is 100)
Land area: 489.8 sq. mi. Water area: 1.4 sq. mi.
Population density: 41 people per square mile
(very low).
OSM Map
General Map
Google Map
MSN Map
OSM Map
General Map
Google Map
MSN Map
OSM Map
General Map
Google Map
MSN Map
OSM Map
General Map
Google Map
MSN Map
Please wait while loading the map...
Real estate property taxes paid for housing units in 2022:
This zip code:
1.4% ($1,578)
Texas:
1.5% ($4,050)
Median real estate property taxes paid for housing units with mortgages in 2022: $3,085 (1.8%) Median real estate property taxes paid for housing units with no mortgage in 2022: $850 (0.9%)
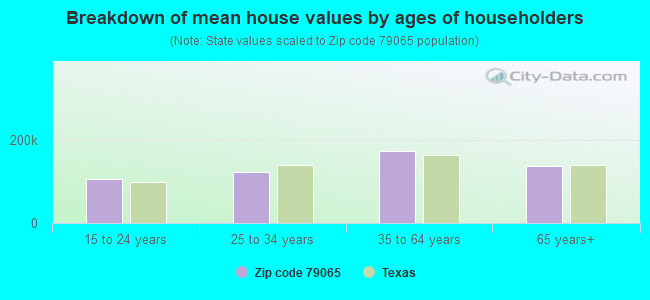
Estimated median house/condo value in 2022: $111,433
79065:
$111,433
Texas:
$275,400
According to our research of Texas and other state lists, there were 50 registered sex offenders living in 79065 zip code as of April 27, 2024. The ratio of all residents to sex offenders in zip code 79065 is 431 to 1. The ratio of registered sex offenders to all residents in this zip code is near the state average.
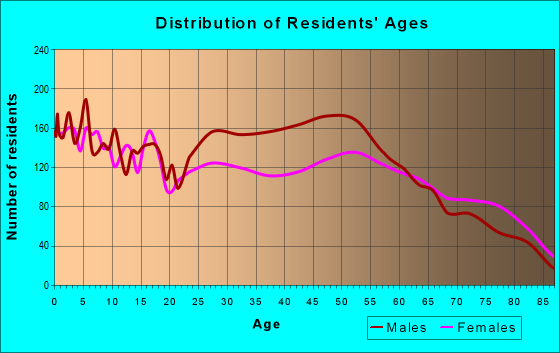
Median resident age:
This zip code:
37.1 years
Texas median age:
35.6 years
Average household size:
This zip code:
2.3 people
Texas:
2.6 people
Averages for the 2020 tax year for zip code 79065, filed in 2021:
Average Adjusted Gross Income (AGI) in 2020: $53,500 (Individual Income Tax Returns)
Here:
$53,500
State:
$77,054
Salary/wage: $46,455 (reported on 83.6% of returns)
Here:
$46,455
State:
$62,766
(% of AGI for various income ranges: 1195.8% for AGIs below $25k, 3468.0% for AGIs $25k-50k, 6106.4% for AGIs $50k-75k, 9051.5% for AGIs $75k-100k, 15415.8% for AGIs $100k-200k, 52450.0% for AGIs over 200k)
Taxable interest for individuals: $1,549 (reported on 23.8% of returns)
This zip code:
$1,549
Texas:
$2,665
(% of AGI for various income ranges: 12.7% for AGIs below $25k, 9.8% for AGIs $25k-50k, 33.0% for AGIs $50k-75k, 73.8% for AGIs $75k-100k, 121.4% for AGIs $100k-200k, 2092.0% for AGIs over 200k)
Ordinary dividends: $7,193 (reported on 12.4% of returns)
Here:
$7,193
State:
$10,044
(% of AGI for various income ranges: 19.2% for AGIs below $25k, 22.7% for AGIs $25k-50k, 70.7% for AGIs $50k-75k, 96.2% for AGIs $75k-100k, 330.5% for AGIs $100k-200k, 6082.0% for AGIs over 200k)
Net capital gain/loss in AGI: +$11,559 (reported on 11.2% of returns)
Here:
+$11,559
State:
+$39,590
(% of AGI for various income ranges: 11.7% for AGIs below $25k, 10.2% for AGIs $25k-50k, 96.9% for AGIs $50k-75k, 83.3% for AGIs $75k-100k, 388.4% for AGIs $100k-200k, 12038.0% for AGIs over 200k)
Profit/loss from business: +$7,647 (reported on 14.1% of returns)
Here:
+$7,647
State:
+$10,888
(% of AGI for various income ranges: 82.6% for AGIs below $25k, 61.8% for AGIs $25k-50k, 101.0% for AGIs $50k-75k, 191.0% for AGIs $75k-100k, 258.4% for AGIs $100k-200k, 4220.0% for AGIs over 200k)
Taxable individual retirement arrangement distribution: $19,606 (reported on 9.1% of returns)
79065:
$19,606
Texas:
$24,740
(% of AGI for various income ranges: 55.0% for AGIs below $25k, 109.9% for AGIs $25k-50k, 192.1% for AGIs $50k-75k, 517.5% for AGIs $75k-100k, 852.3% for AGIs $100k-200k, 3136.0% for AGIs over 200k)
Total itemized deductions: $36,110 (reported on 2.7% of returns)
Here:
$36,110
State:
$40,428
(% of AGI for various income ranges: 59.3% for AGIs $25k-50k, 61.0% for AGIs $50k-75k, 188.1% for AGIs $75k-100k, 426.7% for AGIs $100k-200k, 5358.0% for AGIs over 200k)
Charity contributions: $19,776 (reported on 2.2% of returns)
Here:
$19,776
State:
$18,201
(% of AGI for various income ranges: 23.5% for AGIs $25k-50k, 52.7% for AGIs $75k-100k, 161.1% for AGIs $100k-200k, 3580.0% for AGIs over 200k)
Taxes paid: $5,552 (reported on 2.7% of returns)
79065:
$5,552
State:
$7,821
(% of AGI for various income ranges: 7.7% for AGIs $25k-50k, 9.5% for AGIs $50k-75k, 28.3% for AGIs $75k-100k, 66.1% for AGIs $100k-200k, 870.0% for AGIs over 200k)
Earned income credit: $2,643 (reported on 21.1% of returns)
Here:
$2,643
State:
$2,584
(% of AGI for various income ranges: 126.3% for AGIs below $25k, 89.4% for AGIs $25k-50k, 2.7% for AGIs $50k-75k)
Percentage of individuals using paid preparers for their 2020 taxes: 94.1%
Here:
94%
State:
92%
(% for various income ranges: 92.4% for AGIs below $25k, 95.0% for AGIs $25k-50k, 94.8% for AGIs $50k-75k, 97.0% for AGIs $75k-100k, 94.4% for AGIs $100k-200k, 94.1% for AGIs over 200k)
Averages for the 2012 tax year for zip code 79065, filed in 2013:
Average Adjusted Gross Income (AGI) in 2012: $58,719 (Individual Income Tax Returns)
Here:
$58,719
State:
$65,384
Salary/wage: $44,775 (reported on 85.6% of returns)
Here:
$44,775
State:
$52,524
(% of AGI for various income ranges: 78.4% for AGIs below $25k, 82.5% for AGIs $25k-50k, 84.5% for AGIs $50k-75k, 79.4% for AGIs $75k-100k, 74.7% for AGIs $100k-200k, 20.2% for AGIs over 200k)
Taxable interest for individuals: $2,393 (reported on 25.4% of returns)
This zip code:
$2,393
Texas:
$2,372
(% of AGI for various income ranges: 1.2% for AGIs below $25k, 0.6% for AGIs $25k-50k, 0.5% for AGIs $50k-75k, 0.6% for AGIs $75k-100k, 0.6% for AGIs $100k-200k, 2.3% for AGIs over 200k)
Ordinary dividends: $8,424 (reported on 13.4% of returns)
Here:
$8,424
State:
$9,721
(% of AGI for various income ranges: 1.2% for AGIs below $25k, 0.9% for AGIs $25k-50k, 0.6% for AGIs $50k-75k, 0.5% for AGIs $75k-100k, 1.6% for AGIs $100k-200k, 4.9% for AGIs over 200k)
Net capital gain/loss in AGI: +$18,940 (reported on 10.6% of returns)
Here:
+$18,940
State:
+$35,319
(% of AGI for various income ranges: 0.2% for AGIs $25k-50k, 0.2% for AGIs $50k-75k, 1.2% for AGIs $75k-100k, 1.9% for AGIs $100k-200k, 11.4% for AGIs over 200k)
Profit/loss from business: +$16,852 (reported on 13.3% of returns)
Here:
+$16,852
State:
+$13,732
(% of AGI for various income ranges: 5.4% for AGIs below $25k, 2.3% for AGIs $25k-50k, 2.1% for AGIs $50k-75k, 2.4% for AGIs $75k-100k, 3.3% for AGIs $100k-200k, 6.8% for AGIs over 200k)
Taxable individual retirement arrangement distribution: $16,296 (reported on 9.6% of returns)
79065:
$16,296
Texas:
$19,511
(% of AGI for various income ranges: 3.1% for AGIs below $25k, 2.2% for AGIs $25k-50k, 2.2% for AGIs $50k-75k, 3.4% for AGIs $75k-100k, 3.9% for AGIs $100k-200k, 1.6% for AGIs over 200k)
Self-employment retirement plans: $24,900 (reported on 0.2% of returns)
79065:
$24,900
Texas:
$23,938
Total itemized deductions: $28,752 (19% of AGI, reported on 14.4% of returns)
Here:
$28,752
State:
$24,724
Here:
18.6% of AGI
State:
15.9% of AGI
(% of AGI for various income ranges: 3.5% for AGIs below $25k, 4.1% for AGIs $25k-50k, 5.1% for AGIs $50k-75k, 5.7% for AGIs $75k-100k, 7.7% for AGIs $100k-200k, 11.6% for AGIs over 200k)
Charity contributions: $9,633 (reported on 11.0% of returns)
Here:
$9,633
State:
$6,808
(% of AGI for various income ranges: 0.5% for AGIs below $25k, 0.8% for AGIs $25k-50k, 1.0% for AGIs $50k-75k, 1.5% for AGIs $75k-100k, 2.5% for AGIs $100k-200k, 3.0% for AGIs over 200k)
Taxes paid: $4,383 (reported on 13.8% of returns)
79065:
$4,383
State:
$6,921
(% of AGI for various income ranges: 0.4% for AGIs below $25k, 0.5% for AGIs $25k-50k, 0.8% for AGIs $50k-75k, 1.2% for AGIs $75k-100k, 1.8% for AGIs $100k-200k, 1.0% for AGIs over 200k)
Earned income credit: $2,259 (reported on 18.7% of returns)
Here:
$2,259
State:
$2,570
(% of AGI for various income ranges: 6.9% for AGIs below $25k, 1.3% for AGIs $25k-50k)
Percentage of individuals using paid preparers for their 2012 taxes: 49.2%
Here:
49%
State:
51%
(% for various income ranges: 43.4% for AGIs below $25k, 47.4% for AGIs $25k-50k, 53.3% for AGIs $50k-75k, 51.2% for AGIs $75k-100k, 57.7% for AGIs $100k-200k, 85.0% for AGIs over 200k)
Averages for the 2004 tax year for zip code 79065, filed in 2005:
Average Adjusted Gross Income (AGI) in 2004: $40,563 (Individual Income Tax Returns)
Here:
$40,563
State:
$47,881
Salary/wage: $34,482 (reported on 82.4% of returns)
Here:
$34,482
State:
$41,947
(% of AGI for various income ranges: 133.9% for AGIs below $10k, 76.2% for AGIs $10k-25k, 79.1% for AGIs $25k-50k, 81.2% for AGIs $50k-75k, 77.9% for AGIs $75k-100k, 43.6% for AGIs over 100k)
Taxable interest for individuals: $2,294 (reported on 37.4% of returns)
This zip code:
$2,294
Texas:
$2,255
(% of AGI for various income ranges: 9.6% for AGIs below $10k, 2.9% for AGIs $10k-25k, 1.9% for AGIs $25k-50k, 1.1% for AGIs $50k-75k, 1.2% for AGIs $75k-100k, 2.8% for AGIs over 100k)
Taxable dividends: $3,764 (reported on 17.8% of returns)
Here:
$3,764
State:
$4,261
(% of AGI for various income ranges: 2.4% for AGIs below $10k, 1.5% for AGIs $10k-25k, 0.8% for AGIs $25k-50k, 0.7% for AGIs $50k-75k, 1.0% for AGIs $75k-100k, 3.4% for AGIs over 100k)
Net capital gain/loss: +$5,727 (reported on 14.6% of returns)
Here:
+$5,727
State:
+$16,110
(% of AGI for various income ranges: -2.1% for AGIs below $10k, 0.6% for AGIs $10k-25k, 0.5% for AGIs $25k-50k, 0.8% for AGIs $50k-75k, 1.2% for AGIs $75k-100k, 5.6% for AGIs over 100k)
Profit/loss from business: +$10,047 (reported on 15.0% of returns)
Here:
+$10,047
State:
+$11,013
(% of AGI for various income ranges: 6.6% for AGIs below $10k, 3.0% for AGIs $10k-25k, 2.3% for AGIs $25k-50k, 2.2% for AGIs $50k-75k, 3.9% for AGIs $75k-100k, 6.0% for AGIs over 100k)
IRA payment deduction: $3,597 (reported on 1.8% of returns)
79065:
$3,597
Texas:
$3,120
(% of AGI for various income ranges: 0.2% for AGIs $10k-25k, 0.2% for AGIs $25k-50k, 0.2% for AGIs $50k-75k, 0.1% for AGIs $75k-100k, 0.2% for AGIs over 100k)
Self-employed pension: $11,583 (reported on 0.5% of returns)
Here:
$11,583
Texas:
$16,401
Total itemized deductions: $17,449 (19% of AGI, reported on 13.0% of returns)
Here:
$17,449
State:
$19,631
Here:
19.4% of AGI
State:
18.9% of AGI
(% of AGI for various income ranges: 6.2% for AGIs below $10k, 4.5% for AGIs $10k-25k, 4.6% for AGIs $25k-50k, 5.5% for AGIs $50k-75k, 6.3% for AGIs $75k-100k, 6.4% for AGIs over 100k)
Charity contributions deductions: $7,167 (7% of AGI, reported on 10.9% of returns)
Here:
$7,167
State:
$4,753
Here:
7.3% of AGI
State:
4.2% of AGI
(% of AGI for various income ranges: 0.9% for AGIs below $10k, 0.9% for AGIs $10k-25k, 1.0% for AGIs $25k-50k, 1.4% for AGIs $50k-75k, 2.2% for AGIs $75k-100k, 3.3% for AGIs over 100k)
Total tax: $6,806 (reported on 69.2% of returns)
79065:
$6,806
State:
$9,058
(% of AGI for various income ranges: 3.7% for AGIs below $10k, 3.5% for AGIs $10k-25k, 5.9% for AGIs $25k-50k, 8.6% for AGIs $50k-75k, 11.3% for AGIs $75k-100k, 22.1% for AGIs over 100k)
Earned income credit: $1,754 (reported on 18.4% of returns)
Here:
$1,754
State:
$2,024
Percentage of individuals using paid preparers for their 2004 taxes: 56.0%
Here:
56%
State:
57%
(% for various income ranges: 51.1% for AGIs below $10k, 58.2% for AGIs $10k-25k, 58.0% for AGIs $25k-50k, 53.4% for AGIs $50k-75k, 54.5% for AGIs $75k-100k, 66.6% for AGIs over 100k)
Household received Food Stamps/SNAP in the past 12 months: 1,220 Household did not receive Food Stamps/SNAP in the past 12 months: 6,624
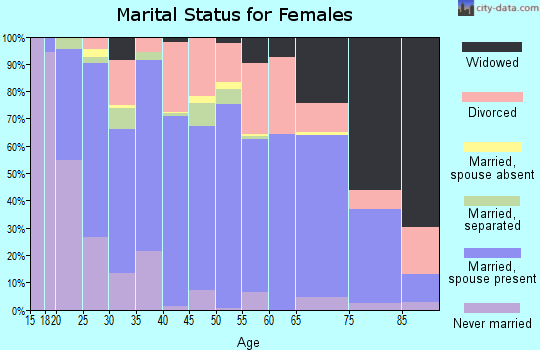
Women who had a birth in the past 12 months: 246 (73 now married, 166 unmarried) Women who did not have a birth in the past 12 months: 3,644 (2,132 now married, 1,495 unmarried)
Housing units in zip code 79065 with a mortgage: 2,136 (67 second mortgage, 73 both second mortgage and home equity loan) Houses without a mortgage: 24
Median monthly owner costs for units with a mortgage: $1,432 Median monthly owner costs for units without a mortgage: $452
Residents with income below the poverty level in 2022:
This zip code:
16.8%
Whole state:
14.0%
Residents with income below 50% of the poverty level in 2022:
This zip code:
10.7%
Whole state:
7.4%
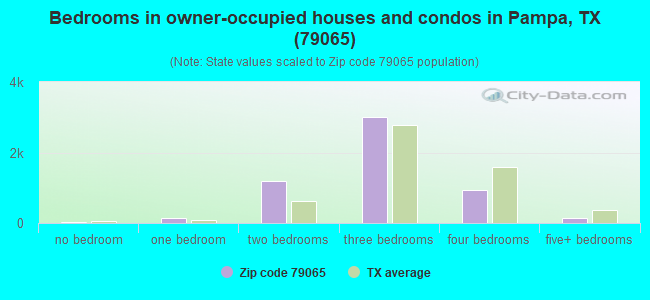
Median number of rooms in houses and condos:
Here:
5.8
State:
6.3
Median number of rooms in apartments:
Here:
4.3
State:
4.0
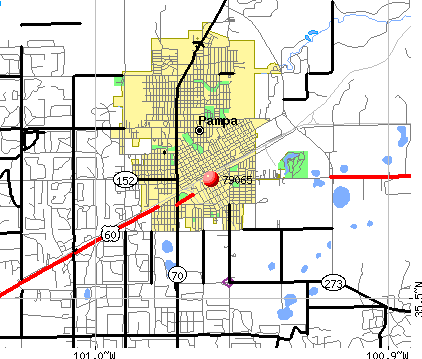
Notable locations in this zip code not listed on our city pages
Notable locations in zip code 79065: Hayhook Ranch (A), Huselby Ranch (B), Morrison Ranch (C), New Windmill (D), Sand Hill Windmill (E), Wayside Community Center (F), Webb Ranch (G), Pampa Country Club (H), Pampa Plant (I), Gray County Courthouse (J), Hoover Volunteer Fire Department Station 2 (K), Hoover Volunteer Fire Department Station 1 (L), Pampa Police Department (M), Pampa Fire Department Fire Marshal's Office (N), Pampa Fire Department Station 2 (O), Pampa Fire Department Station 1 (P), White Deer Land Museum (Q), Freedom Museum USA (R), Guardian Emergency Medical Service (S), Schneider Hotel (T). Display/hide their locations on the map
Churches in zip code 79065 include: Seventh Day Adventist Church (A), Presbyterian Update Church (B), United Pentecostal Church (C), Pentecostal Holiness Church (D), Zion Lutheran Church (E), Jehovahs Witnesses Church (F), Church of the Nazarene (G), Open Door Church of God in Christ (H), Westside Church of Christ (I). Display/hide their locations on the map
Lakes and reservoirs: Bell Lake (A), Deep Lake (B), Lake McConnell (C), City of Pampa Lake (D), Tadpole Lake (E), Gething Lakes (F), Franklin Lakes (G), Haynes Lake (H). Display/hide their locations on the map
Creeks: North Fork Grapevine Creek (A), South Fork Grapevine Creek (B), Cantonment Creek (C), West Fork Reynolds Creek (D), Thut Creek (E). Display/hide their locations on the map
Parks in zip code 79065 include: Lions Park (1), Hollywood Park (2), Highland Park (3), Prairie Park (4), Priest Park (5), Recreational Park (6), Mora Park (7), Marcus Sanders Park (8), Boys Club Park (9). Display/hide their locations on the map
3,165 married couples with children.
1,081 single-parent households (324 men, 757 women).
78.8% of residents of 79065 zip code speak English at home.
20.5% of residents speak Spanish at home (60% very well, 18% well, 12% not well, 10% not at all).
0.3% of residents speak other Indo-European language at home (41% very well, 50% well, 9% not well).
0.3% of residents speak Asian or Pacific Island language at home (100% very well).
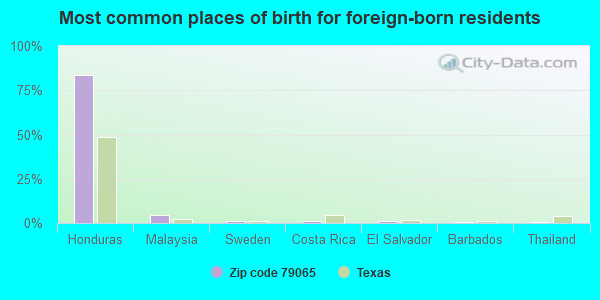
Foreign born population: 2,195 (10.9%) (29.6% of them are naturalized citizens)
This zip code:
10.9%
Whole state:
17.2%
84%Honduras
4%Malaysia
1%Sweden
1%Costa Rica
1%El Salvador
1%Barbados
1%Thailand
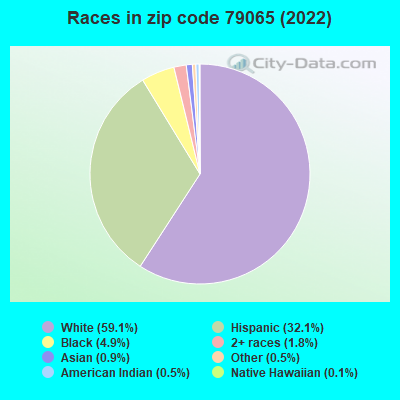
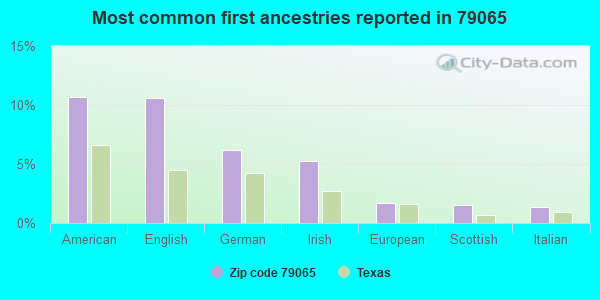
11%American
11%English
6%German
5%Irish
2%European
2%Scottish
1%Italian
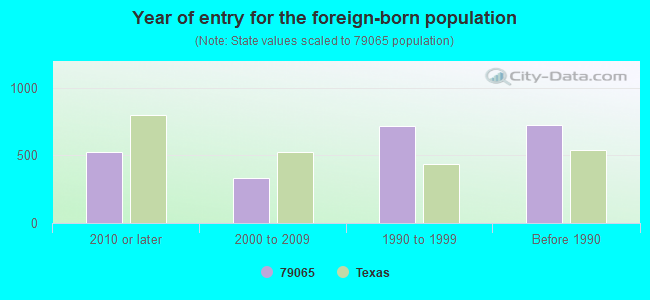
Year of entry for the foreign-born population
5282010 or later
3352000 to 2009
7151990 to 1999
723Before 1990
Facilities with environmental interests located in this zip code:
AUSTIN EL (1900 DUNCAN in PAMPA, TX)
(National Center for Education Statistics) - STATE ID-090904101 Organizations: PAMPA ISD (SCHOOL DISTRICT)
AMERICAN PROCESSING L.P. (FROM PAMPA:APPROX 5 MI.W ON U. in PAMPA, TX)
AIR MAJOR (AIRS/AFS) AIR MINOR (AIRS/AFS) CRITERIA AND HAZARDOUS AIR POLLUTANT INVENTORY (Inventory of air pollution sources) Business SIC classification: NATURAL GAS LIQUIDS Business NAICS classification: NATURAL GAS LIQUID EXTRACTION. Alternative names: ONEOK FIELD SERVICES COMPANY
AMERICAN PROCESSING LP (2 MI S OF HWY 152 ON RD 3 in PAMPA, TX)
(Resource Conservation and Recovery Act (tracking hazardous waste)) Business NAICS classification: NATURAL GAS LIQUID EXTRACTION. Alternative names: PIONEER #3
B&M TOOL COMPANY INC (HIGHWAY 60 W .25 MI S OF PRICE in PAMPA, TX)
(Resource Conservation and Recovery Act (tracking hazardous waste))
B & L TANK TRUCKS INC (HWY 152 .25M W OF in PAMPA, TX)
(Resource Conservation and Recovery Act (tracking hazardous waste))
AFCO NO 10422 (2109 ALCOCK in PAMPA, TX)
Conditionally Exempt Small Quantity Generators, less than 100 kg/month of hazardous waste (Resource Conservation and Recovery Act (tracking hazardous waste)) - notification Organizations: MICRO ENERGY LLC DBA AFCO (CONTACT/OWNER)
AMERICAN PROCESSING LP/KINGSMILL (HWY 60 N @ FM 2300 5M W in PAMPA, TX)
Conditionally Exempt Small Quantity Generators, less than 100 kg/month of hazardous waste (Resource Conservation and Recovery Act (tracking hazardous waste)) - notification
B & G ELECTRIC (241 S WESTERN ST in PAMPA, TX)
COMPLIANCE ACTIVITY (Tracking inspections of insecticide, fungicide, and rodenticide, and toxic substances) Business SIC classification: POWER, DISTRIBUTION, AND SPECIALTY TRANSFORMERS
Housing units lacking complete plumbing facilities: 6.0% Housing units lacking complete kitchen facilities: 5.0%
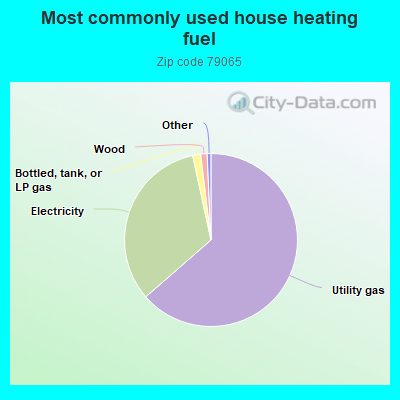
63.6%Utility gas
33.0%Electricity
1.5%Bottled, tank, or LP gas
1.2%Wood
Population in 1990: 22,816.
Place of birth for U.S.-born residents:
This state: 13,389
Northeast: 264
Midwest: 814
South: 1,557
West: 1,652
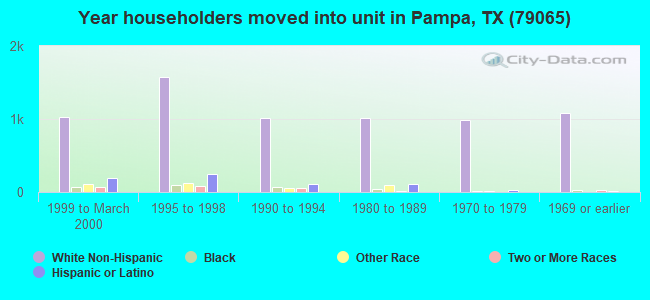
59% of the 79065 zip code residents lived in the same house 5 years ago. Out of people who lived in different houses, 60% lived in this county. Out of people who lived in different counties, 50% lived in Texas.
83% of the 79065 zip code residents lived in the same house 1 year ago. Out of people who lived in different houses, 31% moved from this county. Out of people who lived in different houses, 46% moved from different county within same state. Out of people who lived in different houses, 24% moved from different state. Out of people who lived in different houses, 2% moved from abroad.
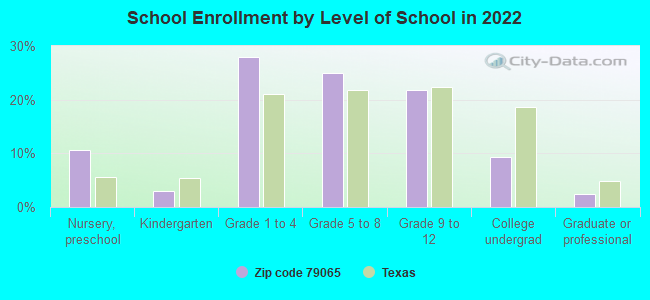
Private vs. public school enrollment:
Students in private schools in grades 1 to 8 (elementary and middle school): 115
Here:
4.8%
Texas:
8.8%
Students in private schools in grades 9 to 12 (high school): 73
Here:
7.5%
Texas:
8.0%
Students in private undergraduate colleges: 108
Here:
25.7%
Texas:
16.2%
Occupation by median earnings in the past 12 months ($)
84,877Computer and mathematical occupations
81,402Life, physical, and social science occupations
72,886Health diagnosing and treating practitioners and other technical occupations
72,722Architecture and engineering occupations
63,837Fire fighting and prevention, and other protective service workers including supervisors
59,525Management occupations
Companies with federal contracts located in this zip code:
PARSLEYS SHEET METAL & ROOFING (214 E TYNG AVE in PAMPA, TX; small business)
$3,800 with Navy for Maintenance, Repair or Alteration of Real Property -- Miscellaneous Buildings. Signed on 2000-12-28. Completion date: 2001-01-28.
Top industries in this zip code by the number of employees in 2005:
123 people in nursing facilities/skilled-nursing facilities
74 people in local jails and other municipal confinement facilities
4 people in group homes for juveniles (non-correctional)
4 people in group homes intended for adults
People in group quarters in 2000:
1,395 people in state prisons
159 people in nursing homes
41 people in local jails and other confinement facilities (including police lockups)
11 people in residential treatment centers for emotionally disturbed children
Fatal accident statistics in 2014:
Fatal accident count: 4
Vehicles involved in fatal accidents: 6
Fatal accidents caused by drunken drivers: 1
Fatalities: 4
Persons involved in fatal accidents: 10
Pedestrians involved in fatal accidents: 0
Fatal accident statistics in 2013:
Fatal accident count: 1
Vehicles involved in fatal accidents: 1
Fatal accidents caused by drunken drivers: 0
Fatalities: 1
Persons involved in fatal accidents: 2
Pedestrians involved in fatal accidents: 1
2002 - 2018 National Fire Incident Reporting System (NFIRS) incidents
Based on the data from the years 2002 - 2018 the average number of fire incidents per year is 140. The highest number of fire incidents - 200 took place in 2018, and the least - 10 in 2002. The data has an increasing trend.
When looking into fire subcategories, the most incidents belonged to: Outside Fires (59.6%), and Structure Fires (26.9%).
Fire incident types reported to NFIRS in Zip Code 79065
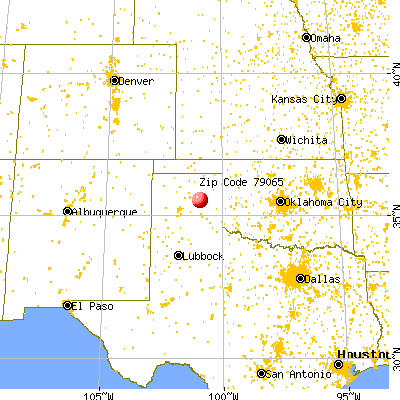


 Nearest zip codes: 79054, 79097, 79059, 79039, 79080, 79057.
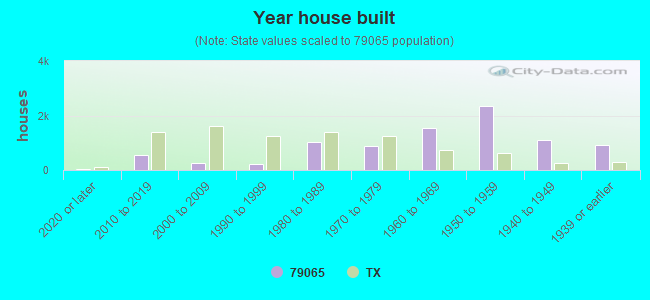


 Based on the data from the years 2002 - 2018 the average number of fire incidents per year is 140. The highest number of fire incidents - 200 took place in 2018, and the least - 10 in 2002. The data has an increasing trend.
 When looking into fire subcategories, the most incidents belonged to: Outside Fires (59.6%), and Structure Fires (26.9%).