Estimated zip code population in 2022: 43,805 Zip code population in 2010: 43,516 Zip code population in 2000: 46,005
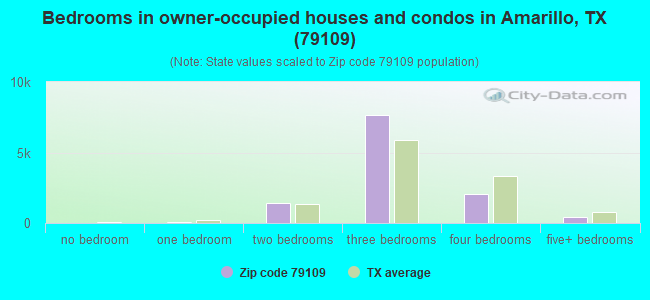
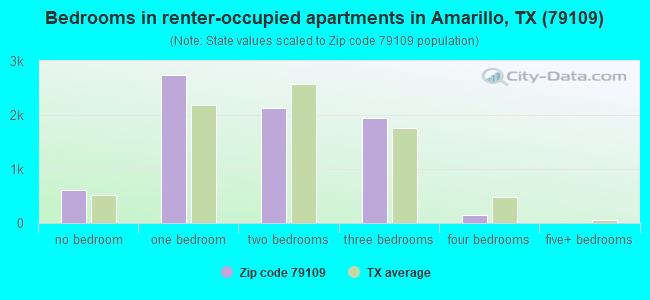
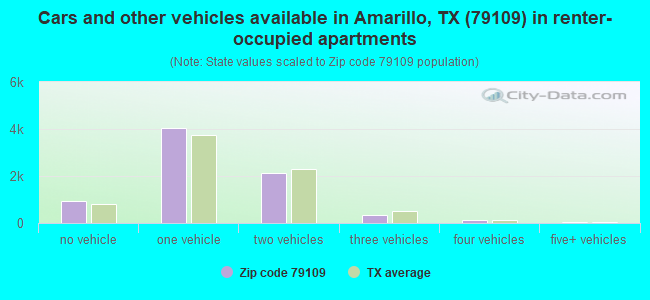
Houses and condos: 21,192 Renter-occupied apartments: 7,568
% of renters here:
39%
State:
38%
March 2022 cost of living index in zip code 79109: 83.5 (less than average, U.S. average is 100)
Land area: 10.4 sq. mi. Water area: 0.1 sq. mi.
Population density: 4,192 people per square mile
(average).
OSM Map
General Map
Google Map
MSN Map
OSM Map
General Map
Google Map
MSN Map
OSM Map
General Map
Google Map
MSN Map
OSM Map
General Map
Google Map
MSN Map
Please wait while loading the map...
Real estate property taxes paid for housing units in 2022:
This zip code:
1.5% ($3,469)
Texas:
1.5% ($4,050)
Median real estate property taxes paid for housing units with mortgages in 2022: $3,621 (1.6%) Median real estate property taxes paid for housing units with no mortgage in 2022: $3,341 (1.4%)
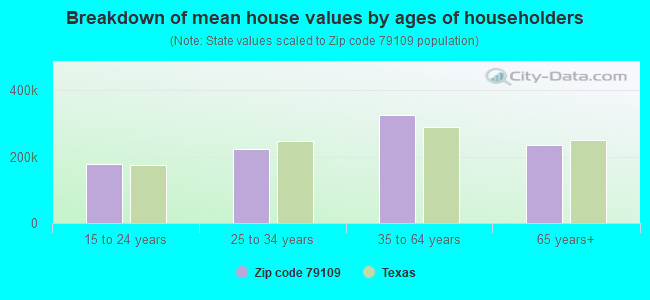
Estimated median house/condo value in 2022: $230,156
79109:
$230,156
Texas:
$275,400
According to our research of Texas and other state lists, there were 97 registered sex offenders living in 79109 zip code as of April 27, 2024. The ratio of all residents to sex offenders in zip code 79109 is 450 to 1. The ratio of registered sex offenders to all residents in this zip code is near the state average.
Median resident age:
This zip code:
38.1 years
Texas median age:
35.6 years
Average household size:
This zip code:
2.3 people
Texas:
2.6 people
Averages for the 2020 tax year for zip code 79109, filed in 2021:
Average Adjusted Gross Income (AGI) in 2020: $76,632 (Individual Income Tax Returns)
Here:
$76,632
State:
$77,054
Salary/wage: $54,304 (reported on 83.1% of returns)
Here:
$54,304
State:
$62,766
(% of AGI for various income ranges: 1203.2% for AGIs below $25k, 3491.1% for AGIs $25k-50k, 6187.3% for AGIs $50k-75k, 9180.2% for AGIs $75k-100k, 17113.1% for AGIs $100k-200k, 76029.4% for AGIs over 200k)
Taxable interest for individuals: $3,062 (reported on 28.9% of returns)
This zip code:
$3,062
Texas:
$2,665
(% of AGI for various income ranges: 16.9% for AGIs below $25k, 25.2% for AGIs $25k-50k, 52.9% for AGIs $50k-75k, 70.0% for AGIs $75k-100k, 197.2% for AGIs $100k-200k, 5721.7% for AGIs over 200k)
Ordinary dividends: $8,170 (reported on 15.0% of returns)
Here:
$8,170
State:
$10,044
(% of AGI for various income ranges: 21.4% for AGIs below $25k, 27.5% for AGIs $25k-50k, 88.4% for AGIs $50k-75k, 135.8% for AGIs $75k-100k, 302.0% for AGIs $100k-200k, 7368.3% for AGIs over 200k)
Net capital gain/loss in AGI: +$23,796 (reported on 14.3% of returns)
Here:
+$23,796
State:
+$39,590
(% of AGI for various income ranges: 12.0% for AGIs below $25k, 30.7% for AGIs $25k-50k, 91.5% for AGIs $50k-75k, 137.7% for AGIs $75k-100k, 495.8% for AGIs $100k-200k, 29794.4% for AGIs over 200k)
Profit/loss from business: +$11,392 (reported on 16.0% of returns)
Here:
+$11,392
State:
+$10,888
(% of AGI for various income ranges: 71.7% for AGIs below $25k, 68.3% for AGIs $25k-50k, 178.2% for AGIs $50k-75k, 265.9% for AGIs $75k-100k, 542.7% for AGIs $100k-200k, 7263.9% for AGIs over 200k)
Taxable individual retirement arrangement distribution: $17,992 (reported on 9.9% of returns)
79109:
$17,992
Texas:
$24,740
(% of AGI for various income ranges: 50.7% for AGIs below $25k, 96.4% for AGIs $25k-50k, 227.3% for AGIs $50k-75k, 384.0% for AGIs $75k-100k, 725.7% for AGIs $100k-200k, 3363.9% for AGIs over 200k)
Self-employed (Keogh) retirement plans: $22,386 (reported on 0.3% of returns)
79109:
$22,386
Texas:
$29,298
(% of AGI for various income ranges: 26.4% for AGIs $100k-200k, 616.7% for AGIs over 200k)
Total itemized deductions: $48,531 (reported on 5.3% of returns)
Here:
$48,531
State:
$40,428
(% of AGI for various income ranges: 24.9% for AGIs below $25k, 92.8% for AGIs $25k-50k, 182.4% for AGIs $50k-75k, 292.3% for AGIs $75k-100k, 562.5% for AGIs $100k-200k, 15802.8% for AGIs over 200k)
Charity contributions: $33,570 (reported on 4.5% of returns)
Here:
$33,570
State:
$18,201
(% of AGI for various income ranges: 2.5% for AGIs below $25k, 15.6% for AGIs $25k-50k, 51.5% for AGIs $50k-75k, 106.1% for AGIs $75k-100k, 273.5% for AGIs $100k-200k, 12278.3% for AGIs over 200k)
Taxes paid: $6,281 (reported on 5.1% of returns)
79109:
$6,281
State:
$7,821
(% of AGI for various income ranges: 3.2% for AGIs below $25k, 12.8% for AGIs $25k-50k, 30.8% for AGIs $50k-75k, 63.2% for AGIs $75k-100k, 112.1% for AGIs $100k-200k, 1265.6% for AGIs over 200k)
Earned income credit: $2,272 (reported on 15.5% of returns)
Here:
$2,272
State:
$2,584
(% of AGI for various income ranges: 86.3% for AGIs below $25k, 61.6% for AGIs $25k-50k, 1.4% for AGIs $50k-75k)
Percentage of individuals using paid preparers for their 2020 taxes: 93.9%
Here:
94%
State:
92%
(% for various income ranges: 93.7% for AGIs below $25k, 94.8% for AGIs $25k-50k, 94.1% for AGIs $50k-75k, 93.2% for AGIs $75k-100k, 93.5% for AGIs $100k-200k, 92.8% for AGIs over 200k)
Averages for the 2012 tax year for zip code 79109, filed in 2013:
Average Adjusted Gross Income (AGI) in 2012: $62,242 (Individual Income Tax Returns)
Here:
$62,242
State:
$65,384
Salary/wage: $47,312 (reported on 84.6% of returns)
Here:
$47,312
State:
$52,524
(% of AGI for various income ranges: 80.3% for AGIs below $25k, 79.4% for AGIs $25k-50k, 76.2% for AGIs $50k-75k, 76.5% for AGIs $75k-100k, 75.5% for AGIs $100k-200k, 29.6% for AGIs over 200k)
Taxable interest for individuals: $2,515 (reported on 30.7% of returns)
This zip code:
$2,515
Texas:
$2,372
(% of AGI for various income ranges: 1.2% for AGIs below $25k, 0.8% for AGIs $25k-50k, 0.9% for AGIs $50k-75k, 0.8% for AGIs $75k-100k, 0.8% for AGIs $100k-200k, 2.3% for AGIs over 200k)
Ordinary dividends: $6,798 (reported on 16.9% of returns)
Here:
$6,798
State:
$9,721
(% of AGI for various income ranges: 1.3% for AGIs below $25k, 0.9% for AGIs $25k-50k, 0.9% for AGIs $50k-75k, 0.9% for AGIs $75k-100k, 1.4% for AGIs $100k-200k, 3.9% for AGIs over 200k)
Net capital gain/loss in AGI: +$19,504 (reported on 13.8% of returns)
Here:
+$19,504
State:
+$35,319
(% of AGI for various income ranges: 0.3% for AGIs $25k-50k, 0.4% for AGIs $50k-75k, 0.5% for AGIs $75k-100k, 1.8% for AGIs $100k-200k, 13.8% for AGIs over 200k)
Profit/loss from business: +$14,814 (reported on 16.9% of returns)
Here:
+$14,814
State:
+$13,732
(% of AGI for various income ranges: 5.0% for AGIs below $25k, 3.5% for AGIs $25k-50k, 3.3% for AGIs $50k-75k, 2.9% for AGIs $75k-100k, 4.4% for AGIs $100k-200k, 4.7% for AGIs over 200k)
Taxable individual retirement arrangement distribution: $15,508 (reported on 11.1% of returns)
79109:
$15,508
Texas:
$19,511
(% of AGI for various income ranges: 3.0% for AGIs below $25k, 2.5% for AGIs $25k-50k, 2.8% for AGIs $50k-75k, 2.6% for AGIs $75k-100k, 2.9% for AGIs $100k-200k, 2.8% for AGIs over 200k)
Self-employment retirement plans: $22,209 (reported on 0.5% of returns)
79109:
$22,209
Texas:
$23,938
Total itemized deductions: $21,547 (16% of AGI, reported on 25.0% of returns)
Here:
$21,547
State:
$24,724
Here:
16.2% of AGI
State:
15.9% of AGI
(% of AGI for various income ranges: 6.0% for AGIs below $25k, 7.7% for AGIs $25k-50k, 8.8% for AGIs $50k-75k, 9.4% for AGIs $75k-100k, 10.1% for AGIs $100k-200k, 8.1% for AGIs over 200k)
Charity contributions: $8,711 (reported on 20.4% of returns)
Here:
$8,711
State:
$6,808
(% of AGI for various income ranges: 0.8% for AGIs below $25k, 1.3% for AGIs $25k-50k, 1.9% for AGIs $50k-75k, 2.3% for AGIs $75k-100k, 3.1% for AGIs $100k-200k, 4.8% for AGIs over 200k)
Taxes paid: $5,073 (reported on 24.8% of returns)
79109:
$5,073
State:
$6,921
(% of AGI for various income ranges: 1.1% for AGIs below $25k, 1.8% for AGIs $25k-50k, 2.2% for AGIs $50k-75k, 2.3% for AGIs $75k-100k, 2.7% for AGIs $100k-200k, 1.6% for AGIs over 200k)
Earned income credit: $2,174 (reported on 16.4% of returns)
Here:
$2,174
State:
$2,570
(% of AGI for various income ranges: 5.8% for AGIs below $25k, 1.0% for AGIs $25k-50k)
Percentage of individuals using paid preparers for their 2012 taxes: 46.9%
Here:
47%
State:
51%
(% for various income ranges: 42.1% for AGIs below $25k, 44.1% for AGIs $25k-50k, 47.6% for AGIs $50k-75k, 51.0% for AGIs $75k-100k, 55.0% for AGIs $100k-200k, 84.2% for AGIs over 200k)
Averages for the 2004 tax year for zip code 79109, filed in 2005:
Average Adjusted Gross Income (AGI) in 2004: $48,419 (Individual Income Tax Returns)
Here:
$48,419
State:
$47,881
Salary/wage: $41,244 (reported on 83.5% of returns)
Here:
$41,244
State:
$41,947
(% of AGI for various income ranges: 209.3% for AGIs below $10k, 77.0% for AGIs $10k-25k, 78.6% for AGIs $25k-50k, 78.3% for AGIs $50k-75k, 79.6% for AGIs $75k-100k, 55.8% for AGIs over 100k)
Taxable interest for individuals: $2,365 (reported on 43.9% of returns)
This zip code:
$2,365
Texas:
$2,255
(% of AGI for various income ranges: 14.7% for AGIs below $10k, 2.8% for AGIs $10k-25k, 1.9% for AGIs $25k-50k, 1.5% for AGIs $50k-75k, 1.6% for AGIs $75k-100k, 2.4% for AGIs over 100k)
Taxable dividends: $3,251 (reported on 23.5% of returns)
Here:
$3,251
State:
$4,261
(% of AGI for various income ranges: 9.7% for AGIs below $10k, 1.4% for AGIs $10k-25k, 1.1% for AGIs $25k-50k, 0.9% for AGIs $50k-75k, 0.9% for AGIs $75k-100k, 2.3% for AGIs over 100k)
Net capital gain/loss: +$10,844 (reported on 19.6% of returns)
Here:
+$10,844
State:
+$16,110
(% of AGI for various income ranges: 0.0% for AGIs below $10k, 0.2% for AGIs $10k-25k, 0.6% for AGIs $25k-50k, 0.8% for AGIs $50k-75k, 1.3% for AGIs $75k-100k, 10.3% for AGIs over 100k)
Profit/loss from business: +$11,967 (reported on 18.3% of returns)
Here:
+$11,967
State:
+$11,013
(% of AGI for various income ranges: 6.6% for AGIs below $10k, 4.3% for AGIs $10k-25k, 3.4% for AGIs $25k-50k, 3.6% for AGIs $50k-75k, 3.6% for AGIs $75k-100k, 6.0% for AGIs over 100k)
IRA payment deduction: $3,119 (reported on 2.7% of returns)
79109:
$3,119
Texas:
$3,120
(% of AGI for various income ranges: 0.5% for AGIs below $10k, 0.2% for AGIs $10k-25k, 0.2% for AGIs $25k-50k, 0.2% for AGIs $50k-75k, 0.2% for AGIs $75k-100k, 0.1% for AGIs over 100k)
Self-employed pension: $15,232 (reported on 0.7% of returns)
Here:
$15,232
Texas:
$16,401
(% of AGI for various income ranges: 0.0% for AGIs $25k-50k, 0.1% for AGIs $50k-75k, 0.1% for AGIs $75k-100k, 0.5% for AGIs over 100k)
Total itemized deductions: $17,422 (19% of AGI, reported on 29.9% of returns)
Here:
$17,422
State:
$19,631
Here:
19.4% of AGI
State:
18.9% of AGI
(% of AGI for various income ranges: 25.7% for AGIs below $10k, 8.3% for AGIs $10k-25k, 10.0% for AGIs $25k-50k, 11.5% for AGIs $50k-75k, 12.2% for AGIs $75k-100k, 10.3% for AGIs over 100k)
Charity contributions deductions: $6,090 (6% of AGI, reported on 25.7% of returns)
Here:
$6,090
State:
$4,753
Here:
6.4% of AGI
State:
4.2% of AGI
(% of AGI for various income ranges: 1.9% for AGIs below $10k, 1.3% for AGIs $10k-25k, 1.8% for AGIs $25k-50k, 2.6% for AGIs $50k-75k, 3.1% for AGIs $75k-100k, 4.7% for AGIs over 100k)
Total tax: $7,942 (reported on 77.8% of returns)
79109:
$7,942
State:
$9,058
(% of AGI for various income ranges: 7.0% for AGIs below $10k, 4.3% for AGIs $10k-25k, 7.4% for AGIs $25k-50k, 9.4% for AGIs $50k-75k, 11.0% for AGIs $75k-100k, 19.8% for AGIs over 100k)
Earned income credit: $1,754 (reported on 13.0% of returns)
Here:
$1,754
State:
$2,024
Percentage of individuals using paid preparers for their 2004 taxes: 50.3%
Here:
50%
State:
57%
(% for various income ranges: 43.2% for AGIs below $10k, 48.9% for AGIs $10k-25k, 49.8% for AGIs $25k-50k, 52.2% for AGIs $50k-75k, 52.0% for AGIs $75k-100k, 65.5% for AGIs over 100k)
Likely homosexual households (counted as self-reported same-sex unmarried-partner households)
Lesbian couples: 0.1% of all households
Gay men: 0.0% of all households
Household received Food Stamps/SNAP in the past 12 months: 1,486 Household did not receive Food Stamps/SNAP in the past 12 months: 17,727
Women who had a birth in the past 12 months: 325 (207 now married, 117 unmarried) Women who did not have a birth in the past 12 months: 9,684 (4,278 now married, 5,406 unmarried)
Housing units in zip code 79109 with a mortgage: 7,016 (262 second mortgage, 212 both second mortgage and home equity loan) Median monthly owner costs for units with a mortgage: $1,574 Median monthly owner costs for units without a mortgage: $682
Residents with income below the poverty level in 2022:
This zip code:
11.9%
Whole state:
14.0%
Residents with income below 50% of the poverty level in 2022:
This zip code:
7.4%
Whole state:
7.4%
Median number of rooms in houses and condos:
Here:
6.4
State:
6.3
Median number of rooms in apartments:
Here:
3.9
State:
4.0
Notable locations in this zip code not listed on our city pages
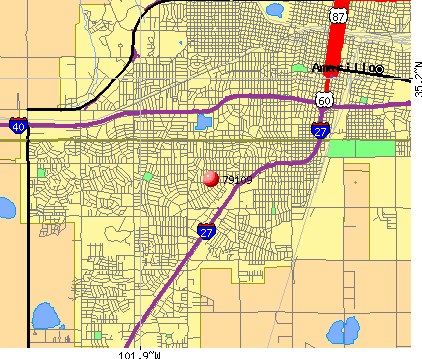
Notable locations in zip code 79109: Wolflin Historic District (A), Plemons-Mrs M D Oliver-Eakle Additions Historic District (B), Amarillo Fire Department Station 5 (C), Amarillo Fire Department Station 3 (D), Amarillo Museum of Art (E), Amarillo Fire Department Station 9 (F), Amarillo Medical Services (G), O'Hara Flying Service II (H), Amarillo College Administration Building and Gymnasium (I), Amarillo Globe Dream House (J). Display/hide their locations on the map
Churches in zip code 79109 include: Trinity Church (A), Temple Church (B), Temple Baptist Church (C), First Church of the Nazarene (D), Highland Baptist Church (E), Bell Avenue Baptist Church (F), First Temple Assembly of God Church (G), Westminster Presbyterian Church (H), Trinity United Methodist Church (I). Display/hide their locations on the map
Parks in zip code 79109 include: Southwest Park (1), Austin Park (2), Memorial Park (3), Paramount Park (4), Eakle Park (5), Amarillo Dillas Pro Baseball Field (6). Display/hide their locations on the map
Tourist attraction (not listed on the city page) : Amarillo Travel (Tours & Charters; 3920 Bell Street Apt 84).
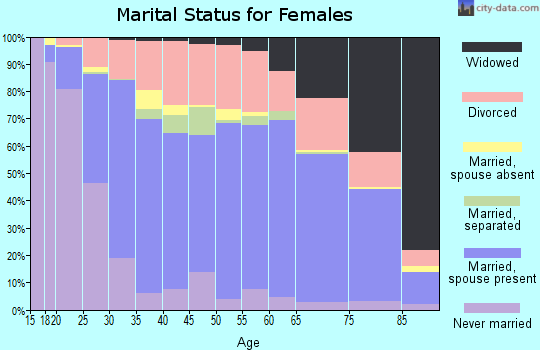
6,231 married couples with children.
2,936 single-parent households (782 men, 2,154 women).
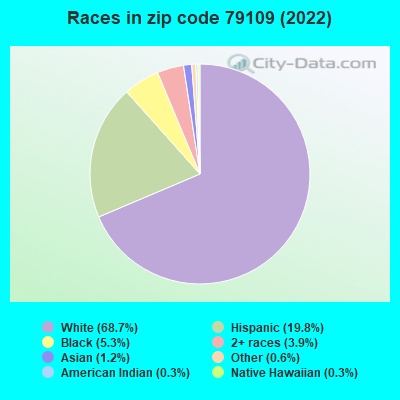
88.9% of residents of 79109 zip code speak English at home.
8.6% of residents speak Spanish at home (80% very well, 15% well, 5% not well).
1.4% of residents speak other Indo-European language at home (55% very well, 15% well, 18% not well, 13% not at all).
1.0% of residents speak Asian or Pacific Island language at home (22% very well, 78% well).
0.4% of residents speak other language at home (70% very well, 14% well, 3% not well, 14% not at all).
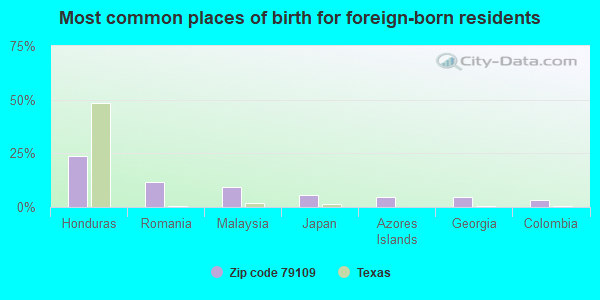
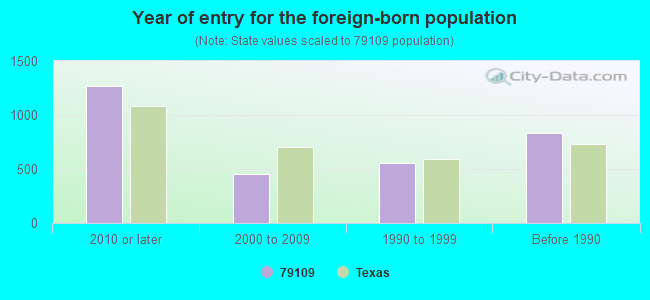
Foreign born population: 2,194 (5.0%) (52.9% of them are naturalized citizens)
Facilities with environmental interests located in this zip code:
AMARILLO H S (4225 DANBURY in AMARILLO, TX)
(National Center for Education Statistics) - STATE ID-188901001 Organizations: AMARILLO ISD (SCHOOL DISTRICT)
ARDEN ROAD EL (6801 LEARNING TREE AVE in AMARILLO, TX)
(National Center for Education Statistics) - STATE ID-191901106 Organizations: CANYON ISD (SCHOOL DISTRICT)
AUSTIN MIDDLE (1808 WIMBERLY RD in AMARILLO, TX)
(National Center for Education Statistics) - STATE ID-188901041 Organizations: AMARILLO ISD (SCHOOL DISTRICT)
AMARILLO GEAR COMPANY (2401 SUNDOWN LANE in AMARILLO, TX)
COMPLIANCE ACTIVITY (Tracking inspections of insecticide, fungicide, and rodenticide, and toxic substances) Conditionally Exempt Small Quantity Generators, less than 100 kg/month of hazardous waste (Resource Conservation and Recovery Act (tracking hazardous waste)) HAZARDOUS WASTE BIENNIAL REPORTER (Resource Conservation and Recovery Act (tracking hazardous waste)) Business SIC classification: SPEED CHANGERS, INDUSTRIAL HIGH-SPEED DRIVES, AND GEARS Business NAICS classification: SPEED CHANGER, INDUSTRIAL HIGH-SPEED DRIVE, AND GEAR MANUFACTURING. Alternative names: AMARILLO GEAR CO (DIV OF MARMON CO)
AMARILLO COLLISION REPAIR (4531 MAVERICK in AMARILLO, TX)
(Resource Conservation and Recovery Act (tracking hazardous waste)) Alternative names: BRADLEY DODGE
AMARILLO IMPORTS INC (3019 WEST 26TH AVENUE in AMARILLO, TX)
(Resource Conservation and Recovery Act (tracking hazardous waste))
AMARILLO INDUSTRIAL ELECTRIC INC (2829 MAYS AVENUE in AMARILLO, TX)
(Resource Conservation and Recovery Act (tracking hazardous waste)) Business NAICS classification: CONSUMER ELECTRONICS REPAIR AND MAINTENANCE. Alternative names: AMARILLO INDUSTRIAL ELECTRIC SVC
AUTOHAUS OF AMARILLO INC (2401 S GEORGIA in AMARILLO, TX)
(Resource Conservation and Recovery Act (tracking hazardous waste))
AUTOPLEX COLLISION REPAIR CTR (2701 S GEORGIA ST in AMARILLO, TX)
Small Quantity Generators, between 100 kg and 1000 kg of hazardous waste/month (Resource Conservation and Recovery Act (tracking hazardous waste)) - notification Business NAICS classification: AUTOMOTIVE BODY, PAINT, AND INTERIOR REPAIR AND MAINTENANCE. Organizations: HOLIDAY AUTOMOTIVE INC (CONTACT/OPERATOR)
Alternative names: AUTOPLEX COLLISION RPR CNTR
B & E MINUTE MAN CLEANERS (4154 PARAMOUNT in AMARILLO, TX)
(Resource Conservation and Recovery Act (tracking hazardous waste)) Alternative names: B & E 60 MIN MAN CLNRS
Housing units lacking complete plumbing facilities: 2.1% Housing units lacking complete kitchen facilities: 2.8%
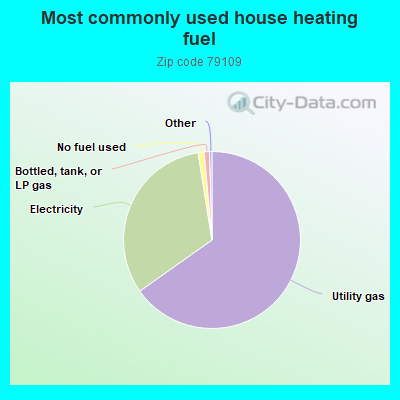
64.2%Utility gas
33.7%Electricity
1.0%Bottled, tank, or LP gas
0.8%No fuel used
Population in 1990: 41,676. Population change in the 1990s: +4,329 (+10.4%).
Place of birth for U.S.-born residents:
This state: 30,274
Northeast: 821
Midwest: 2,591
South: 2,903
West: 4,090
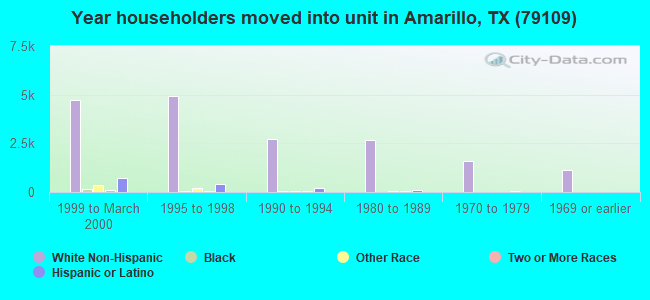
50% of the 79109 zip code residents lived in the same house 5 years ago. Out of people who lived in different houses, 43% lived in this county. Out of people who lived in different counties, 50% lived in Texas.
88% of the 79109 zip code residents lived in the same house 1 year ago. Out of people who lived in different houses, 52% moved from this county. Out of people who lived in different houses, 33% moved from different county within same state. Out of people who lived in different houses, 13% moved from different state. Out of people who lived in different houses, 1% moved from abroad.
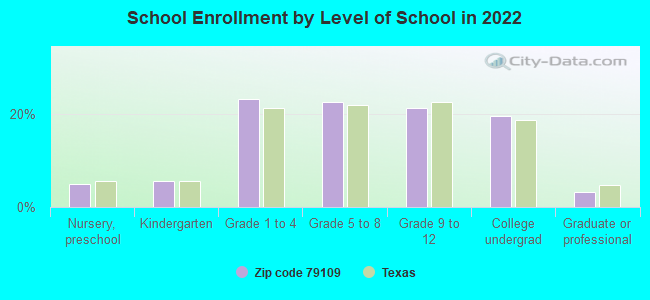
Private vs. public school enrollment:
Students in private schools in grades 1 to 8 (elementary and middle school): 495
Here:
11.1%
Texas:
8.8%
Students in private schools in grades 9 to 12 (high school): 77
Here:
3.8%
Texas:
8.0%
Students in private undergraduate colleges: 164
Here:
8.7%
Texas:
16.2%
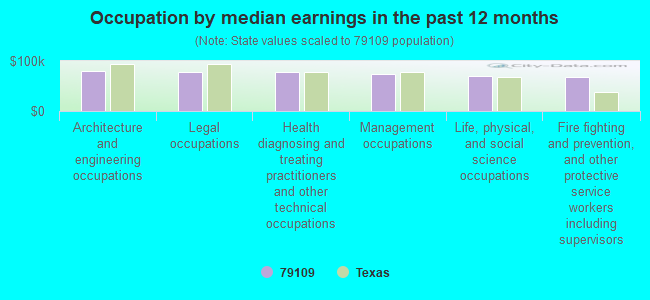
Occupation by median earnings in the past 12 months ($)
80,932Architecture and engineering occupations
78,861Legal occupations
77,543Health diagnosing and treating practitioners and other technical occupations
73,952Management occupations
69,913Life, physical, and social science occupations
67,384Fire fighting and prevention, and other protective service workers including supervisors
Companies with biggest federal contracts located in this zip code (AMARILLO, TX):
OA SYSTEMS CORPORATION (2201 CIVIC CIR STE 511; small business) : $15,184,552 in 374 contractsfrom 2000 to 2006
Contracts for Other Research and Development -- Applied Research and Exploratory Development (R&D), Air Quality Analyses, Engineering and Technical Services, Other Professional Services, and moreby U.S. Army Corps of Engineers - civil program financing only, Indian Affairs (Assistant Secretary), Army Signed by year:2000: $363,704; 2001: $870,399; 2002: $3,495,177; 2003: $2,246,426; 2004: $3,840,580; 2005: $3,159,888; 2006: $1,208,378.
Biggest contracts:
$1,451,695 with U.S. Army Corps of Engineers - civil program financing only for Other Research and Development -- Applied Research and Exploratory Development (R&D). Signed on 2002-03-20. Completion date: 2002-05-31.
$489,811 with U.S. Army Corps of Engineers - civil program financing only for Air Quality Analyses. Signed on 2002-01-16. Completion date: 2002-09-30.
$461,017 with Indian Affairs (Assistant Secretary) for Engineering and Technical Services. Taking place in AZ. Signed on 2003-09-15. Completion date: 2005-09-15.
$389,567 with U.S. Army Corps of Engineers - civil program financing only for Air Quality Analyses. Signed on 2002-11-22. Completion date: 2003-05-30.
HEADSETS INC (2320 LAKEVIEW DR; small business) : $261,038 in 7 contractsfrom 2003 to 2005
Contracts for Headsets, Handsets, Microphones and Speakers by Army, Air Force Signed by year:2000: $0; 2001: $0; 2002: $0; 2003: $36,600; 2004: $58,425; 2005: $166,013; 2006: $0.
Biggest contracts:
$51,050 with Army for Headsets, Handsets, Microphones and Speakers. Signed on 2005-09-20. Completion date: 2005-10-14.
$48,500, same as above.Signed on 2005-11-07. Completion date: 2005-12-09.
$37,850, same as above.Signed on 2005-08-09. Completion date: 2005-09-30.
$36,600 with Air Force for Headsets, Handsets, Microphones and Speakers. Signed on 2003-09-05. Completion date: 2003-09-30.
MDANGEL L L P (2605 PARKER; small business)
$155,682 with Air Force for Other Special Studies and Analyses. Signed on 2004-09-30. Completion date: 2005-06-09.
THOMAS A. EDISON INCORPORATED (3221 COMMERCE; small business) : $86,579 in 2 contractsin 2000
$59,600 with Army for ADP Support Equipment. Taking place in MD. Signed on 2000-01-20. Completion date: 2000-02-01.
$26,979 with Army for ADP Support Equipment. Signed on 2000-03-16. Completion date: 2000-04-03.
ARBOS HARDWOOD & SPORTS FLOOR (4515 PARKSIDE DR; small business) : $44,969 in 3 contractsfrom 2001 to 2003
$29,100 with Air Force for Maintenance, Repair or Alteration of Real Property -- Troop Housing Facilities. Signed on 2001-09-27. Completion date: 2001-11-05.
$13,239 with Air Force for Maintenance, Repair or Alteration of Real Property -- Miscellaneous Buildings. Signed on 2003-09-29. Completion date: 2003-11-07.
$2,630 with Air Force for Maintenance, Repair or Alteration of Real Property -- Troop Housing Facilities. Signed on 2001-09-27. Completion date: 2001-10-11.
DAVID ORR (12100 S BELL; small business) : $37,605 in 6 contractsfrom 2002 to 2005
Contracts for Landscaping/Groundskeeping Services by National Oceanic and Atmospheric Administration/Under Secretary for Oceans and Atmosphere, Navy Signed by year:2000: $0; 2001: $0; 2002: $7,410; 2003: $17,225; 2004: $6,485; 2005: $6,485; 2006: $0.
Biggest contracts:
$10,740 with National Oceanic and Atmospheric Administration/Under Secretary for Oceans and Atmosphere for Landscaping/Groundskeeping Services. Signed on 2003-10-08. Completion date: 2004-09-30.
$7,410 with Navy for Landscaping/Groundskeeping Services. Signed on 2002-01-22. Completion date: 2002-09-30.
$6,485, same as above.Signed on 2005-04-20. Completion date: 2008-04-21.
$6,485, same as above.Signed on 2004-04-16. Completion date: 2008-04-21.
BETZDEARBORN INC (2744 DUNIVEN CIRCLE; small business)
$32,759 with Army for Chemicals. Taking place in AK. Signed on 2000-03-03. Completion date: 2000-04-03.
NORTHRUPS CLEAN CUT LLP (6654 CANYON DRIVE 2; small business) : $29,840 in 8 contractsfrom 2004 to 2006
Contracts for Landscaping/Groundskeeping Services by National Oceanic and Atmospheric Administration/Under Secretary for Oceans and Atmosphere, Army Signed by year:2000: $0; 2001: $0; 2002: $0; 2003: $0; 2004: $12,210; 2005: $12,480; 2006: $5,150.
Biggest contracts:
$6,300 with National Oceanic and Atmospheric Administration/Under Secretary for Oceans and Atmosphere for Landscaping/Groundskeeping Services. Signed on 2005-11-15. Completion date: 2006-10-31.
$6,300, same as above.Signed on 2004-11-18. Completion date: 2005-10-31.
$6,180 with Army for Landscaping/Groundskeeping Services. Signed on 2005-01-01. Completion date: 2005-12-31.
$5,910, same as above.Signed on 2004-01-01. Completion date: 2004-12-31.
DALS JANITORIAL (3603 WAYNE ST; small business) : $28,644 in 5 contractsfrom 2002 to 2006
Contracts for Custodial Janitorial Services by Navy Signed by year:2000: $0; 2001: $0; 2002: $12,700; 2003: $15,185; 2004: $0; 2005: -$16,685; 2006: $17,444.
Biggest contracts:
$17,444 with Navy for Custodial Janitorial Services. Signed on 2006-04-14. Completion date: 2004-04-15.
$15,185, same as above.Signed on 2003-04-16. Completion date: 2004-04-15.
$12,700, same as above.Signed on 2002-04-13. Completion date: 2003-04-16.
$0, same as above.Signed on 2002-04-13. Completion date: 2003-04-16.
BERGER,STEVEN W (6702 ALPINE LANE; small business) : $28,090 in 2 contractsin 2006
$24,090 with Army for Other Professional Services. Signed on 2006-02-03. Completion date: 2006-03-17.
$4,000, same as above.Signed on 2006-03-21. Completion date: 2006-03-26.
Top industries in this zip code by the number of employees in 2005:
2002 - 2018 National Fire Incident Reporting System (NFIRS) incidents
According to the data from the years 2002 - 2018 the average number of fire incidents per year is 154. The highest number of reported fires - 209 took place in 2003, and the least - 97 in 2015. The data has a dropping trend.
When looking into fire subcategories, the most reports belonged to: Structure Fires (43.5%), and Outside Fires (43.2%).
Fire incident types reported to NFIRS in Zip Code 79109

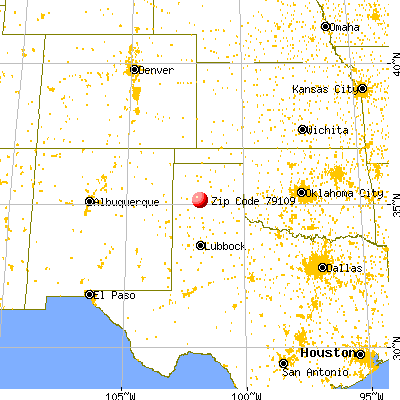


 Nearest zip codes: 79110, 79102, 79106, 79121, 79101, 79103.


 According to the data from the years 2002 - 2018 the average number of fire incidents per year is 154. The highest number of reported fires - 209 took place in 2003, and the least - 97 in 2015. The data has a dropping trend.
 When looking into fire subcategories, the most reports belonged to: Structure Fires (43.5%), and Outside Fires (43.2%).