Estimated zip code population in 2022: 7,470 Zip code population in 2010: 6,559 Zip code population in 2000: 5,777
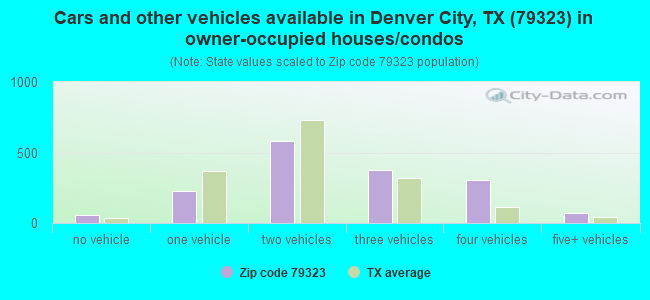
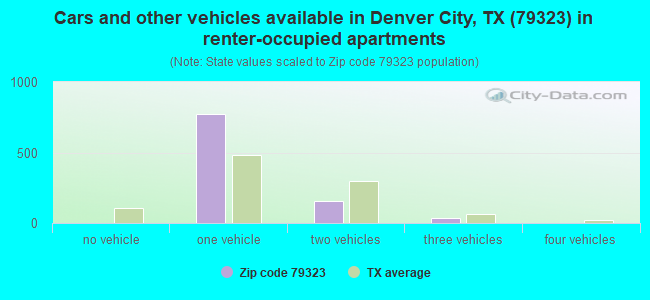
Houses and condos: 2,781 Renter-occupied apartments: 958
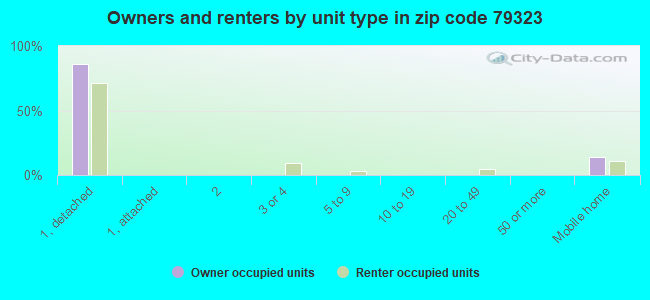
% of renters here:
37%
State:
38%
March 2022 cost of living index in zip code 79323: 77.9 (low, U.S. average is 100)
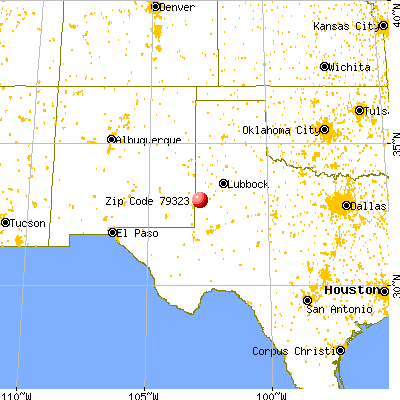
Land area: 230.4 sq. mi. Water area: 0.0 sq. mi.
Population density: 32 people per square mile
(very low).
OSM Map
General Map
Google Map
MSN Map
OSM Map
General Map
Google Map
MSN Map
OSM Map
General Map
Google Map
MSN Map
OSM Map
General Map
Google Map
MSN Map
Please wait while loading the map...
Real estate property taxes paid for housing units in 2022:
This zip code:
0.9% ($1,873)
Texas:
1.5% ($4,050)
Median real estate property taxes paid for housing units with mortgages in 2022: $1,850 (0.8%) Median real estate property taxes paid for housing units with no mortgage in 2022: $1,923 (1.0%)
Averages for the 2020 tax year for zip code 79323, filed in 2021:
Average Adjusted Gross Income (AGI) in 2020: $58,779 (Individual Income Tax Returns)
Here:
$58,779
State:
$77,054
Salary/wage: $51,387 (reported on 87.9% of returns)
Here:
$51,387
State:
$62,766
(% of AGI for various income ranges: 1373.7% for AGIs below $25k, 3453.9% for AGIs $25k-50k, 6048.2% for AGIs $50k-75k, 9026.4% for AGIs $75k-100k, 16458.4% for AGIs $100k-200k, 50520.0% for AGIs over 200k)
Taxable interest for individuals: $1,292 (reported on 16.9% of returns)
This zip code:
$1,292
Texas:
$2,665
(% of AGI for various income ranges: 8.0% for AGIs below $25k, 5.6% for AGIs $25k-50k, 7.2% for AGIs $50k-75k, 56.4% for AGIs $75k-100k, 78.8% for AGIs $100k-200k, 643.3% for AGIs over 200k)
Ordinary dividends: $2,760 (reported on 6.9% of returns)
Here:
$2,760
State:
$10,044
(% of AGI for various income ranges: 4.7% for AGIs below $25k, 7.4% for AGIs $25k-50k, 23.2% for AGIs $75k-100k, 120.0% for AGIs $100k-200k, 410.0% for AGIs over 200k)
Net capital gain/loss in AGI: +$12,605 (reported on 7.6% of returns)
Here:
+$12,605
State:
+$39,590
(% of AGI for various income ranges: 1.7% for AGIs below $25k, 12.1% for AGIs $25k-50k, 2.8% for AGIs $50k-75k, 45.5% for AGIs $75k-100k, 367.2% for AGIs $100k-200k, 5526.7% for AGIs over 200k)
Profit/loss from business: +$8,760 (reported on 19.7% of returns)
Here:
+$8,760
State:
+$10,888
(% of AGI for various income ranges: 56.9% for AGIs below $25k, 490.4% for AGIs $100k-200k, 12306.7% for AGIs over 200k)
Taxable individual retirement arrangement distribution: $14,375 (reported on 5.5% of returns)
79323:
$14,375
Texas:
$24,740
(% of AGI for various income ranges: 21.9% for AGIs below $25k, 61.5% for AGIs $25k-50k, 114.5% for AGIs $50k-75k, 132.7% for AGIs $75k-100k, 408.8% for AGIs $100k-200k)
Total itemized deductions: $33,540 (reported on 3.4% of returns)
Here:
$33,540
State:
$40,428
(% of AGI for various income ranges: 98.7% for AGIs $25k-50k, 291.0% for AGIs $50k-75k, 635.2% for AGIs $100k-200k)
Charity contributions: $19,440 (reported on 1.7% of returns)
Here:
$19,440
State:
$18,201
(% of AGI for various income ranges: 388.8% for AGIs $100k-200k)
Taxes paid: $4,388 (reported on 2.8% of returns)
79323:
$4,388
State:
$7,821
(% of AGI for various income ranges: 34.2% for AGIs $50k-75k, 85.6% for AGIs $100k-200k)
Earned income credit: $2,620 (reported on 20.3% of returns)
Here:
$2,620
State:
$2,584
(% of AGI for various income ranges: 130.6% for AGIs below $25k, 101.6% for AGIs $25k-50k, 3.0% for AGIs $50k-75k)
Percentage of individuals using paid preparers for their 2020 taxes: 89.7%
Here:
90%
State:
92%
(% for various income ranges: 86.3% for AGIs below $25k, 89.0% for AGIs $25k-50k, 91.8% for AGIs $50k-75k, 89.3% for AGIs $75k-100k, 94.7% for AGIs $100k-200k, 100.0% for AGIs over 200k)
Averages for the 2012 tax year for zip code 79323, filed in 2013:
Average Adjusted Gross Income (AGI) in 2012: $78,600 (Individual Income Tax Returns)
Here:
$78,600
State:
$65,384
Salary/wage: $59,753 (reported on 90.1% of returns)
Here:
$59,753
State:
$52,524
(% of AGI for various income ranges: 83.2% for AGIs below $25k, 96.3% for AGIs $25k-50k, 93.4% for AGIs $50k-75k, 89.5% for AGIs $75k-100k, 85.7% for AGIs $100k-200k, 23.1% for AGIs over 200k)
Taxable interest for individuals: $3,025 (reported on 19.1% of returns)
This zip code:
$3,025
Texas:
$2,372
(% of AGI for various income ranges: 0.3% for AGIs below $25k, 0.2% for AGIs $25k-50k, 0.2% for AGIs $75k-100k, 0.7% for AGIs $100k-200k, 1.6% for AGIs over 200k)
Ordinary dividends: $3,610 (reported on 7.7% of returns)
Here:
$3,610
State:
$9,721
(% of AGI for various income ranges: 0.6% for AGIs below $25k, 0.5% for AGIs $25k-50k, 0.4% for AGIs $50k-75k, 0.2% for AGIs $75k-100k, 0.3% for AGIs $100k-200k, 0.4% for AGIs over 200k)
Net capital gain/loss in AGI: +$37,205 (reported on 7.0% of returns)
Here:
+$37,205
State:
+$35,319
(% of AGI for various income ranges: 0.2% for AGIs $25k-50k, 1.0% for AGIs $100k-200k, 9.7% for AGIs over 200k)
Profit/loss from business: +$29,573 (reported on 16.2% of returns)
Here:
+$29,573
State:
+$13,732
(% of AGI for various income ranges: 4.8% for AGIs below $25k, 1.4% for AGIs $50k-75k, 0.5% for AGIs $75k-100k, 2.6% for AGIs $100k-200k, 16.0% for AGIs over 200k)
Taxable individual retirement arrangement distribution: $16,641 (reported on 6.2% of returns)
79323:
$16,641
Texas:
$19,511
(% of AGI for various income ranges: 3.6% for AGIs below $25k, 1.0% for AGIs $50k-75k, 1.1% for AGIs $75k-100k, 3.3% for AGIs $100k-200k)
Total itemized deductions: $25,695 (12% of AGI, reported on 14.0% of returns)
Here:
$25,695
State:
$24,724
Here:
11.6% of AGI
State:
15.9% of AGI
(% of AGI for various income ranges: 5.2% for AGIs below $25k, 5.5% for AGIs $25k-50k, 4.5% for AGIs $50k-75k, 3.6% for AGIs $75k-100k, 4.7% for AGIs $100k-200k, 4.6% for AGIs over 200k)
Charity contributions: $8,146 (reported on 9.6% of returns)
Here:
$8,146
State:
$6,808
(% of AGI for various income ranges: 0.8% for AGIs $25k-50k, 0.6% for AGIs $50k-75k, 0.7% for AGIs $75k-100k, 1.3% for AGIs $100k-200k, 1.3% for AGIs over 200k)
Taxes paid: $3,437 (reported on 12.9% of returns)
79323:
$3,437
State:
$6,921
(% of AGI for various income ranges: 0.3% for AGIs below $25k, 0.4% for AGIs $25k-50k, 0.4% for AGIs $50k-75k, 0.5% for AGIs $75k-100k, 0.9% for AGIs $100k-200k, 0.5% for AGIs over 200k)
Earned income credit: $2,502 (reported on 16.2% of returns)
Here:
$2,502
State:
$2,570
(% of AGI for various income ranges: 8.7% for AGIs below $25k, 1.3% for AGIs $25k-50k)
Percentage of individuals using paid preparers for their 2012 taxes: 70.2%
Here:
70%
State:
51%
(% for various income ranges: 66.3% for AGIs below $25k, 69.2% for AGIs $25k-50k, 68.0% for AGIs $50k-75k, 73.0% for AGIs $75k-100k, 75.6% for AGIs $100k-200k, 88.9% for AGIs over 200k)
Averages for the 2004 tax year for zip code 79323, filed in 2005:
Average Adjusted Gross Income (AGI) in 2004: $40,850 (Individual Income Tax Returns)
Here:
$40,850
State:
$47,881
Salary/wage: $35,678 (reported on 86.9% of returns)
Here:
$35,678
State:
$41,947
(% of AGI for various income ranges: 205.6% for AGIs below $10k, 83.6% for AGIs $10k-25k, 88.5% for AGIs $25k-50k, 85.8% for AGIs $50k-75k, 81.4% for AGIs $75k-100k, 48.2% for AGIs over 100k)
Taxable interest for individuals: $2,326 (reported on 26.6% of returns)
This zip code:
$2,326
Texas:
$2,255
(% of AGI for various income ranges: 6.9% for AGIs below $10k, 2.1% for AGIs $10k-25k, 0.6% for AGIs $25k-50k, 0.8% for AGIs $50k-75k, 1.5% for AGIs $75k-100k, 2.3% for AGIs over 100k)
Taxable dividends: $2,579 (reported on 11.1% of returns)
Here:
$2,579
State:
$4,261
(% of AGI for various income ranges: 2.9% for AGIs below $10k, 0.5% for AGIs $10k-25k, 0.6% for AGIs $25k-50k, 0.3% for AGIs $50k-75k, 0.5% for AGIs $75k-100k, 1.2% for AGIs over 100k)
Net capital gain/loss: +$1,977 (reported on 9.4% of returns)
Here:
+$1,977
State:
+$16,110
(% of AGI for various income ranges: -4.1% for AGIs below $10k, 0.4% for AGIs $10k-25k, 0.0% for AGIs $25k-50k, -0.2% for AGIs $50k-75k, 0.1% for AGIs $75k-100k, 1.6% for AGIs over 100k)
Profit/loss from business: +$11,168 (reported on 17.4% of returns)
Here:
+$11,168
State:
+$11,013
(% of AGI for various income ranges: -6.2% for AGIs below $10k, 4.0% for AGIs $10k-25k, 1.6% for AGIs $25k-50k, 2.6% for AGIs $50k-75k, 3.3% for AGIs $75k-100k, 10.2% for AGIs over 100k)
IRA payment deduction: $3,333 (reported on 2.0% of returns)
79323:
$3,333
Texas:
$3,120
(% of AGI for various income ranges: 0.5% for AGIs $10k-25k, 0.2% for AGIs $50k-75k, 0.6% for AGIs $75k-100k)
Total itemized deductions: $17,831 (17% of AGI, reported on 10.4% of returns)
Here:
$17,831
State:
$19,631
Here:
17.4% of AGI
State:
18.9% of AGI
(% of AGI for various income ranges: 6.3% for AGIs $10k-25k, 2.9% for AGIs $25k-50k, 3.9% for AGIs $50k-75k, 6.2% for AGIs $75k-100k, 5.2% for AGIs over 100k)
Charity contributions deductions: $6,308 (7% of AGI, reported on 8.7% of returns)
Here:
$6,308
State:
$4,753
Here:
7.0% of AGI
State:
4.2% of AGI
(% of AGI for various income ranges: 0.9% for AGIs $10k-25k, 0.8% for AGIs $25k-50k, 0.9% for AGIs $50k-75k, 2.7% for AGIs $75k-100k, 1.7% for AGIs over 100k)
Total tax: $7,415 (reported on 66.1% of returns)
79323:
$7,415
State:
$9,058
(% of AGI for various income ranges: 6.3% for AGIs below $10k, 3.4% for AGIs $10k-25k, 5.4% for AGIs $25k-50k, 8.3% for AGIs $50k-75k, 11.6% for AGIs $75k-100k, 23.0% for AGIs over 100k)
Earned income credit: $1,841 (reported on 23.3% of returns)
Here:
$1,841
State:
$2,024
Percentage of individuals using paid preparers for their 2004 taxes: 73.4%
Here:
73%
State:
57%
(% for various income ranges: 69.0% for AGIs below $10k, 75.0% for AGIs $10k-25k, 74.0% for AGIs $25k-50k, 75.5% for AGIs $50k-75k, 72.8% for AGIs $75k-100k, 78.9% for AGIs over 100k)
Household received Food Stamps/SNAP in the past 12 months: 282 Household did not receive Food Stamps/SNAP in the past 12 months: 2,302
Women who had a birth in the past 12 months: 34 (34 now married, 0 unmarried) Women who did not have a birth in the past 12 months: 1,855 (950 now married, 900 unmarried)
Housing units in zip code 79323 with a mortgage: 448 (36 second mortgage, 30 both second mortgage and home equity loan) Median monthly owner costs for units with a mortgage: $1,610 Median monthly owner costs for units without a mortgage: $632
Residents with income below the poverty level in 2022:
This zip code:
12.1%
Whole state:
14.0%
Residents with income below 50% of the poverty level in 2022:
This zip code:
8.2%
Whole state:
7.4%
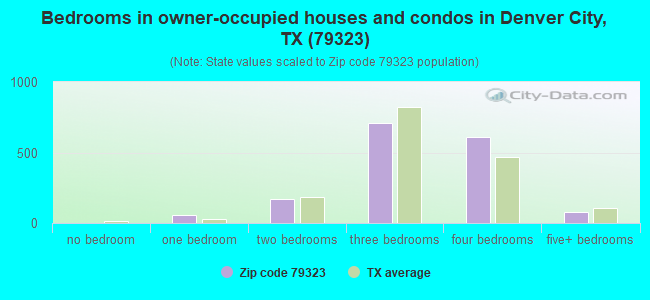
Median number of rooms in houses and condos:
Here:
5.7
State:
6.3
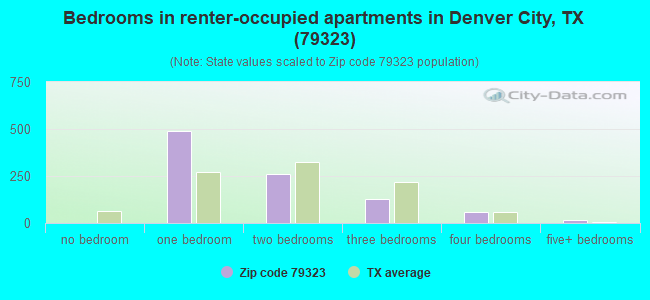
Median number of rooms in apartments:
Here:
3.1
State:
4.0
Notable locations in this zip code not listed on our city pages
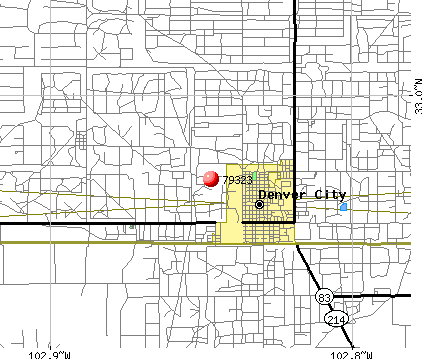
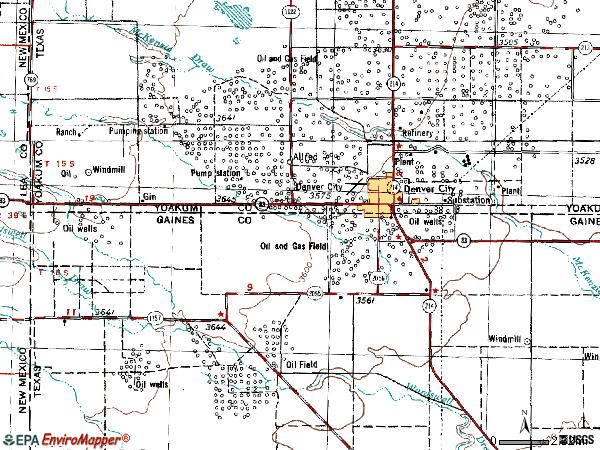
Notable locations in zip code 79323: Iron Windmill (A), West Windmill (B), Denver City Historical Museum (C), Denver City Volunteer Fire Department (D), Denver City Fire Marshal's Office (E), Denver City Emergency Medical Service (F). Display/hide their locations on the map
Churches in zip code 79323 include: Church of the Nazarene (A), Saint Williams Catholic Church (B), Trinity Baptist Church (C), Faith Baptist Church (D), Bethel Baptist Church (E), El Calvario Assembly of God Church (F), Abundant Life Fellowship (G). Display/hide their locations on the map
In group quarters: 24 (-1 institutionalized population)
Size of family households: 621 2-persons, 254 3-persons, 464 4-persons, 506 5-persons, 129 6-persons, 40 7-or-more-persons
Size of nonfamily households: 456 1-person, 81 2-persons
1,717 married couples with children.
200 single-parent households (200 women).
32.4% of residents of 79323 zip code speak English at home.
60.8% of residents speak Spanish at home (68% very well, 17% well, 9% not well, 6% not at all).
7.3% of residents speak other Indo-European language at home (23% very well, 59% well, 18% not well).
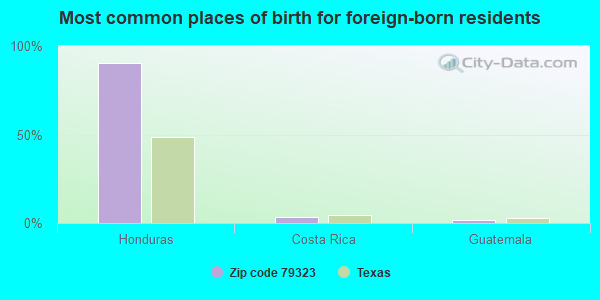
Foreign born population: 1,920 (25.7%) (23.7% of them are naturalized citizens)
This zip code:
25.7%
Whole state:
17.2%
90%Honduras
3%Costa Rica
2%Guatemala
1%Denmark
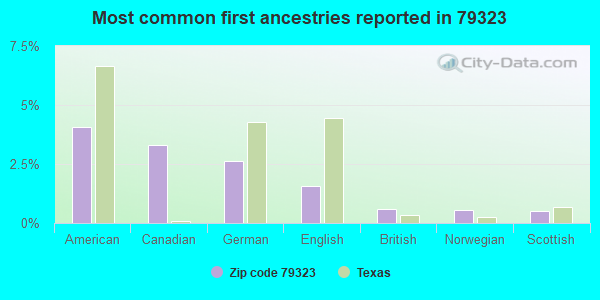
4%American
3%Canadian
3%German
2%English
1%British
1%Norwegian
1%Scottish
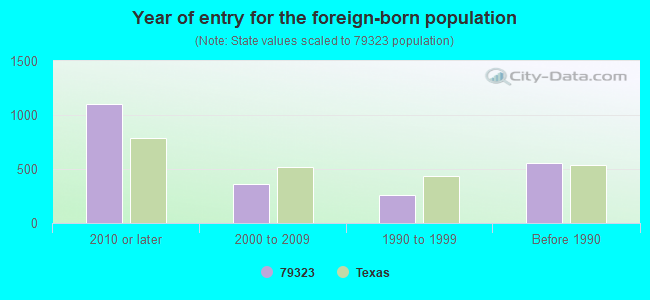
Year of entry for the foreign-born population
1,1012010 or later
3592000 to 2009
2591990 to 1999
560Before 1990
Facilities with environmental interests located in this zip code:
ARCO PIPE LINE COMPANY (MUSTANG DR in DENVER CITY, TX)
(Resource Conservation and Recovery Act (tracking hazardous waste)) Alternative names: ARCO PIPELINE CO BAUMGART STATION, NAVAJO PIPELINE BAUMGART STATION
ARCO PIPE LINE COMPANY (7 MI W BROADWAY N ALLRED RD 5 in DENVER CITY, TX)
(Resource Conservation and Recovery Act (tracking hazardous waste)) Alternative names: ARCO PIPELINE CO WEEMS STATION, NAVAJO PIPELINE WEEMS STATION
ARCO PIPE LINE COMPANY (HIGHWAY 2055 5 MILES SOUTH OF in DENVER CITY, TX)
(Resource Conservation and Recovery Act (tracking hazardous waste)) Alternative names: ARCO PIPELINE CO RILEY STATION, NAVAJO PIPELINE RILEY STATION
ARCO PIPE LINE COMPANY (CALICHE RD 7M SW OF in DENVER CITY, TX)
(Resource Conservation and Recovery Act (tracking hazardous waste)) Alternative names: ARCO PIPELINE CO RUSSELL STATION, NAVAJO PIPELINE RUSSELL STATION
ARCO PIPE LINE COMPANY (FM 2055 in DENVER CITY, TX)
(Resource Conservation and Recovery Act (tracking hazardous waste)) Alternative names: ARCO PIPELINE CO DENVER CITY MAINT
BAKER HUGHES OILFIELD OPERATIONS INC (LOVINGTON HWY .75 MILES WEST O in DENVER CITY, TX)
(Resource Conservation and Recovery Act (tracking hazardous waste)) Alternative names: BAKER SVC TOOLS
ARCO PERMIAN (214 PLAINS HWY in DENVER CITY, TX)
National Pollutant Discharge Elimination System NON-MAJOR (Tracking pollutant discharge elimination systems) - permit Business SIC classification: NATURAL GAS LIQUIDS
APACHE OIL CO (P37-6 M W HWY 83 in DENVER CITY, TX)
Small Quantity Generators, between 100 kg and 1000 kg of hazardous waste/month (Resource Conservation and Recovery Act (tracking hazardous waste)) - notification Organizations: TEXACO E&P INC (CONTACT/OWNER)
Housing units lacking complete plumbing facilities: 2.5% Housing units lacking complete kitchen facilities: 3.5%
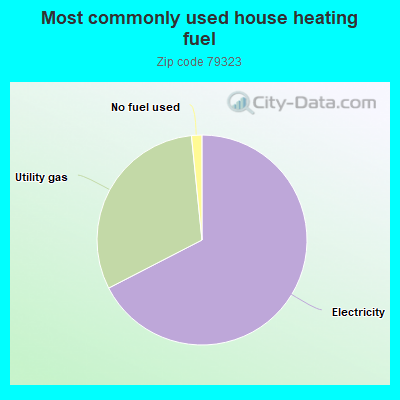
67.5%Electricity
31.0%Utility gas
1.6%No fuel used
Population in 1990: 6,697.
Place of birth for U.S.-born residents:
This state: 4,213
Northeast: 52
Midwest: 360
South: 145
West: 492
61% of the 79323 zip code residents lived in the same house 5 years ago. Out of people who lived in different houses, 66% lived in this county. Out of people who lived in different counties, 50% lived in Texas.
91% of the 79323 zip code residents lived in the same house 1 year ago. Out of people who lived in different houses, 21% moved from this county. Out of people who lived in different houses, 82% moved from different county within same state.
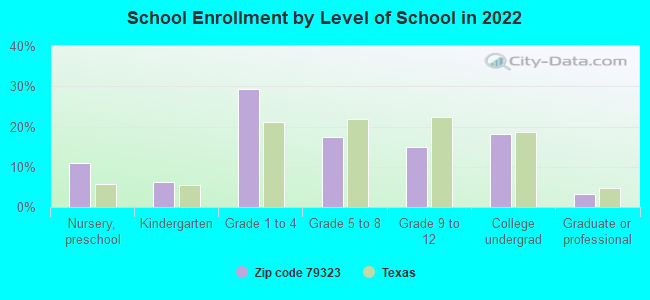
Private vs. public school enrollment:
Students in private schools in grades 1 to 8 (elementary and middle school): 128
Here:
12.1%
Texas:
8.8%
Students in private schools in grades 9 to 12 (high school):
Here:
0.0%
Texas:
8.0%
Students in private undergraduate colleges: 27
Here:
6.8%
Texas:
16.2%
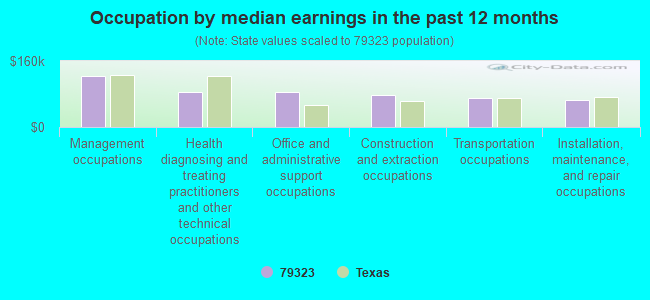
Occupation by median earnings in the past 12 months ($)
122,559Management occupations
85,407Health diagnosing and treating practitioners and other technical occupations
84,506Office and administrative support occupations
78,298Construction and extraction occupations
70,348Transportation occupations
65,350Installation, maintenance, and repair occupations
Top industries in this zip code by the number of employees in 2005:
Mining: Support Activities for Oil and Gas Operations (100-249 employees: 2 establishments, 50-99 employees: 1 establishment, 20-49 employees: 2 establishments, 10-19 employees: 2 establishments, 5-9 employees: 1 establishment, 1-4 employees: 2 establishments)
Administrative and Support and Waste Management and Remediation Services: Temporary Help Services (100-249: 1)
53 people in nursing facilities/skilled-nursing facilities
People in group quarters in 2000:
44 people in nursing homes
Fatal accident statistics in 2014:
Fatal accident count: 3
Vehicles involved in fatal accidents: 4
Fatal accidents caused by drunken drivers: 1
Fatalities: 3
Persons involved in fatal accidents: 5
Pedestrians involved in fatal accidents: 0
Fatal accident statistics in 2012:
Fatal accident count: 1
Vehicles involved in fatal accidents: 1
Fatal accidents caused by drunken drivers: 1
Fatalities: 1
Persons involved in fatal accidents: 2
Pedestrians involved in fatal accidents: 0
2002 - 2011 National Fire Incident Reporting System (NFIRS) incidents
Based on the data from the years 2002 - 2011 the average number of fire incidents per year is 60. The highest number of reported fires - 92 took place in 2008, and the least - 28 in 2003. The data has an increasing trend.
When looking into fire subcategories, the most reports belonged to: Outside Fires (71.5%), and Structure Fires (13.9%).
Fire incident types reported to NFIRS in Zip Code 79323


 Nearest zip codes: 79355, 79359, 79360, 88242, 79376, 79378.
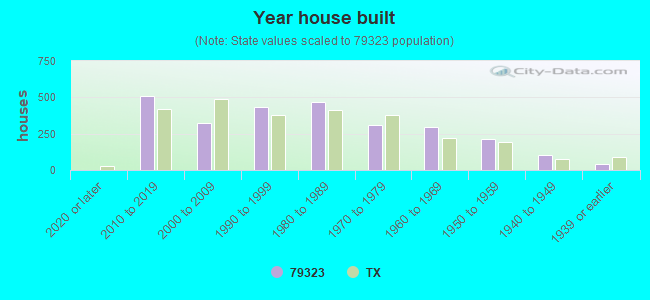


 Based on the data from the years 2002 - 2011 the average number of fire incidents per year is 60. The highest number of reported fires - 92 took place in 2008, and the least - 28 in 2003. The data has an increasing trend.
 When looking into fire subcategories, the most reports belonged to: Outside Fires (71.5%), and Structure Fires (13.9%).