Estimated zip code population in 2022: 13,407 Zip code population in 2010: 13,315 Zip code population in 2000: 14,109
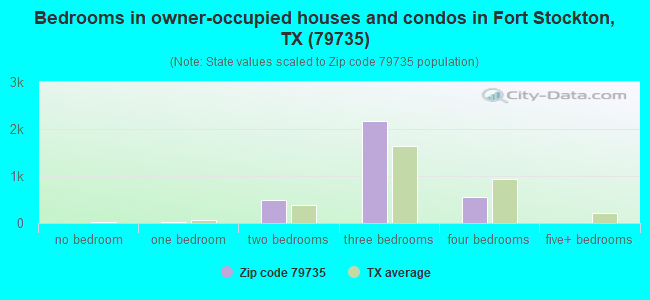
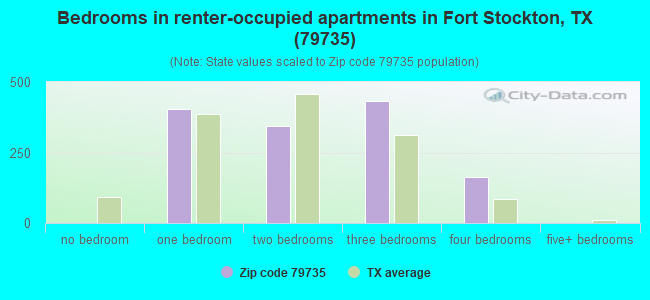
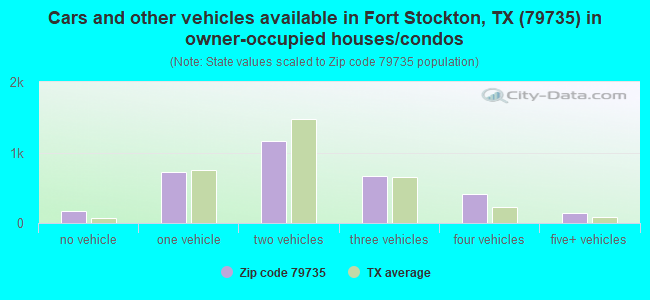
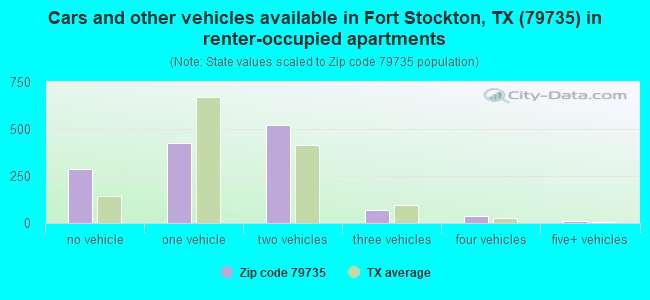
Houses and condos: 5,124 Renter-occupied apartments: 1,359
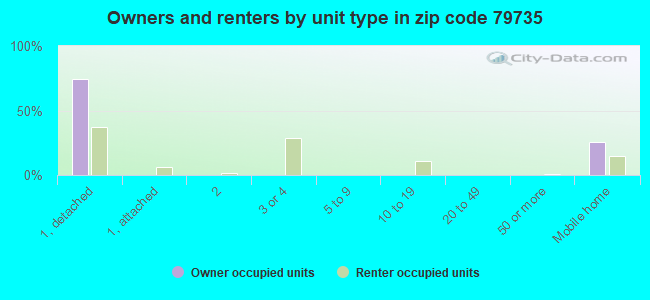
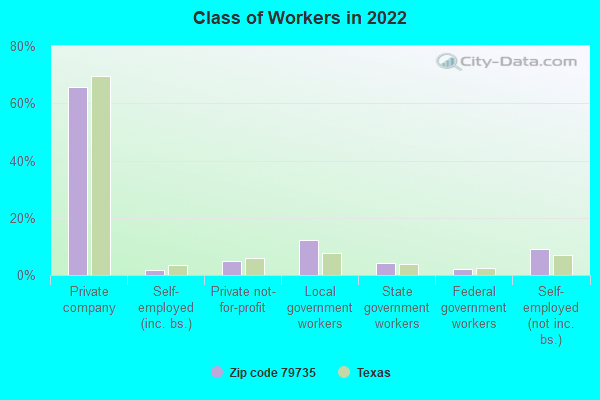
% of renters here:
29%
State:
38%
March 2022 cost of living index in zip code 79735: 78.8 (low, U.S. average is 100)
Land area: 1732.8 sq. mi. Water area: 0.0 sq. mi.
Population density: 8 people per square mile
(very low).
OSM Map
General Map
Google Map
MSN Map
OSM Map
General Map
Google Map
MSN Map
OSM Map
General Map
Google Map
MSN Map
OSM Map
General Map
Google Map
MSN Map
Please wait while loading the map...
Real estate property taxes paid for housing units in 2022:
This zip code:
0.9% ($1,491)
Texas:
1.5% ($4,050)
Median real estate property taxes paid for housing units with mortgages in 2022: $2,596 (1.2%) Median real estate property taxes paid for housing units with no mortgage in 2022: $873 (0.8%)
Averages for the 2020 tax year for zip code 79735, filed in 2021:
Average Adjusted Gross Income (AGI) in 2020: $53,537 (Individual Income Tax Returns)
Here:
$53,537
State:
$77,054
Salary/wage: $46,679 (reported on 88.3% of returns)
Here:
$46,679
State:
$62,766
(% of AGI for various income ranges: 1352.2% for AGIs below $25k, 3700.9% for AGIs $25k-50k, 6564.9% for AGIs $50k-75k, 10337.9% for AGIs $75k-100k, 16093.3% for AGIs $100k-200k, 46743.3% for AGIs over 200k)
Taxable interest for individuals: $1,274 (reported on 15.3% of returns)
This zip code:
$1,274
Texas:
$2,665
(% of AGI for various income ranges: 3.6% for AGIs below $25k, 8.8% for AGIs $25k-50k, 11.0% for AGIs $50k-75k, 21.8% for AGIs $75k-100k, 25.5% for AGIs $100k-200k, 2103.3% for AGIs over 200k)
Ordinary dividends: $4,621 (reported on 6.2% of returns)
Here:
$4,621
State:
$10,044
(% of AGI for various income ranges: 3.4% for AGIs below $25k, 3.6% for AGIs $25k-50k, 42.5% for AGIs $50k-75k, 50.7% for AGIs $75k-100k, 103.3% for AGIs $100k-200k, 1976.7% for AGIs over 200k)
Net capital gain/loss in AGI: +$32,703 (reported on 6.4% of returns)
Here:
+$32,703
State:
+$39,590
(% of AGI for various income ranges: 6.8% for AGIs below $25k, 5.7% for AGIs $25k-50k, 40.0% for AGIs $50k-75k, 110.7% for AGIs $75k-100k, 368.3% for AGIs $100k-200k, 29480.0% for AGIs over 200k)
Profit/loss from business: +$4,354 (reported on 18.1% of returns)
Here:
+$4,354
State:
+$10,888
(% of AGI for various income ranges: 28.4% for AGIs below $25k, 13.8% for AGIs $25k-50k, 141.8% for AGIs $75k-100k, 291.0% for AGIs $100k-200k, 6660.0% for AGIs over 200k)
Taxable individual retirement arrangement distribution: $20,014 (reported on 4.2% of returns)
79735:
$20,014
Texas:
$24,740
(% of AGI for various income ranges: 16.0% for AGIs below $25k, 35.8% for AGIs $25k-50k, 90.5% for AGIs $50k-75k, 108.6% for AGIs $75k-100k, 679.0% for AGIs $100k-200k)
Total itemized deductions: $35,162 (reported on 3.0% of returns)
Here:
$35,162
State:
$40,428
(% of AGI for various income ranges: 65.9% for AGIs $25k-50k, 159.5% for AGIs $50k-75k, 324.6% for AGIs $75k-100k, 335.7% for AGIs $100k-200k, 4966.7% for AGIs over 200k)
Charity contributions: $19,460 (reported on 1.9% of returns)
Here:
$19,460
State:
$18,201
(% of AGI for various income ranges: 11.0% for AGIs $25k-50k, 61.6% for AGIs $50k-75k, 340.2% for AGIs $100k-200k)
Taxes paid: $5,392 (reported on 2.5% of returns)
79735:
$5,392
State:
$7,821
(% of AGI for various income ranges: 9.8% for AGIs $25k-50k, 16.4% for AGIs $50k-75k, 42.9% for AGIs $75k-100k, 46.7% for AGIs $100k-200k, 530.0% for AGIs over 200k)
Earned income credit: $2,589 (reported on 24.0% of returns)
Here:
$2,589
State:
$2,584
(% of AGI for various income ranges: 142.9% for AGIs below $25k, 91.6% for AGIs $25k-50k)
Percentage of individuals using paid preparers for their 2020 taxes: 87.9%
Here:
88%
State:
92%
(% for various income ranges: 85.9% for AGIs below $25k, 88.8% for AGIs $25k-50k, 89.5% for AGIs $50k-75k, 87.5% for AGIs $75k-100k, 88.3% for AGIs $100k-200k, 100.0% for AGIs over 200k)
Averages for the 2012 tax year for zip code 79735, filed in 2013:
Average Adjusted Gross Income (AGI) in 2012: $49,036 (Individual Income Tax Returns)
Here:
$49,036
State:
$65,384
Salary/wage: $41,596 (reported on 90.5% of returns)
Here:
$41,596
State:
$52,524
(% of AGI for various income ranges: 85.7% for AGIs below $25k, 87.6% for AGIs $25k-50k, 88.7% for AGIs $50k-75k, 88.2% for AGIs $75k-100k, 77.8% for AGIs $100k-200k, 31.5% for AGIs over 200k)
Taxable interest for individuals: $988 (reported on 14.9% of returns)
This zip code:
$988
Texas:
$2,372
(% of AGI for various income ranges: 0.3% for AGIs below $25k, 0.3% for AGIs $25k-50k, 0.1% for AGIs $50k-75k, 0.2% for AGIs $75k-100k, 0.3% for AGIs $100k-200k, 0.5% for AGIs over 200k)
Ordinary dividends: $5,541 (reported on 6.8% of returns)
Here:
$5,541
State:
$9,721
(% of AGI for various income ranges: 0.6% for AGIs below $25k, 0.4% for AGIs $25k-50k, 0.1% for AGIs $50k-75k, 0.3% for AGIs $75k-100k, 1.3% for AGIs $100k-200k, 1.9% for AGIs over 200k)
Net capital gain/loss in AGI: +$12,906 (reported on 6.2% of returns)
Here:
+$12,906
State:
+$35,319
(% of AGI for various income ranges: 0.4% for AGIs $25k-50k, 0.8% for AGIs $75k-100k, 0.6% for AGIs $100k-200k, 8.4% for AGIs over 200k)
Profit/loss from business: +$11,237 (reported on 15.1% of returns)
Here:
+$11,237
State:
+$13,732
(% of AGI for various income ranges: 6.2% for AGIs below $25k, 3.4% for AGIs $25k-50k, 1.3% for AGIs $50k-75k, 1.8% for AGIs $75k-100k, 4.8% for AGIs $100k-200k, 4.1% for AGIs over 200k)
Taxable individual retirement arrangement distribution: $8,811 (reported on 5.6% of returns)
79735:
$8,811
Texas:
$19,511
(% of AGI for various income ranges: 1.3% for AGIs below $25k, 0.9% for AGIs $25k-50k, 1.2% for AGIs $50k-75k, 0.9% for AGIs $75k-100k, 1.6% for AGIs $100k-200k)
Total itemized deductions: $22,243 (22% of AGI, reported on 13.1% of returns)
Here:
$22,243
State:
$24,724
Here:
21.6% of AGI
State:
15.9% of AGI
(% of AGI for various income ranges: 2.5% for AGIs below $25k, 4.9% for AGIs $25k-50k, 7.2% for AGIs $50k-75k, 7.2% for AGIs $75k-100k, 8.2% for AGIs $100k-200k, 3.7% for AGIs over 200k)
Charity contributions: $5,583 (reported on 7.2% of returns)
Here:
$5,583
State:
$6,808
(% of AGI for various income ranges: 0.6% for AGIs $25k-50k, 0.6% for AGIs $50k-75k, 0.9% for AGIs $75k-100k, 1.3% for AGIs $100k-200k, 1.2% for AGIs over 200k)
Taxes paid: $3,800 (reported on 12.1% of returns)
79735:
$3,800
State:
$6,921
(% of AGI for various income ranges: 0.3% for AGIs below $25k, 0.7% for AGIs $25k-50k, 0.8% for AGIs $50k-75k, 0.9% for AGIs $75k-100k, 1.5% for AGIs $100k-200k, 1.0% for AGIs over 200k)
Earned income credit: $2,474 (reported on 26.6% of returns)
Here:
$2,474
State:
$2,570
(% of AGI for various income ranges: 9.8% for AGIs below $25k, 1.6% for AGIs $25k-50k)
Percentage of individuals using paid preparers for their 2012 taxes: 64.8%
Here:
65%
State:
51%
(% for various income ranges: 63.1% for AGIs below $25k, 64.6% for AGIs $25k-50k, 64.0% for AGIs $50k-75k, 64.3% for AGIs $75k-100k, 71.8% for AGIs $100k-200k, 87.5% for AGIs over 200k)
Averages for the 2004 tax year for zip code 79735, filed in 2005:
Average Adjusted Gross Income (AGI) in 2004: $29,870 (Individual Income Tax Returns)
Here:
$29,870
State:
$47,881
Salary/wage: $26,517 (reported on 89.1% of returns)
Here:
$26,517
State:
$41,947
(% of AGI for various income ranges: 124.7% for AGIs below $10k, 87.2% for AGIs $10k-25k, 87.8% for AGIs $25k-50k, 82.9% for AGIs $50k-75k, 77.9% for AGIs $75k-100k, 44.9% for AGIs over 100k)
Taxable interest for individuals: $1,944 (reported on 19.0% of returns)
This zip code:
$1,944
Texas:
$2,255
(% of AGI for various income ranges: 3.1% for AGIs below $10k, 0.8% for AGIs $10k-25k, 0.6% for AGIs $25k-50k, 0.8% for AGIs $50k-75k, 1.1% for AGIs $75k-100k, 3.0% for AGIs over 100k)
Taxable dividends: $2,803 (reported on 9.7% of returns)
Here:
$2,803
State:
$4,261
(% of AGI for various income ranges: 2.0% for AGIs below $10k, 0.3% for AGIs $10k-25k, 0.4% for AGIs $25k-50k, 0.6% for AGIs $50k-75k, 0.8% for AGIs $75k-100k, 2.5% for AGIs over 100k)
Net capital gain/loss: +$4,507 (reported on 8.1% of returns)
Here:
+$4,507
State:
+$16,110
(% of AGI for various income ranges: 0.2% for AGIs below $10k, 0.0% for AGIs $10k-25k, 0.4% for AGIs $25k-50k, 1.1% for AGIs $50k-75k, 0.6% for AGIs $75k-100k, 4.6% for AGIs over 100k)
Profit/loss from business: +$7,710 (reported on 14.4% of returns)
Here:
+$7,710
State:
+$11,013
(% of AGI for various income ranges: 4.4% for AGIs below $10k, 4.0% for AGIs $10k-25k, 2.0% for AGIs $25k-50k, 1.7% for AGIs $50k-75k, 2.3% for AGIs $75k-100k, 9.4% for AGIs over 100k)
IRA payment deduction: $3,036 (reported on 1.3% of returns)
79735:
$3,036
Texas:
$3,120
Self-employed pension: $15,818 (reported on 0.3% of returns)
Here:
$15,818
Texas:
$16,401
Total itemized deductions: $17,251 (23% of AGI, reported on 8.3% of returns)
Here:
$17,251
State:
$19,631
Here:
23.0% of AGI
State:
18.9% of AGI
(% of AGI for various income ranges: 2.1% for AGIs $10k-25k, 5.1% for AGIs $25k-50k, 5.3% for AGIs $50k-75k, 6.6% for AGIs $75k-100k, 6.1% for AGIs over 100k)
Charity contributions deductions: $4,576 (6% of AGI, reported on 5.9% of returns)
Here:
$4,576
State:
$4,753
Here:
5.5% of AGI
State:
4.2% of AGI
(% of AGI for various income ranges: 0.2% for AGIs $10k-25k, 0.5% for AGIs $25k-50k, 0.9% for AGIs $50k-75k, 1.5% for AGIs $75k-100k, 2.1% for AGIs over 100k)
Total tax: $4,388 (reported on 59.7% of returns)
79735:
$4,388
State:
$9,058
(% of AGI for various income ranges: 3.0% for AGIs below $10k, 2.8% for AGIs $10k-25k, 5.4% for AGIs $25k-50k, 8.7% for AGIs $50k-75k, 11.5% for AGIs $75k-100k, 20.0% for AGIs over 100k)
Earned income credit: $1,944 (reported on 34.4% of returns)
Here:
$1,944
State:
$2,024
Percentage of individuals using paid preparers for their 2004 taxes: 65.2%
Here:
65%
State:
57%
(% for various income ranges: 62.0% for AGIs below $10k, 66.1% for AGIs $10k-25k, 63.9% for AGIs $25k-50k, 70.8% for AGIs $50k-75k, 65.2% for AGIs $75k-100k, 75.4% for AGIs over 100k)
Likely homosexual households (counted as self-reported same-sex unmarried-partner households)
Lesbian couples: 0.2% of all households
Gay men: 0.0% of all households
Household received Food Stamps/SNAP in the past 12 months: 613 Household did not receive Food Stamps/SNAP in the past 12 months: 4,018
Women who had a birth in the past 12 months: 110 (112 now married, 0 unmarried) Women who did not have a birth in the past 12 months: 2,428 (978 now married, 1,452 unmarried)
Housing units in zip code 79735 with a mortgage: 1,412 Median monthly owner costs for units with a mortgage: $1,460 Median monthly owner costs for units without a mortgage: $452
Residents with income below the poverty level in 2022:
This zip code:
25.3%
Whole state:
14.0%
Residents with income below 50% of the poverty level in 2022:
This zip code:
13.7%
Whole state:
7.4%
Median number of rooms in houses and condos:
Here:
6.4
State:
6.3
Median number of rooms in apartments:
Here:
4.7
State:
4.0
Notable locations in this zip code not listed on our city pages
In group quarters: 2,300 (-1 institutionalized population)
Size of family households: 1,649 2-persons, 372 3-persons, 622 4-persons, 287 5-persons, 104 6-persons, 159 7-or-more-persons
Size of nonfamily households: 1,140 1-person, 303 2-persons
1,603 married couples with children.
610 single-parent households (58 men, 552 women).
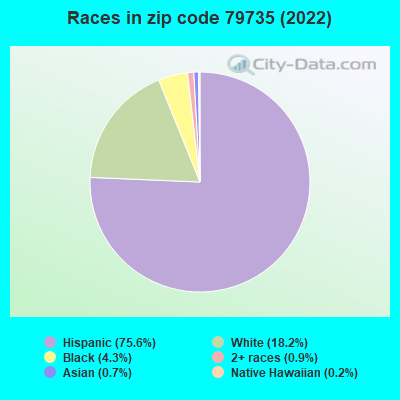
47.1% of residents of 79735 zip code speak English at home.
51.9% of residents speak Spanish at home (82% very well, 11% well, 3% not well, 3% not at all).
0.6% of residents speak other Indo-European language at home (82% very well, 18% not well).
0.4% of residents speak Asian or Pacific Island language at home (74% very well, 26% well).
0.3% of residents speak other language at home (100% very well).
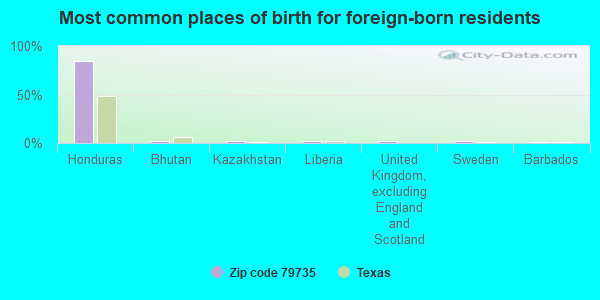
Foreign born population: 1,615 (12.1%) (63.1% of them are naturalized citizens)
This zip code:
12.1%
Whole state:
17.2%
85%Honduras
2%Bhutan
2%Kazakhstan
2%Liberia
2%United Kingdom, excluding England and Scotland
2%Sweden
1%Barbados
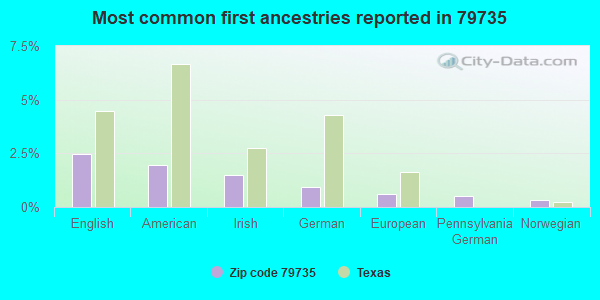
2%English
2%American
2%Irish
1%German
1%European
1%Pennsylvania German
0%Norwegian
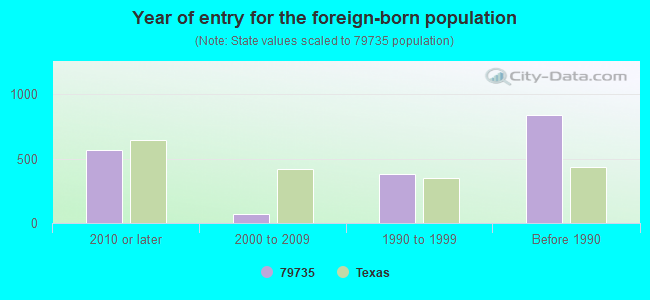
Year of entry for the foreign-born population
5692010 or later
672000 to 2009
3781990 to 1999
840Before 1990
Facilities with environmental interests located in this zip code:
ALAMO EL (804 S STATE HIGHWAY 385 in FT STOCKTON, TX)
(National Center for Education Statistics) - STATE ID-186902102 Organizations: FT STOCKTON ISD (SCHOOL DISTRICT)
APACHE EL (101 W DIVISION ST in FT STOCKTON, TX)
(National Center for Education Statistics) - STATE ID-186902104 Organizations: FT STOCKTON ISD (SCHOOL DISTRICT)
AEP TEXAS NORTH COMPANY (US HIGHWAY 285 5 MI NW OF in FORT STOCKTON, TX)
Conditionally Exempt Small Quantity Generators, less than 100 kg/month of hazardous waste (Resource Conservation and Recovery Act (tracking hazardous waste)) TRANSPORTER (Resource Conservation and Recovery Act (tracking hazardous waste)) - notification Business NAICS classification: FOSSIL FUEL ELECTRIC POWER GENERATION. Organizations: RIO PECOS POWER STATION (CONTACT/OPERATOR)
Alternative names: FORT STOCKTON POWER PLANT
AMERICAN GATHERING L.P. (FROM GRAND FALLS: 8 MI. S. ON in FORT STOCKTON, TX)
AIR MINOR (AIRS/AFS) Business SIC classification: NATURAL GAS TRANSMISSION
BAROID DRILLING FLUIDS INC (702 RAILROAD AVENUE in FORT STOCKTON, TX)
(Resource Conservation and Recovery Act (tracking hazardous waste)) Alternative names: NL BAROID FT STOCKTON SVC CNTR
BAKERSFIELD COMP STA (FM 2886 7M S in BAKERSFIELD, TX)
Small Quantity Generators, between 100 kg and 1000 kg of hazardous waste/month (Resource Conservation and Recovery Act (tracking hazardous waste)) - notification Organizations: OASIS PIPELINE (CONTACT/OWNER)
Housing units lacking complete plumbing facilities: 3.3% Housing units lacking complete kitchen facilities: 5.5%
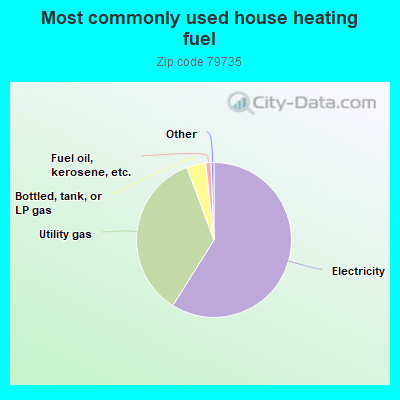
59.0%Electricity
35.4%Utility gas
4.0%Bottled, tank, or LP gas
1.1%Fuel oil, kerosene, etc.
Population in 1990: 11,755. Population change in the 1990s: +2,354 (+20.0%).
Place of birth for U.S.-born residents:
This state: 9,730
Northeast: 40
Midwest: 462
South: 486
West: 741
58% of the 79735 zip code residents lived in the same house 5 years ago. Out of people who lived in different houses, 43% lived in this county. Out of people who lived in different counties, 50% lived in Texas.
89% of the 79735 zip code residents lived in the same house 1 year ago. Out of people who lived in different houses, 12% moved from this county. Out of people who lived in different houses, 83% moved from different county within same state. Out of people who lived in different houses, 7% moved from different state. Out of people who lived in different houses, 2% moved from abroad.
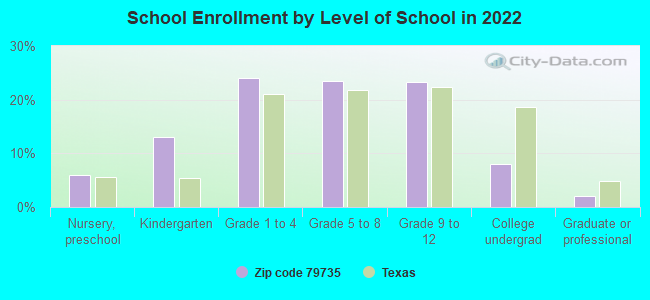
Private vs. public school enrollment:
Students in private schools in grades 1 to 8 (elementary and middle school): 19
Here:
1.4%
Texas:
8.8%
Students in private schools in grades 9 to 12 (high school):
Here:
0.0%
Texas:
8.0%
Students in private undergraduate colleges: 13
Here:
5.8%
Texas:
16.2%
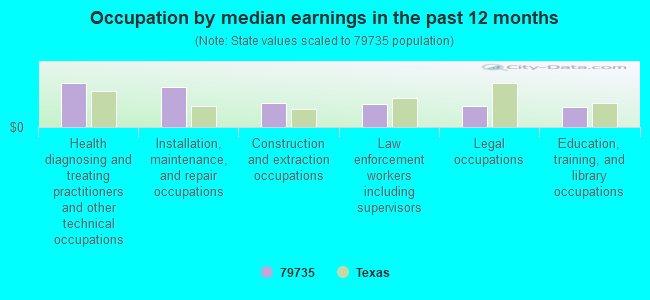
Occupation by median earnings in the past 12 months ($)
123,170Health diagnosing and treating practitioners and other technical occupations
111,676Installation, maintenance, and repair occupations
66,841Construction and extraction occupations
65,704Law enforcement workers including supervisors
57,702Legal occupations
56,222Education, training, and library occupations
Companies with federal contracts located in this zip code:
PECOS COUNTY MEMORIAL HOSPITAL (387 W INTERSTATE 10 in FORT STOCKTON, TX) 175 employees, $5400000 revenue: $47,000 in 6 contractsfrom 1999 to 2002
Contracts for Radiology Services, Anesthesiology Services by Department of Veterans Affairs Signed by year:2000: $9,000; 2001: $19,000; 2002: $6,000; 2003: $0; 2004: $0; 2005: $0; 2006: $0.
Biggest contracts:
$13,000 with Department of Veterans Affairs for Radiology Services. Signed on 1999-10-15. Completion date: 2001-05-15.
$10,000 with Department of Veterans Affairs for Anesthesiology Services. Signed on 2001-12-15. Completion date: 2002-04-15.
$9,000, same as above.Signed on 2001-10-15. Completion date: 2001-12-15.
$6,000, same as above.Signed on 2002-04-15. Completion date: 2002-06-15.
Top industries in this zip code by the number of employees in 2005:
Mining: Drilling Oil and Gas Wells (250-499 employees: 1 establishment)
Accommodation and Food Services: Hotels (except Casino Hotels) and Motels (100-249: 1, 20-49: 1, 10-19: 5, 5-9: 1)
68 people in nursing facilities/skilled-nursing facilities
People in group quarters in 2000:
1,344 people in state prisons
551 people in federal prisons and detention centers
78 people in nursing homes
14 people in local jails and other confinement facilities (including police lockups)
9 people in homes for abused, dependent, and neglected children
4 people in religious group quarters
2 people in wards in general hospitals for patients who have no usual home elsewhere
2004 - 2018 National Fire Incident Reporting System (NFIRS) incidents
Based on the data from the years 2004 - 2018 the average number of fire incidents per year is 31. The highest number of reported fires - 86 took place in 2006, and the least - 3 in 2013. The data has a constant trend.
When looking into fire subcategories, the most incidents belonged to: Outside Fires (60.8%), and Structure Fires (20.3%).
Fire incident types reported to NFIRS in Zip Code 79735


 Nearest zip codes: 79743, 79730, 79742, 79831, 79848, 79842.
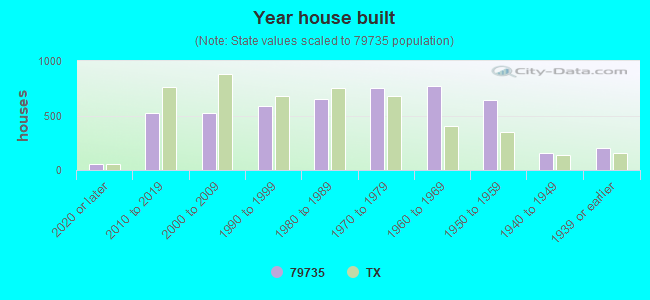


 Based on the data from the years 2004 - 2018 the average number of fire incidents per year is 31. The highest number of reported fires - 86 took place in 2006, and the least - 3 in 2013. The data has a constant trend.
 When looking into fire subcategories, the most incidents belonged to: Outside Fires (60.8%), and Structure Fires (20.3%).