Estimated zip code population in 2022: 2,889 Zip code population in 2010: 2,503 Zip code population in 2000: 2,670
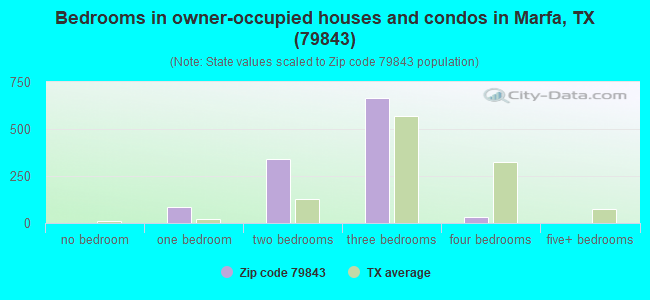
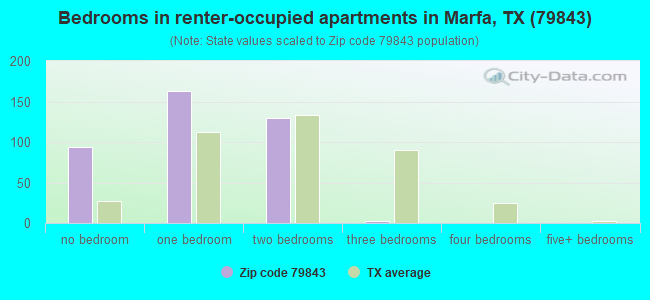
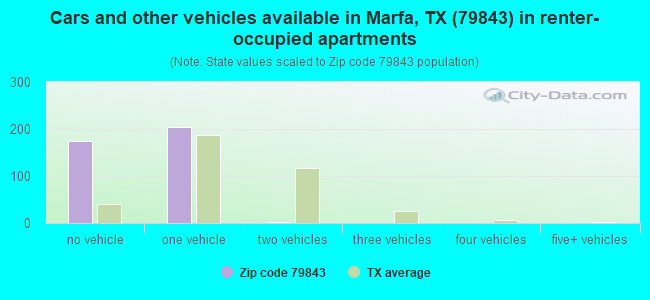
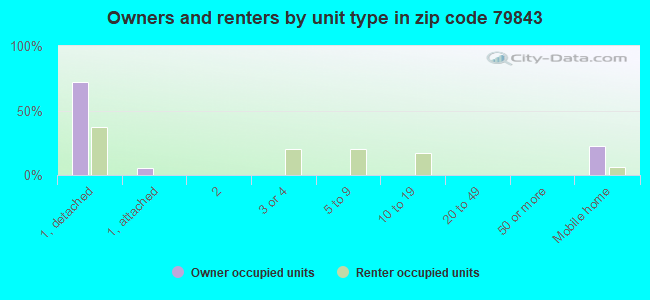
Houses and condos: 1,913 Renter-occupied apartments: 373
% of renters here:
25%
State:
38%
March 2022 cost of living index in zip code 79843: 82.6 (low, U.S. average is 100)
Land area: 1473.6 sq. mi. Water area: 0.6 sq. mi.
Population density: 2 people per square mile
(very low).
OSM Map
General Map
Google Map
MSN Map
OSM Map
General Map
Google Map
MSN Map
OSM Map
General Map
Google Map
MSN Map
OSM Map
General Map
Google Map
MSN Map
Please wait while loading the map...
Real estate property taxes paid for housing units in 2022:
This zip code:
1.0% ($2,442)
Texas:
1.5% ($4,050)
Median real estate property taxes paid for housing units with mortgages in 2022: $2,676 (0.6%) Median real estate property taxes paid for housing units with no mortgage in 2022: $2,413 (1.3%)
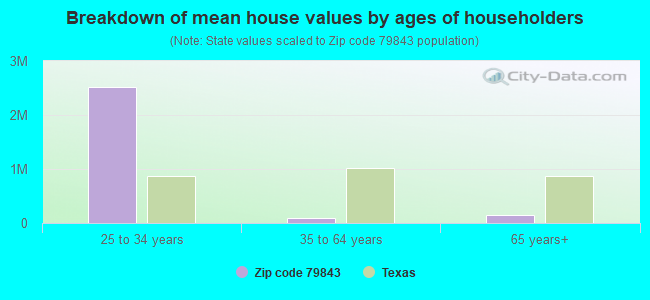
Estimated median house/condo value in 2022: $249,017
79843:
$249,017
Texas:
$275,400
According to our research of Texas and other state lists, there were 4 registered sex offenders living in 79843 zip code as of April 27, 2024. The ratio of all residents to sex offenders in zip code 79843 is 579 to 1. The ratio of registered sex offenders to all residents in this zip code is lower than the state average.
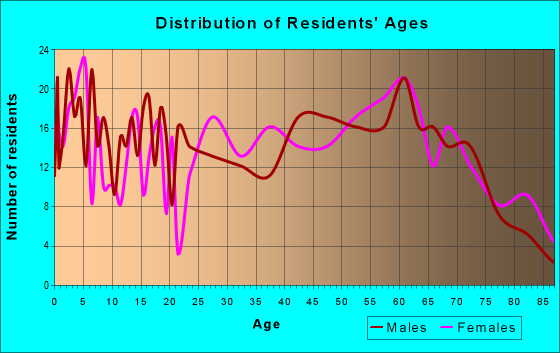
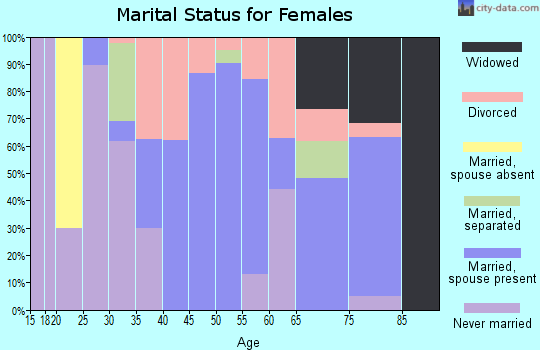
Median resident age:
This zip code:
55.0 years
Texas median age:
35.6 years
Average household size:
This zip code:
1.9 people
Texas:
2.6 people
Averages for the 2020 tax year for zip code 79843, filed in 2021:
Average Adjusted Gross Income (AGI) in 2020: $101,067 (Individual Income Tax Returns)
Here:
$101,067
State:
$77,054
Salary/wage: $45,991 (reported on 77.0% of returns)
Here:
$45,991
State:
$62,766
(% of AGI for various income ranges: 1318.6% for AGIs below $25k, 3483.5% for AGIs $25k-50k, 6298.3% for AGIs $50k-75k, 7854.0% for AGIs $75k-100k, 12911.4% for AGIs $100k-200k)
Taxable interest for individuals: $1,343 (reported on 23.0% of returns)
This zip code:
$1,343
Texas:
$2,665
(% of AGI for various income ranges: 5.9% for AGIs below $25k, 8.5% for AGIs $25k-50k, 16.7% for AGIs $50k-75k, 128.0% for AGIs $75k-100k, 157.1% for AGIs $100k-200k)
Ordinary dividends: $29,782 (reported on 13.9% of returns)
Here:
$29,782
State:
$10,044
(% of AGI for various income ranges: 9.7% for AGIs below $25k, 21.2% for AGIs $25k-50k, 221.7% for AGIs $50k-75k, 595.7% for AGIs $100k-200k)
Net capital gain/loss in AGI: +$44,581 (reported on 13.1% of returns)
Here:
+$44,581
State:
+$39,590
(% of AGI for various income ranges: 5.2% for AGIs below $25k, 58.8% for AGIs $25k-50k, 315.8% for AGIs $50k-75k, 1015.7% for AGIs $100k-200k)
Profit/loss from business: +$14,612 (reported on 27.0% of returns)
Here:
+$14,612
State:
+$10,888
(% of AGI for various income ranges: 253.8% for AGIs below $25k, 293.8% for AGIs $25k-50k, 730.8% for AGIs $50k-75k, 802.0% for AGIs $75k-100k, 2022.9% for AGIs $100k-200k)
Taxable individual retirement arrangement distribution: $12,160 (reported on 4.1% of returns)
79843:
$12,160
Texas:
$24,740
(% of AGI for various income ranges: 73.1% for AGIs below $25k, 792.0% for AGIs $75k-100k)
Total itemized deductions: $48,450 (reported on 3.3% of returns)
Here:
$48,450
State:
$40,428
(% of AGI for various income ranges: 2768.6% for AGIs $100k-200k)
Charity contributions: $35,067 (reported on 2.5% of returns)
Here:
$35,067
State:
$18,201
(% of AGI for various income ranges: 1502.9% for AGIs $100k-200k)
Taxes paid: $6,450 (reported on 3.3% of returns)
79843:
$6,450
State:
$7,821
(% of AGI for various income ranges: 368.6% for AGIs $100k-200k)
Earned income credit: $2,062 (reported on 21.3% of returns)
Here:
$2,062
State:
$2,584
(% of AGI for various income ranges: 118.3% for AGIs below $25k, 74.2% for AGIs $25k-50k)
Percentage of individuals using paid preparers for their 2020 taxes: 91.0%
Here:
91%
State:
92%
(% for various income ranges: 87.0% for AGIs below $25k, 94.1% for AGIs $25k-50k, 94.7% for AGIs $50k-75k, 87.5% for AGIs $75k-100k, 100.0% for AGIs $100k-200k, 80.0% for AGIs over 200k)
Averages for the 2012 tax year for zip code 79843, filed in 2013:
Average Adjusted Gross Income (AGI) in 2012: $55,164 (Individual Income Tax Returns)
Here:
$55,164
State:
$65,384
Salary/wage: $31,394 (reported on 83.6% of returns)
Here:
$31,394
State:
$52,524
(% of AGI for various income ranges: 80.6% for AGIs below $25k, 80.0% for AGIs $25k-50k, 67.9% for AGIs $50k-75k, 65.0% for AGIs $75k-100k, 20.6% for AGIs $100k-200k)
Taxable interest for individuals: $1,060 (reported on 21.6% of returns)
This zip code:
$1,060
Texas:
$2,372
(% of AGI for various income ranges: 0.5% for AGIs below $25k, 0.4% for AGIs $25k-50k, 0.5% for AGIs $50k-75k, 0.6% for AGIs $75k-100k, 0.3% for AGIs $100k-200k)
Ordinary dividends: $8,485 (reported on 11.2% of returns)
Here:
$8,485
State:
$9,721
(% of AGI for various income ranges: 0.4% for AGIs below $25k, 1.0% for AGIs $25k-50k, 2.0% for AGIs $50k-75k, 2.9% for AGIs $75k-100k, 2.0% for AGIs $100k-200k)
Net capital gain/loss in AGI: +$15,527 (reported on 9.5% of returns)
Here:
+$15,527
State:
+$35,319
(% of AGI for various income ranges: 3.0% for AGIs $50k-75k, 4.6% for AGIs $100k-200k)
Profit/loss from business: +$7,742 (reported on 22.4% of returns)
Here:
+$7,742
State:
+$13,732
(% of AGI for various income ranges: 9.3% for AGIs below $25k, 3.0% for AGIs $25k-50k, 7.5% for AGIs $50k-75k, 1.4% for AGIs $100k-200k)
Taxable individual retirement arrangement distribution: $5,760 (reported on 4.3% of returns)
79843:
$5,760
Texas:
$19,511
Total itemized deductions: $22,483 (19% of AGI, reported on 10.3% of returns)
Here:
$22,483
State:
$24,724
Here:
19.3% of AGI
State:
15.9% of AGI
(% of AGI for various income ranges: 8.9% for AGIs $25k-50k, 5.4% for AGIs $75k-100k, 4.2% for AGIs $100k-200k)
Charity contributions: $5,856 (reported on 7.8% of returns)
Here:
$5,856
State:
$6,808
(% of AGI for various income ranges: 0.7% for AGIs below $25k, 0.7% for AGIs $50k-75k, 1.4% for AGIs $100k-200k)
Taxes paid: $4,967 (reported on 10.3% of returns)
79843:
$4,967
State:
$6,921
(% of AGI for various income ranges: 1.5% for AGIs $25k-50k, 1.6% for AGIs $75k-100k, 1.0% for AGIs $100k-200k)
Earned income credit: $2,133 (reported on 25.9% of returns)
Here:
$2,133
State:
$2,570
(% of AGI for various income ranges: 7.6% for AGIs below $25k, 1.1% for AGIs $25k-50k)
Percentage of individuals using paid preparers for their 2012 taxes: 63.8%
Here:
64%
State:
51%
(% for various income ranges: 61.8% for AGIs below $25k, 62.5% for AGIs $25k-50k, 69.2% for AGIs $50k-75k, 71.4% for AGIs $75k-100k, 66.7% for AGIs $100k-200k)
Averages for the 2004 tax year for zip code 79843, filed in 2005:
Average Adjusted Gross Income (AGI) in 2004: $34,535 (Individual Income Tax Returns)
Here:
$34,535
State:
$47,881
Salary/wage: $26,965 (reported on 81.9% of returns)
Here:
$26,965
State:
$41,947
(% of AGI for various income ranges: 170.4% for AGIs below $10k, 82.3% for AGIs $10k-25k, 76.7% for AGIs $25k-50k, 71.4% for AGIs $50k-75k, 67.9% for AGIs $75k-100k, 29.9% for AGIs over 100k)
Taxable interest for individuals: $2,164 (reported on 28.8% of returns)
This zip code:
$2,164
Texas:
$2,255
(% of AGI for various income ranges: 7.7% for AGIs below $10k, 0.8% for AGIs $10k-25k, 1.8% for AGIs $25k-50k, 0.7% for AGIs $50k-75k, 2.2% for AGIs $75k-100k, 2.6% for AGIs over 100k)
Taxable dividends: $4,669 (reported on 12.6% of returns)
Here:
$4,669
State:
$4,261
(% of AGI for various income ranges: 7.2% for AGIs below $10k, 0.9% for AGIs $10k-25k, 1.8% for AGIs $25k-50k, 1.6% for AGIs $50k-75k, 1.9% for AGIs $75k-100k, 1.7% for AGIs over 100k)
Net capital gain/loss: +$31,458 (reported on 11.9% of returns)
Here:
+$31,458
State:
+$16,110
(% of AGI for various income ranges: 2.1% for AGIs below $10k, 1.0% for AGIs $25k-50k, 3.0% for AGIs $50k-75k, 1.1% for AGIs $75k-100k, 35.3% for AGIs over 100k)
Profit/loss from business: +$2,412 (reported on 19.5% of returns)
Here:
+$2,412
State:
+$11,013
(% of AGI for various income ranges: 9.7% for AGIs below $10k, 4.9% for AGIs $10k-25k, 2.4% for AGIs $25k-50k, 0.6% for AGIs $50k-75k, -1.5% for AGIs $75k-100k)
IRA payment deduction: $3,043 (reported on 2.1% of returns)
79843:
$3,043
Texas:
$3,120
Total itemized deductions: $17,817 (24% of AGI, reported on 10.4% of returns)
Here:
$17,817
State:
$19,631
Here:
23.7% of AGI
State:
18.9% of AGI
(% of AGI for various income ranges: 4.5% for AGIs $10k-25k, 7.0% for AGIs $25k-50k, 7.2% for AGIs $50k-75k, 7.0% for AGIs $75k-100k, 3.0% for AGIs over 100k)
Charity contributions deductions: $2,242 (3% of AGI, reported on 8.6% of returns)
Here:
$2,242
State:
$4,753
Here:
2.8% of AGI
State:
4.2% of AGI
(% of AGI for various income ranges: 2.4% for AGIs below $10k, 0.7% for AGIs $25k-50k, 0.8% for AGIs $50k-75k, 0.8% for AGIs $75k-100k, 0.4% for AGIs over 100k)
Total tax: $6,026 (reported on 63.8% of returns)
79843:
$6,026
State:
$9,058
(% of AGI for various income ranges: 6.3% for AGIs below $10k, 3.4% for AGIs $10k-25k, 6.5% for AGIs $25k-50k, 9.1% for AGIs $50k-75k, 11.7% for AGIs $75k-100k, 20.5% for AGIs over 100k)
Earned income credit: $1,864 (reported on 28.6% of returns)
Here:
$1,864
State:
$2,024
Percentage of individuals using paid preparers for their 2004 taxes: 66.7%
Here:
67%
State:
57%
(% for various income ranges: 65.4% for AGIs below $10k, 72.9% for AGIs $10k-25k, 63.8% for AGIs $25k-50k, 57.1% for AGIs $50k-75k, 61.5% for AGIs $75k-100k, 69.8% for AGIs over 100k)
Household received Food Stamps/SNAP in the past 12 months: 134 Household did not receive Food Stamps/SNAP in the past 12 months: 1,370
Women who had a birth in the past 12 months: 61 (62 now married, 0 unmarried) Women who did not have a birth in the past 12 months: 298 (61 now married, 238 unmarried)
Housing units in zip code 79843 with a mortgage: 246 Median monthly owner costs for units with a mortgage: $1,187 Median monthly owner costs for units without a mortgage: $519
Residents with income below the poverty level in 2022:
This zip code:
27.7%
Whole state:
14.0%
Residents with income below 50% of the poverty level in 2022:
This zip code:
17.4%
Whole state:
7.4%
Median number of rooms in houses and condos:
Here:
5.3
State:
6.3
Median number of rooms in apartments:
Here:
3.5
State:
4.0
Notable locations in this zip code not listed on our city pages
Notable locations in zip code 79843: Marfa Municipal Golf Course (A), Allison Ranch (B), Benavides Ranch (C), Big Shanon Windmill (D), Brite Ranch (E), Clenega Windmill (F), La Morita Historic District (G), Shafter Historic Mining District (H), Fortin de la Cienega (I), El Fortin del Cibolo Historic District (J), High Lonesome Windmill (K), Little Shannon Windmill (L), Long Hollow Windmill (M), Nopal Ranch (N), Ocotillo Siding (O), Paisano (P), Split Peak Windmill (Q), Vizcaino Ranch (R), Wood Ranch (S), Agua Chano Ranch (T). Display/hide their locations on the map
Reservoirs: W-Bar Tank (A), Sunny Glen Tank (B), San Estaban Lake (C), Red Tank (D), Presa Viruelas (E), Presa Rincon (F), Presa Llorona (G), Perdis Tank (H). Display/hide their locations on the map
Creeks: Oak Creek (A), Matonoso Creek (B), South Fork Alamito Creek (C), Savcito Creek (D), Indian Creek (E), Sauceda Creek (F), Oso Creek (G), North Fork Alamito Creek (H), Morita Creek (I). Display/hide their locations on the map
In group quarters: 5 (-1 institutionalized population)
Size of family households: 288 2-persons, 111 3-persons, 132 5-persons, 3 7-or-more-persons
Size of nonfamily households: 877 1-person, 116 2-persons
393 married couples with children.
172 single-parent households (172 women).
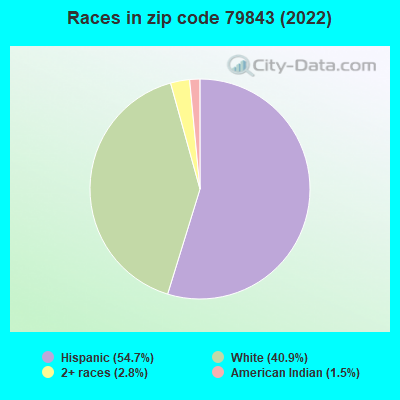
53.9% of residents of 79843 zip code speak English at home.
47.8% of residents speak Spanish at home (45% very well, 27% well, 6% not well, 22% not at all).
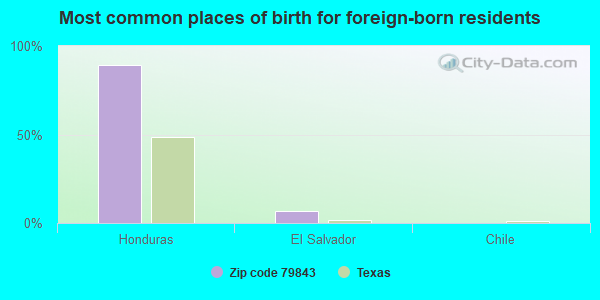
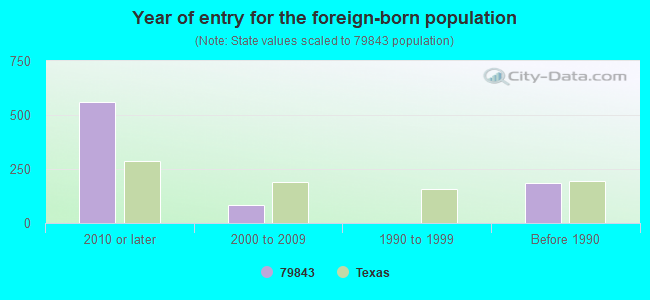
Foreign born population: 702 (24.3%) (19.5% of them are naturalized citizens)
This zip code:
24.3%
Whole state:
17.2%
89%Honduras
7%El Salvador
0%Chile
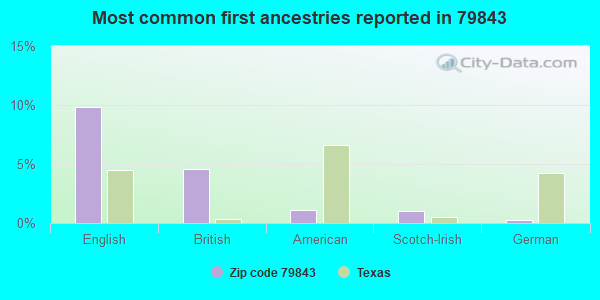
10%English
5%British
1%American
1%Scotch-Irish
0%German
Year of entry for the foreign-born population
5582010 or later
852000 to 2009
01990 to 1999
185Before 1990
Facilities with environmental interests located in this zip code:
AEP TEXAS NORTH COMPANY (101 PLATEAU ST in MARFA, TX)
(Resource Conservation and Recovery Act (tracking hazardous waste)) Business NAICS classification: ELECTRIC POWER DISTRIBUTION. Alternative names: MARFA SERVICE CENTER
Housing units lacking complete plumbing facilities: 6.5% Housing units lacking complete kitchen facilities: 6.1%
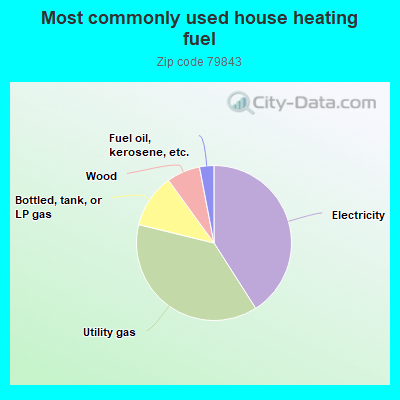
41.0%Electricity
37.9%Utility gas
11.2%Bottled, tank, or LP gas
7.0%Wood
3.0%Fuel oil, kerosene, etc.
Population in 1990: 3,155.
Place of birth for U.S.-born residents:
This state: 1,373
Northeast: 135
Midwest: 338
South: 91
West: 192
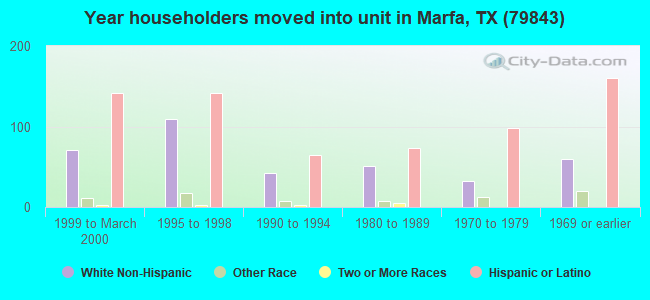
60% of the 79843 zip code residents lived in the same house 5 years ago. Out of people who lived in different houses, 43% lived in this county. Out of people who lived in different counties, 50% lived in Texas.
94% of the 79843 zip code residents lived in the same house 1 year ago. Out of people who lived in different houses, 66% moved from different county within same state. Out of people who lived in different houses, 47% moved from abroad.
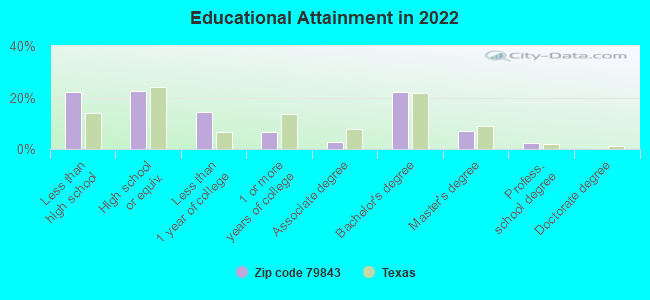
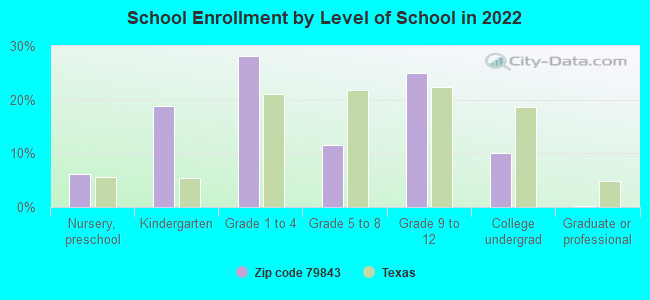
Private vs. public school enrollment:
Students in private schools in grades 1 to 8 (elementary and middle school): 90
Here:
50.5%
Texas:
8.8%
Students in private schools in grades 9 to 12 (high school):
Here:
0.0%
Texas:
8.0%
Students in private undergraduate colleges: 41
Here:
95.6%
Texas:
16.2%
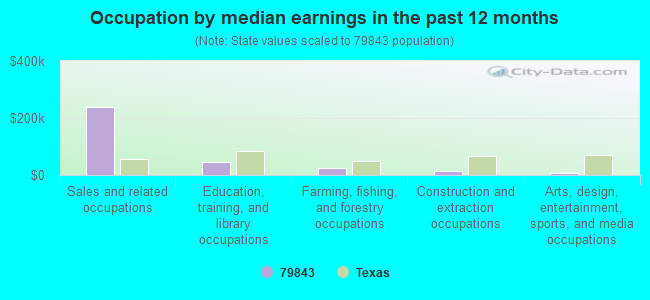
Occupation by median earnings in the past 12 months ($)
236,944Sales and related occupations
45,187Education, training, and library occupations
23,272Farming, fishing, and forestry occupations
12,390Construction and extraction occupations
8,233Arts, design, entertainment, sports, and media occupations
Companies with federal contracts located in this zip code:
MIKES PLACE (120 E EL PASO in MARFA, TX; small business) : $50,376 in 3 contractsin 2002
$48,320 with Army for Food Services. Signed on 2002-10-15. Completion date: 2002-11-04.
$1,533, same as above.Signed on 2002-11-25. Completion date: 2002-11-04.
$523, same as above.Signed on 2002-12-04. Completion date: 2002-11-04.
SOUTHWEST TEXAS MUNICIPAL GAS (130 E TEXAS in MARFA, TX) : $6,625 in 12 contractsfrom 2001 to 2003
Contracts for Gas Services by Public Buildings Service Signed by year:2000: $0; 2001: $588; 2002: $0; 2003: $6,037; 2004: $0; 2005: $0; 2006: $0.
Biggest contracts:
$1,685 with Public Buildings Service for Gas Services. Signed on 2003-02-15. Completion date: 2003-02-15.
$1,503, same as above.Signed on 2003-01-15. Completion date: 2003-01-15.
$1,360, same as above.Signed on 2003-03-15. Completion date: 2003-03-15.
$719, same as above.Signed on 2003-04-15. Completion date: 2003-04-15.
Top industries in this zip code by the number of employees in 2005:
Other Services (except Public Administration): Grantmaking Foundations (20-49 employees: 1 establishment)
Accommodation and Food Services: Full-Service Restaurants (10-19: 2, 1-4: 1)
Utilities: Electric Power Distribution (10-19: 2)
Accommodation and Food Services: Hotels (except Casino Hotels) and Motels (10-19: 1, 5-9: 1, 1-4: 1)
Arts, Entertainment, and Recreation: Museums (10-19: 1, 5-9: 1)
Accommodation and Food Services: Limited-Service Restaurants (5-9: 2, 1-4: 1)
Wholesale Trade: Other Farm Product Raw Material Merchant Wholesalers (10-19: 1)
Finance and Insurance: Commercial Banking (10-19: 1)
People in group quarters in 2000:
89 people in local jails and other confinement facilities (including police lockups)
5 people in homes for the mentally retarded
Fatal accident statistics in 2012:
Fatal accident count: 1
Vehicles involved in fatal accidents: 2
Fatal accidents caused by drunken drivers: 1
Fatalities: 1
Persons involved in fatal accidents: 5
Pedestrians involved in fatal accidents: 0
Fatal accident statistics in 2010:
Fatal accident count: 1
Vehicles involved in fatal accidents: 2
Fatal accidents caused by drunken drivers: 0
Fatalities: 2
Persons involved in fatal accidents: 5
Pedestrians involved in fatal accidents: 0
2005 - 2018 National Fire Incident Reporting System (NFIRS) incidents
According to the data from the years 2005 - 2018 the average number of fires per year is 13. The highest number of reported fires - 60 took place in 2010, and the least - 1 in 2005. The data has a rising trend.
When looking into fire subcategories, the most reports belonged to: Outside Fires (81.4%), and Mobile Property/Vehicle Fires (8.7%).
Fire incident types reported to NFIRS in Zip Code 79843
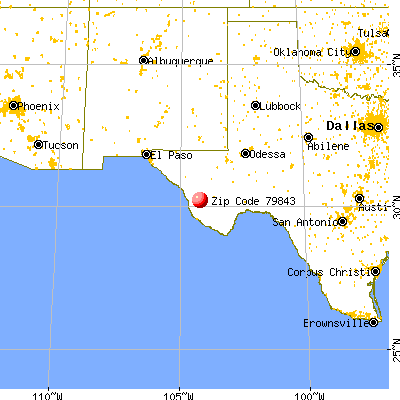


 Nearest zip codes: 79734, 79845, 79831, 79854, 79718, 79780.


 According to the data from the years 2005 - 2018 the average number of fires per year is 13. The highest number of reported fires - 60 took place in 2010, and the least - 1 in 2005. The data has a rising trend.
 When looking into fire subcategories, the most reports belonged to: Outside Fires (81.4%), and Mobile Property/Vehicle Fires (8.7%).