Estimated zip code population in 2022: 40,781 Zip code population in 2010: 34,270 Zip code population in 2000: 30,332
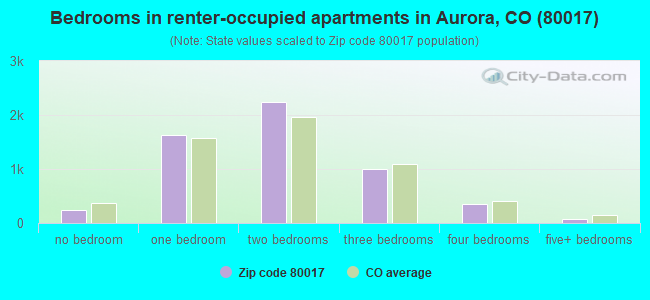
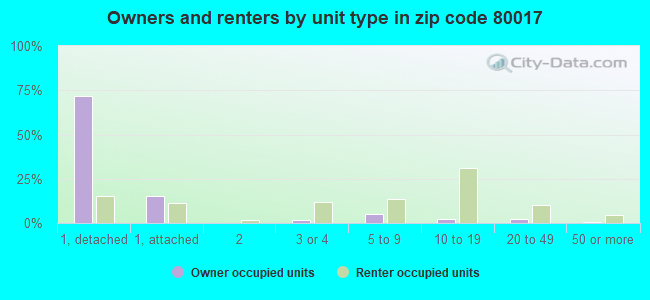
Houses and condos: 15,143 Renter-occupied apartments: 5,566
% of renters here:
38%
State:
34%
March 2022 cost of living index in zip code 80017: 102.0 (near average, U.S. average is 100)
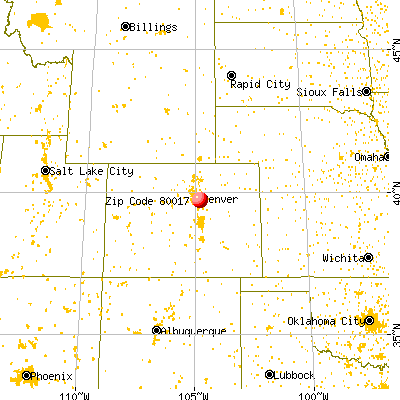
Land area: 5.9 sq. mi. Water area: 0.0 sq. mi.
Population density: 6,954 people per square mile
(high).
OSM Map
General Map
Google Map
MSN Map
OSM Map
General Map
Google Map
MSN Map
OSM Map
General Map
Google Map
MSN Map
OSM Map
General Map
Google Map
MSN Map
Please wait while loading the map...
Real estate property taxes paid for housing units in 2022:
This zip code:
0.5% ($2,021)
Colorado:
0.5% ($2,422)
Median real estate property taxes paid for housing units with mortgages in 2022: $1,999 (0.5%) Median real estate property taxes paid for housing units with no mortgage in 2022: $2,126 (0.5%)
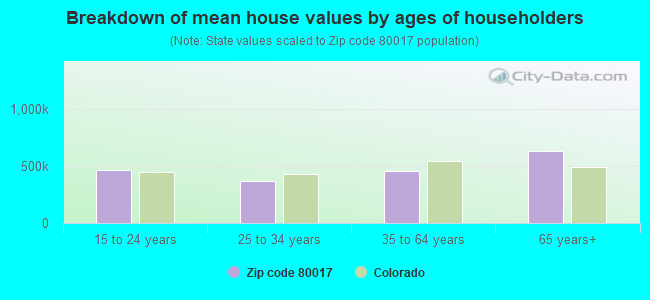
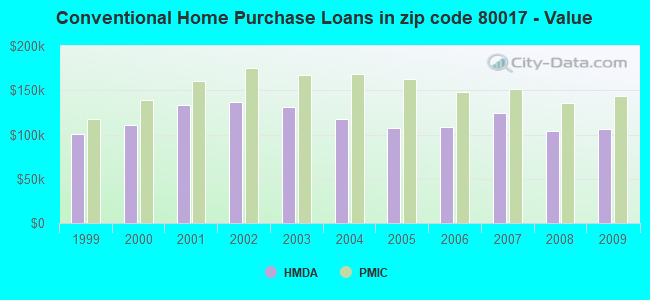
Estimated median house/condo value in 2022: $400,690
80017:
$400,690
Colorado:
$531,100
According to our research of Colorado and other state lists, there were 78 registered sex offenders living in 80017 zip code as of April 28, 2024. The ratio of all residents to sex offenders in zip code 80017 is 458 to 1. The ratio of registered sex offenders to all residents in this zip code is near the state average.
Median resident age:
This zip code:
32.8 years
Colorado median age:
37.7 years
Average household size:
This zip code:
2.8 people
Colorado:
2.4 people
Averages for the 2020 tax year for zip code 80017, filed in 2021:
Average Adjusted Gross Income (AGI) in 2020: $48,023 (Individual Income Tax Returns)
Here:
$48,023
State:
$89,260
Salary/wage: $45,419 (reported on 87.2% of returns)
Here:
$45,419
State:
$70,330
(% of AGI for various income ranges: 1257.6% for AGIs below $25k, 3946.2% for AGIs $25k-50k, 6989.1% for AGIs $50k-75k, 10403.3% for AGIs $75k-100k, 17962.2% for AGIs $100k-200k, 52750.0% for AGIs over 200k)
Taxable interest for individuals: $558 (reported on 15.3% of returns)
This zip code:
$558
Colorado:
$2,176
(% of AGI for various income ranges: 5.9% for AGIs below $25k, 5.7% for AGIs $25k-50k, 13.6% for AGIs $50k-75k, 16.9% for AGIs $75k-100k, 46.3% for AGIs $100k-200k, 200.0% for AGIs over 200k)
Ordinary dividends: $1,794 (reported on 8.0% of returns)
Here:
$1,794
State:
$8,820
(% of AGI for various income ranges: 7.4% for AGIs below $25k, 6.2% for AGIs $25k-50k, 17.2% for AGIs $50k-75k, 31.2% for AGIs $75k-100k, 91.4% for AGIs $100k-200k, 1010.0% for AGIs over 200k)
Net capital gain/loss in AGI: +$5,389 (reported on 7.5% of returns)
Here:
+$5,389
State:
+$37,276
(% of AGI for various income ranges: 3.9% for AGIs below $25k, 9.3% for AGIs $25k-50k, 29.5% for AGIs $50k-75k, 72.5% for AGIs $75k-100k, 229.2% for AGIs $100k-200k, 7920.0% for AGIs over 200k)
Profit/loss from business: +$8,639 (reported on 17.8% of returns)
Here:
+$8,639
State:
+$15,295
(% of AGI for various income ranges: 180.4% for AGIs below $25k, 154.7% for AGIs $25k-50k, 231.8% for AGIs $50k-75k, 215.2% for AGIs $75k-100k, 403.1% for AGIs $100k-200k, 3152.5% for AGIs over 200k)
Taxable individual retirement arrangement distribution: $13,190 (reported on 3.7% of returns)
80017:
$13,190
Colorado:
$23,785
(% of AGI for various income ranges: 23.6% for AGIs below $25k, 31.5% for AGIs $25k-50k, 62.2% for AGIs $50k-75k, 131.5% for AGIs $75k-100k, 364.0% for AGIs $100k-200k)
Total itemized deductions: $22,367 (reported on 7.2% of returns)
Here:
$22,367
State:
$35,141
(% of AGI for various income ranges: 31.1% for AGIs below $25k, 107.3% for AGIs $25k-50k, 341.1% for AGIs $50k-75k, 541.2% for AGIs $75k-100k, 781.2% for AGIs $100k-200k, 2380.0% for AGIs over 200k)
Charity contributions: $4,982 (reported on 4.4% of returns)
Here:
$4,982
State:
$12,103
(% of AGI for various income ranges: 2.3% for AGIs below $25k, 10.8% for AGIs $25k-50k, 33.0% for AGIs $50k-75k, 60.9% for AGIs $75k-100k, 171.3% for AGIs $100k-200k, 720.0% for AGIs over 200k)
Taxes paid: $5,574 (reported on 7.2% of returns)
80017:
$5,574
State:
$7,710
(% of AGI for various income ranges: 3.8% for AGIs below $25k, 20.3% for AGIs $25k-50k, 82.2% for AGIs $50k-75k, 145.6% for AGIs $75k-100k, 234.6% for AGIs $100k-200k, 730.0% for AGIs over 200k)
Earned income credit: $2,228 (reported on 18.1% of returns)
Here:
$2,228
State:
$2,053
(% of AGI for various income ranges: 100.7% for AGIs below $25k, 66.4% for AGIs $25k-50k, 1.3% for AGIs $50k-75k)
Percentage of individuals using paid preparers for their 2020 taxes: 92.6%
Here:
93%
State:
93%
(% for various income ranges: 90.7% for AGIs below $25k, 93.5% for AGIs $25k-50k, 93.7% for AGIs $50k-75k, 93.3% for AGIs $75k-100k, 92.9% for AGIs $100k-200k, 92.3% for AGIs over 200k)
Averages for the 2012 tax year for zip code 80017, filed in 2013:
Average Adjusted Gross Income (AGI) in 2012: $40,362 (Individual Income Tax Returns)
Here:
$40,362
State:
$69,103
Salary/wage: $38,048 (reported on 90.7% of returns)
Here:
$38,048
State:
$54,794
(% of AGI for various income ranges: 81.6% for AGIs below $25k, 89.2% for AGIs $25k-50k, 86.6% for AGIs $50k-75k, 84.9% for AGIs $75k-100k, 83.9% for AGIs $100k-200k, 60.3% for AGIs over 200k)
Taxable interest for individuals: $385 (reported on 17.6% of returns)
This zip code:
$385
Colorado:
$1,971
(% of AGI for various income ranges: 0.3% for AGIs below $25k, 0.1% for AGIs $25k-50k, 0.2% for AGIs $50k-75k, 0.1% for AGIs $75k-100k, 0.2% for AGIs $100k-200k, 0.3% for AGIs over 200k)
Ordinary dividends: $1,441 (reported on 8.5% of returns)
Here:
$1,441
State:
$7,140
(% of AGI for various income ranges: 0.4% for AGIs below $25k, 0.2% for AGIs $25k-50k, 0.3% for AGIs $50k-75k, 0.3% for AGIs $75k-100k, 0.5% for AGIs $100k-200k, 0.5% for AGIs over 200k)
Net capital gain/loss in AGI: +$1,692 (reported on 6.1% of returns)
Here:
+$1,692
State:
+$23,009
(% of AGI for various income ranges: 0.1% for AGIs $50k-75k, 0.3% for AGIs $75k-100k, 0.4% for AGIs $100k-200k, 5.4% for AGIs over 200k)
Profit/loss from business: +$8,011 (reported on 13.0% of returns)
Here:
+$8,011
State:
+$13,514
(% of AGI for various income ranges: 8.1% for AGIs below $25k, 2.3% for AGIs $25k-50k, 1.5% for AGIs $50k-75k, 1.3% for AGIs $75k-100k, 1.8% for AGIs $100k-200k)
Taxable individual retirement arrangement distribution: $11,059 (reported on 4.4% of returns)
80017:
$11,059
Colorado:
$17,927
(% of AGI for various income ranges: 1.2% for AGIs below $25k, 0.7% for AGIs $25k-50k, 1.3% for AGIs $50k-75k, 1.3% for AGIs $75k-100k, 2.1% for AGIs $100k-200k)
Total itemized deductions: $15,484 (24% of AGI, reported on 26.8% of returns)
Here:
$15,484
State:
$24,621
Here:
23.6% of AGI
State:
18.5% of AGI
(% of AGI for various income ranges: 5.8% for AGIs below $25k, 8.9% for AGIs $25k-50k, 11.4% for AGIs $50k-75k, 13.1% for AGIs $75k-100k, 12.4% for AGIs $100k-200k, 9.2% for AGIs over 200k)
Charity contributions: $2,416 (reported on 20.0% of returns)
Here:
$2,416
State:
$4,449
(% of AGI for various income ranges: 0.4% for AGIs below $25k, 0.8% for AGIs $25k-50k, 1.2% for AGIs $50k-75k, 1.7% for AGIs $75k-100k, 1.9% for AGIs $100k-200k, 1.7% for AGIs over 200k)
Taxes paid: $3,642 (reported on 26.7% of returns)
80017:
$3,642
State:
$7,641
(% of AGI for various income ranges: 0.8% for AGIs below $25k, 1.7% for AGIs $25k-50k, 2.6% for AGIs $50k-75k, 3.2% for AGIs $75k-100k, 3.8% for AGIs $100k-200k, 3.7% for AGIs over 200k)
Earned income credit: $2,279 (reported on 23.5% of returns)
Here:
$2,279
State:
$2,095
(% of AGI for various income ranges: 7.2% for AGIs below $25k, 1.3% for AGIs $25k-50k)
Percentage of individuals using paid preparers for their 2012 taxes: 45.5%
Here:
46%
State:
49%
(% for various income ranges: 44.9% for AGIs below $25k, 45.2% for AGIs $25k-50k, 46.5% for AGIs $50k-75k, 47.6% for AGIs $75k-100k, 45.9% for AGIs $100k-200k, 50.0% for AGIs over 200k)
Averages for the 2004 tax year for zip code 80017, filed in 2005:
Average Adjusted Gross Income (AGI) in 2004: $38,376 (Individual Income Tax Returns)
Here:
$38,376
State:
$55,014
Salary/wage: $37,301 (reported on 93.1% of returns)
Here:
$37,301
State:
$46,010
(% of AGI for various income ranges: 129.8% for AGIs below $10k, 88.1% for AGIs $10k-25k, 92.8% for AGIs $25k-50k, 90.7% for AGIs $50k-75k, 90.2% for AGIs $75k-100k, 82.7% for AGIs over 100k)
Taxable interest for individuals: $491 (reported on 29.2% of returns)
This zip code:
$491
Colorado:
$2,127
(% of AGI for various income ranges: 1.7% for AGIs below $10k, 0.4% for AGIs $10k-25k, 0.3% for AGIs $25k-50k, 0.4% for AGIs $50k-75k, 0.4% for AGIs $75k-100k, 0.5% for AGIs over 100k)
Taxable dividends: $702 (reported on 11.3% of returns)
Here:
$702
State:
$3,782
(% of AGI for various income ranges: 1.5% for AGIs below $10k, 0.3% for AGIs $10k-25k, 0.1% for AGIs $25k-50k, 0.2% for AGIs $50k-75k, 0.2% for AGIs $75k-100k, 0.3% for AGIs over 100k)
Net capital gain/loss: +$1,597 (reported on 9.2% of returns)
Here:
+$1,597
State:
+$17,882
(% of AGI for various income ranges: 1.0% for AGIs below $10k, -0.1% for AGIs $10k-25k, -0.0% for AGIs $25k-50k, 0.2% for AGIs $50k-75k, 0.5% for AGIs $75k-100k, 1.9% for AGIs over 100k)
Profit/loss from business: +$5,416 (reported on 12.9% of returns)
Here:
+$5,416
State:
+$11,247
(% of AGI for various income ranges: 7.5% for AGIs below $10k, 4.9% for AGIs $10k-25k, 1.5% for AGIs $25k-50k, 1.2% for AGIs $50k-75k, 0.8% for AGIs $75k-100k, 2.0% for AGIs over 100k)
IRA payment deduction: $2,294 (reported on 2.1% of returns)
80017:
$2,294
Colorado:
$2,947
(% of AGI for various income ranges: 0.3% for AGIs below $10k, 0.2% for AGIs $10k-25k, 0.2% for AGIs $25k-50k, 0.1% for AGIs $50k-75k, 0.1% for AGIs $75k-100k, 0.1% for AGIs over 100k)
Self-employed pension: $5,885 (reported on 0.2% of returns)
Here:
$5,885
Colorado:
$13,653
Total itemized deductions: $14,885 (27% of AGI, reported on 43.2% of returns)
Here:
$14,885
State:
$20,560
Here:
26.6% of AGI
State:
21.4% of AGI
(% of AGI for various income ranges: 19.6% for AGIs below $10k, 11.6% for AGIs $10k-25k, 16.8% for AGIs $25k-50k, 18.8% for AGIs $50k-75k, 18.1% for AGIs $75k-100k, 14.7% for AGIs over 100k)
Charity contributions deductions: $2,049 (4% of AGI, reported on 35.8% of returns)
Here:
$2,049
State:
$3,518
Here:
3.5% of AGI
State:
3.4% of AGI
(% of AGI for various income ranges: 1.0% for AGIs below $10k, 0.9% for AGIs $10k-25k, 1.7% for AGIs $25k-50k, 2.2% for AGIs $50k-75k, 2.4% for AGIs $75k-100k, 2.2% for AGIs over 100k)
Total tax: $4,235 (reported on 75.9% of returns)
80017:
$4,235
State:
$9,173
(% of AGI for various income ranges: 4.0% for AGIs below $10k, 4.0% for AGIs $10k-25k, 6.4% for AGIs $25k-50k, 8.7% for AGIs $50k-75k, 10.1% for AGIs $75k-100k, 14.9% for AGIs over 100k)
Earned income credit: $1,734 (reported on 16.5% of returns)
Here:
$1,734
State:
$1,595
Percentage of individuals using paid preparers for their 2004 taxes: 52.2%
Here:
52%
State:
55%
(% for various income ranges: 47.4% for AGIs below $10k, 55.9% for AGIs $10k-25k, 53.0% for AGIs $25k-50k, 50.7% for AGIs $50k-75k, 49.3% for AGIs $75k-100k, 50.8% for AGIs over 100k)
Likely homosexual households (counted as self-reported same-sex unmarried-partner households)
Lesbian couples: 0.1% of all households
Gay men: 0.2% of all households
Household received Food Stamps/SNAP in the past 12 months: 1,434 Household did not receive Food Stamps/SNAP in the past 12 months: 13,293
Women who had a birth in the past 12 months: 195 (176 now married, 22 unmarried) Women who did not have a birth in the past 12 months: 11,012 (4,781 now married, 6,235 unmarried)
Housing units in zip code 80017 with a mortgage: 6,801 (886 second mortgage, 58 home equity loan, 548 both second mortgage and home equity loan) Houses without a mortgage: 75
Median monthly owner costs for units with a mortgage: $1,820 Median monthly owner costs for units without a mortgage: $603
Residents with income below the poverty level in 2022:
This zip code:
9.7%
Whole state:
9.4%
Residents with income below 50% of the poverty level in 2022:
This zip code:
5.5%
Whole state:
4.6%
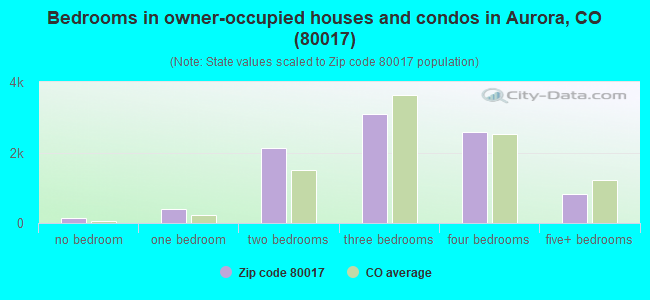
Median number of rooms in houses and condos:
Here:
6.2
State:
6.8
Median number of rooms in apartments:
Here:
4.0
State:
4.0
Notable locations in this zip code not listed on our city pages
Parks in zip code 80017 include: Centre Point Park (1), Mountain View Park (2), Highland Hollow Park (3), Rocky Ridge Park (4), Panorama Park (5), Side Creek Park (6), Tollgate Park (7). Display/hide their locations on the map
Tourist attraction (not listed on the city page) : Viper's Computer Gaming Center (15388 East Alameda Parkway).
5,437 married couples with children.
2,771 single-parent households (865 men, 1,906 women).
67.1% of residents of 80017 zip code speak English at home.
20.3% of residents speak Spanish at home (59% very well, 20% well, 14% not well, 6% not at all).
4.7% of residents speak other Indo-European language at home (56% very well, 32% well, 9% not well, 3% not at all).
2.4% of residents speak Asian or Pacific Island language at home (58% very well, 21% well, 21% not well, 1% not at all).
5.2% of residents speak other language at home (42% very well, 28% well, 28% not well, 2% not at all).
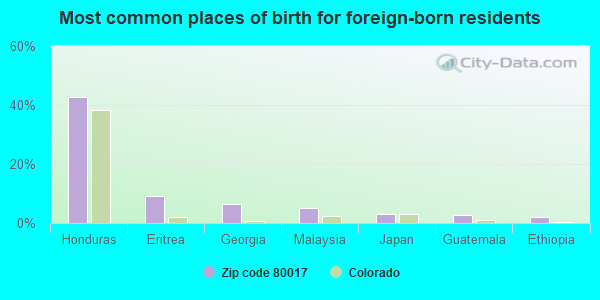
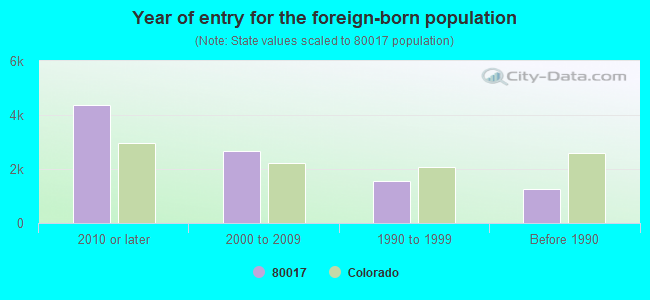
Foreign born population: 8,793 (21.6%) (36.8% of them are naturalized citizens)
Facilities with environmental interests located in this zip code:
AMOCO STATION NUMBER 3691 (15300 EAST MISSISSIPPI AVENUE in AURORA, CO)
AIR MINOR (AIRS/AFS) STATE MASTER (Colorado database) - RCRAINFO-COD983788290, SQG CRITERIA AND HAZARDOUS AIR POLLUTANT INVENTORY (Inventory of air pollution sources) Small Quantity Generators, between 100 kg and 1000 kg of hazardous waste/month (Resource Conservation and Recovery Act (tracking hazardous waste)) - notification Business SIC classification: GASOLINE SERVICE STATIONS Organizations: BP AMOCO OIL (CONTACT/OPERATOR)
, BP FACILITY #13377 (CONTACT/OPERATOR)
, AMOCO OIL CO (CONTACT/OWNER)
, BP PRODUCTS NORTH AMERICA INC (CONTACT/OWNER)
Alternative names: AMOCO GAS STA NO 3691, BP AMOCO OIL
ARKANSAS ELEMENTARY SCHOOL (17301 E ARKANSAS AVE in AURORA, CO)
(National Center for Education Statistics) - STATE ID-0310 Conditionally Exempt Small Quantity Generators, less than 100 kg/month of hazardous waste (Resource Conservation and Recovery Act (tracking hazardous waste)) - notification Organizations: AURORA PUBLIC SCHOOLS (CONTACT/OWNER)
, ADAMS-ARAPAHOE 28J (SCHOOL DISTRICT)
IOWA ELEMENTARY SCHOOL (16701 E IOWA in AURORA, CO)
(National Center for Education Statistics) - STATE ID-4270 Conditionally Exempt Small Quantity Generators, less than 100 kg/month of hazardous waste (Resource Conservation and Recovery Act (tracking hazardous waste)) - notification Organizations: AURORA PUBLIC SCHOOLS (CONTACT/OWNER)
, ADAMS-ARAPAHOE 28J (SCHOOL DISTRICT)
A1 CLNRS & LAUNDRY (1678 S CHAMBERS RD in AURORA, CO)
AIR MINOR (AIRS/AFS) CRITERIA AND HAZARDOUS AIR POLLUTANT INVENTORY (Inventory of air pollution sources) (Resource Conservation and Recovery Act (tracking hazardous waste)) Business SIC classification: DRYCLEANING PLANTS, EXCEPT RUG CLEANING Business NAICS classification: DRYCLEANING AND LAUNDRY SERVICES (EXCEPT COIN-OPERATED). Organizations: KAMALESH A. & NALINI K. PATEL (CONTACT/OWNER)
Alternative names: A-1 CLEANERS AND LAUNDRY
ALPHA PURE CLEANERS (15401 EAST MISSISSIPPI AVENUE in AURORA, CO)
AIR MINOR (AIRS/AFS) CRITERIA AND HAZARDOUS AIR POLLUTANT INVENTORY (Inventory of air pollution sources) Conditionally Exempt Small Quantity Generators, less than 100 kg/month of hazardous waste (Resource Conservation and Recovery Act (tracking hazardous waste)) - notification Business SIC classification: DRYCLEANING PLANTS, EXCEPT RUG CLEANING Business NAICS classification: DRYCLEANING AND LAUNDRY SERVICES (EXCEPT COIN-OPERATED). Organizations: PABLO KOAG ENTERPRISES INC (CONTACT/OWNER)
Alternative names: ALPHA CLEANERS INC, ALPHA CLNRS
BRIGHT CLNRS (854 S. BUCKLEY RD in AURORA, CO)
AIR MINOR (AIRS/AFS) CRITERIA AND HAZARDOUS AIR POLLUTANT INVENTORY (Inventory of air pollution sources) Conditionally Exempt Small Quantity Generators, less than 100 kg/month of hazardous waste (Resource Conservation and Recovery Act (tracking hazardous waste)) - notification Business SIC classification: DRYCLEANING PLANTS, EXCEPT RUG CLEANING Business NAICS classification: DRYCLEANING AND LAUNDRY SERVICES (EXCEPT COIN-OPERATED). Organizations: KYONG-NAM KIM (CONTACT/OWNER)
Alternative names: BRIGHT CLEANERS
FUJI PHOTO FILM USA INC / WALGREENS (15301 E MISSISSIPPI AVE in AURORA, CO)
(Resource Conservation and Recovery Act (tracking hazardous waste)) Business NAICS classification: ONE-HOUR PHOTOFINISHING.
7-ELEVEN, INC. - 33038 (18451 E ALAMEDA PKWY in AURORA, CO)
AIR MINOR (AIRS/AFS) CRITERIA AND HAZARDOUS AIR POLLUTANT INVENTORY (Inventory of air pollution sources) Business SIC classification: GROCERY STORES; GASOLINE SERVICE STATIONS
GREAT WESTERN PRINTING (1826 S VENTURA ST in AURORA, CO)
AIR MINOR (AIRS/AFS) Business SIC classification: COMMERCIAL PRINTING, LITHOGRAPHIC
A-1 CLEANERS (1768 CHAMBER RD in AURORA, CO)
Conditionally Exempt Small Quantity Generators, less than 100 kg/month of hazardous waste (Resource Conservation and Recovery Act (tracking hazardous waste)) - notification Organizations: HERMAN ASHBY (CONTACT/OWNER)
CALLOWAY ENTERPRISES (950 SOUTH ZENO WAY in AURORA, CO)
ENFORCEMENT/COMPLIANCE ACTIVITY (Integrated Compliance Information System)
CHAPARRAL SUBDIVISION (DANUBE AND CHAPARRAL CIRCLE E in AURORA, CO)
COMPLIANCE ACTIVITY (Tracking inspections of insecticide, fungicide, and rodenticide, and toxic substances)
Housing units lacking complete plumbing facilities: 0.5% Housing units lacking complete kitchen facilities: 0.8%
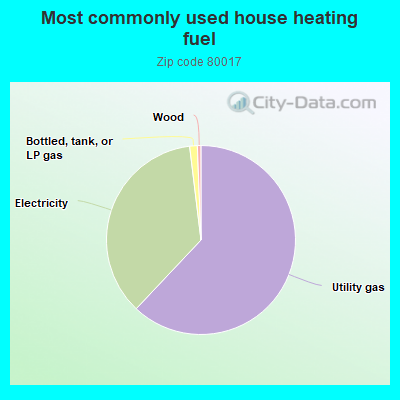
61.6%Utility gas
35.8%Electricity
1.3%Bottled, tank, or LP gas
0.6%Wood
Population in 1990: 25,910. Population change in the 1990s: +4,422 (+17.1%).
Place of birth for U.S.-born residents:
This state: 17,608
Northeast: 1,229
Midwest: 4,190
South: 3,989
West: 4,091
40% of the 80017 zip code residents lived in the same house 5 years ago. Out of people who lived in different houses, 41% lived in this county. Out of people who lived in different counties, 50% lived in Colorado.
86% of the 80017 zip code residents lived in the same house 1 year ago. Out of people who lived in different houses, 37% moved from this county. Out of people who lived in different houses, 38% moved from different county within same state. Out of people who lived in different houses, 22% moved from different state. Out of people who lived in different houses, 4% moved from abroad.
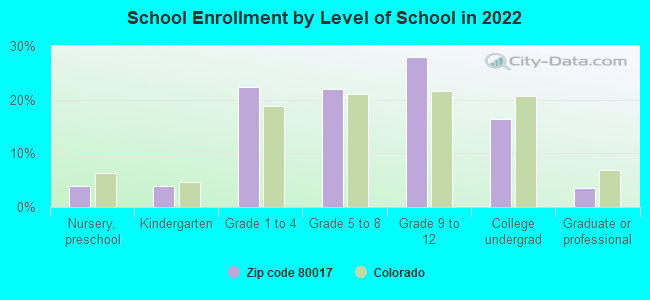
Private vs. public school enrollment:
Students in private schools in grades 1 to 8 (elementary and middle school): 230
Here:
5.3%
Colorado:
11.4%
Students in private schools in grades 9 to 12 (high school): 43
Here:
1.6%
Colorado:
8.5%
Students in private undergraduate colleges: 288
Here:
17.7%
Colorado:
14.0%
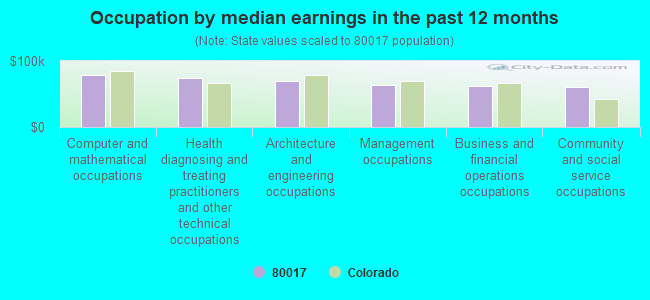
Occupation by median earnings in the past 12 months ($)
78,663Computer and mathematical occupations
74,072Health diagnosing and treating practitioners and other technical occupations
70,319Architecture and engineering occupations
64,069Management occupations
61,407Business and financial operations occupations
59,952Community and social service occupations
Companies with federal contracts located in this zip code:
NORTHROP GRUMMAN SPACE & MISSI (17455 EAST EXPOSITION DRIV in AURORA, CO) : $11,420,871 in 185 contractsfrom 1999 to 2006
Contracts for Other ADP and Telecommunications Services (includes data storage on tapes, compact disks, etc.), Electronic Countermeasures, Counter-Countermeasures and Quick Reaction Capability Equipment, Maintenance, Repair and Rebuilding of Equipment -- Communication, Detection, and Coherent Radiation Equipment, ADP Software, and moreby Bureau of Land Management, Navy, Air Force Signed by year:2000: $5,661,000; 2001: $0; 2002: $0; 2003: $6,500; 2004: $1,527,554; 2005: $1,643,444; 2006: $1,618,373.
Biggest contracts:
$2,975,000 with Bureau of Land Management for Other ADP and Telecommunications Services (includes data storage on tapes, compact disks, etc.). Signed on 2000-08-15. Completion date: 2000-08-15.
$690,200, same as above.Signed on 2006-08-25. Completion date: 2007-03-31.
$653,000, same as above.Signed on 2000-08-15. Completion date: 2000-08-15.
$600,000, same as above.Signed on 2005-01-27. Completion date: 2005-12-31.
GRAEBEL COMPANIES, INC (401 SOUTH AIRPORT BLVD in AURORA, WI) : $3,186,518 in 32 contractsfrom 2000 to 2006
Contracts for Other Transportation Travel and Relocation Services, Relocation Services, Motor Freight, Warehousing and Storage Services by Department of Defense, Washington Headquarters Services, Pentagon Renovation Program Office, Office of the Assistant Secretary for Administration and Management, and others Signed by year:2000: $121,000; 2001: $655,482; 2002: $660,512; 2003: $264,369; 2004: $609,692; 2005: $320,378; 2006: $555,085.
Biggest contracts:
$605,125 with Department of Defense for Other Transportation Travel and Relocation Services. Taking place in VA. Signed on 2004-12-20. Completion date: 2005-07-10.
$490,273 with Department of Defense for Relocation Services. Taking place in VA. Signed on 2002-01-14. Completion date: 2002-12-31.
$378,237 with Washington Headquarters Services for Other Transportation Travel and Relocation Services. Taking place in VA. Signed on 2006-06-01. Completion date: 2006-02-16.
$242,000 with Department of Defense for Relocation Services. Taking place in VA. Signed on 2001-09-28. Completion date: 2001-12-31.
CARTER, WIILIAM D (491 S KALISPELL WY #205 in AURORA, CO; small business)
$2,500 with Air Force for Construction of Structures and Facilities -- Other Non-Building Facilities. Taking place in MS. Signed on 2004-10-29. Completion date: 2004-11-28.
Top industries in this zip code by the number of employees in 2005:
Professional, Scientific, and Technical Services: Administrative Management and General Management Consulting Services (100-249 employees: 1 establishment, 50-99 employees: 1 establishment, 1-4 employees: 2 establishments)
2003 - 2018 National Fire Incident Reporting System (NFIRS) incidents
Based on the data from the years 2003 - 2018 the average number of fires per year is 46. The highest number of reported fires - 80 took place in 2003, and the least - 14 in 2015. The data has a dropping trend.
When looking into fire subcategories, the most reports belonged to: Structure Fires (42.1%), and Outside Fires (39.8%).
Fire incident types reported to NFIRS in Zip Code 80017


 Nearest zip codes: 80011, 80013, 80012, 80014, 80015, 80045.


 Based on the data from the years 2003 - 2018 the average number of fires per year is 46. The highest number of reported fires - 80 took place in 2003, and the least - 14 in 2015. The data has a dropping trend.
 When looking into fire subcategories, the most reports belonged to: Structure Fires (42.1%), and Outside Fires (39.8%).