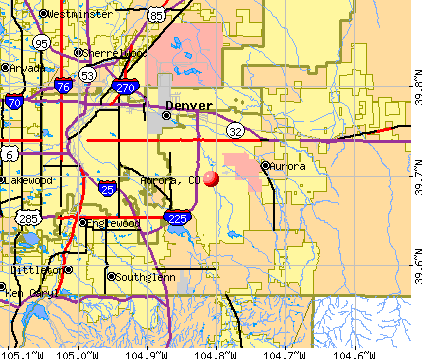
Aurora, Colorado
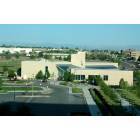
Aurora: Library
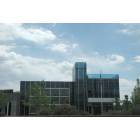
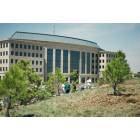
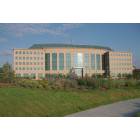
Aurora: Aurora Central Library
Aurora: Library
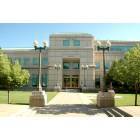
Aurora: Aurora Police Station
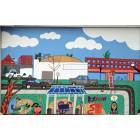
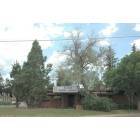
Aurora: Mural
Aurora: Arbor Day 2005 in front of Aurora Municipal Bldg
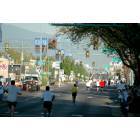
Aurora: Colfax Marathon
Aurora
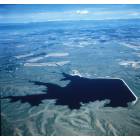
Aurora: Aurora Res looking west
Aurora: Aurora Municipal Bldg
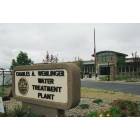
Aurora: Wemlinger Treatment Plant
- see
27
more - add
your
Submit your own pictures of this city and show them to the world
- OSM Map
- General Map
- Google Map
- MSN Map
Population change since 2000: +42.4%
 |
| Males: 196,830 | |
| Females: 196,707 |
| Median resident age: | 35.1 years |
| Colorado median age: | 37.7 years |
Zip codes: 80010, 80011, 80012, 80013, 80014, 80015, 80016, 80017, 80019, 80045, 80102, 80112, 80137, 80138, 80220, 80231, 80247.
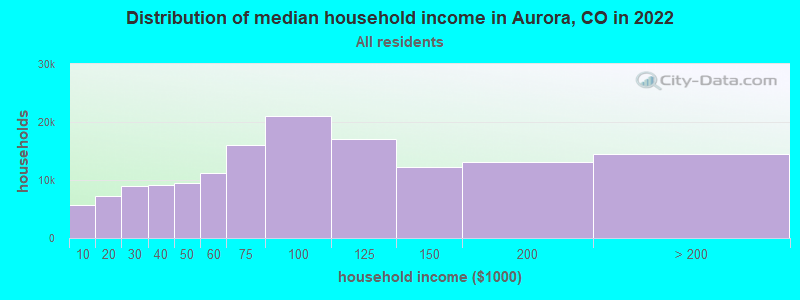
Aurora Zip Code Map| Aurora: | $81,395 |
| CO: | $89,302 |
Estimated per capita income in 2022: $39,083 (it was $21,095 in 2000)
Aurora city income, earnings, and wages data
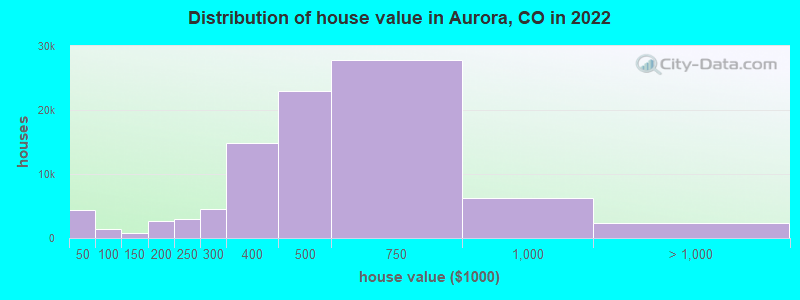
Estimated median house or condo value in 2022: $461,500 (it was $139,700 in 2000)
| Aurora: | $461,500 |
| CO: | $531,100 |
Mean prices in 2022: all housing units: $504,412; detached houses: $582,536; townhouses or other attached units: $337,615; in 2-unit structures: $403,670; in 3-to-4-unit structures: $396,613; in 5-or-more-unit structures: $244,140; mobile homes: $88,674; occupied boats, rvs, vans, etc.: $24,189
Median gross rent in 2022: $1,725.
(8.2% for White Non-Hispanic residents, 16.7% for Black residents, 12.1% for Hispanic or Latino residents, 16.1% for American Indian residents, 6.9% for Native Hawaiian and other Pacific Islander residents, 13.3% for other race residents, 11.1% for two or more races residents)
Detailed information about poverty and poor residents in Aurora, CO


Compare current foreclosures in Aurora, CO:
| Photo | Address | Area | Beds / Baths | Price | Details |
|---|---|---|---|---|---|

|
#1
E Exposition Ave Apartme
Aurora, CO 80012
|
444 sq. feet
|
1 baths 1 beds |
show details | |

|
#2
S Elk Way
Aurora, CO 80016
|
1,984 sq. feet
|
2 baths 4 beds |
show details | |

|
#3
S Flanders Way
Aurora, CO 80017
|
1,682 sq. feet
|
2 baths 2 beds |
show details | |

|
#4
S Lewiston Cir
Aurora, CO 80013
|
966 sq. feet
|
2 baths 2 beds |
show details | |

|
#5
S Rifle Way
Aurora, CO 80013
|
2,047 sq. feet
|
3 baths 1 beds |
show details | |

|
#6
E Linvale Dr
Aurora, CO 80013
|
1,393 sq. feet
|
2 baths 3 beds |
show details | |

|
#7
S Dawson Way Unit 2
Aurora, CO 80012
|
558 sq. feet
|
1 baths 1 beds |
show details | |

|
#8
S Richfield Way
Aurora, CO 80013
|
1,054 sq. feet
|
1 baths 2 beds |
show details | |

|
#9
E Brown Cir
Aurora, CO 80013
|
1,762 sq. feet
|
3 baths 4 beds |
show details | |

|
#10
E Davies Ave
Aurora, CO 80016
|
2,175 sq. feet
|
3 baths 3 beds |
show details |
| Photo | Address | Area | Beds / Baths | Price | Details |
|---|---|---|---|---|---|

|
#11
E Grand Cir
Aurora, CO 80015
|
1,816 sq. feet
|
3 baths 3 beds |
show details | |

|
#12
S Danube Way Unit 103
Aurora, CO 80013
|
697 sq. feet
|
1 baths 1 beds |
show details | |

|
#13
E Batavia Dr
Aurora, CO 80011
|
842 sq. feet
|
1 baths 4 beds |
show details | |

|
#14
Nome St
Aurora, CO 80010
|
736 sq. feet
|
1 baths 2 beds |
show details | |

|
#15
S Memphis Way Apt 11
Aurora, CO 80017
|
913 sq. feet
|
1 baths 2 beds |
show details | |

|
#16
E Villanova Pl
Aurora, CO 80013
|
1,007 sq. feet
|
2 baths 3 beds |
show details | |

|
#17
E Layton Dr
Aurora, CO 80015
|
3,028 sq. feet
|
5 baths 4 beds |
show details | |

|
#18
S Granby St
Aurora, CO 80014
|
1,160 sq. feet
|
2 baths 2 beds |
show details | |

|
#19
S Newark Ct
Aurora, CO 80012
|
1,296 sq. feet
|
2 baths 2 beds |
show details | |

|
#20
S Tempe Ct
Aurora, CO 80016
|
3,515 sq. feet
|
4 baths 4 beds |
show details |
| Photo | Address | Area | Beds / Baths | Price | Details |
|---|---|---|---|---|---|

|
#21
E Amherst Ave
Aurora, CO 80014
|
1,342 sq. feet
|
2 baths 2 beds |
show details | |

|
#22
S Pitkin Cir
Aurora, CO 80013
|
1,320 sq. feet
|
2 baths 3 beds |
show details | |

|
#23
E Evans Ave
Aurora, CO 80014
|
3,152 sq. feet
|
4 baths 4 beds |
show details | |

|
#24
E Arizona Pl
Aurora, CO 80017
|
1,530 sq. feet
|
2 baths 3 beds |
show details | |

|
#25
E Asbury Ave
Aurora, CO 80013
|
1,646 sq. feet
|
3 baths 3 beds |
show details | |

|
#26
E Tennessee Dr # 107
Aurora, CO 80012
|
1,282 sq. feet
|
3 baths 2 beds |
show details | |

|
#27
E Alaska Ave
Aurora, CO 80012
|
1,118 sq. feet
|
1 baths 2 beds |
show details | |

|
#28
E Caspian Pl
Aurora, CO 80013
|
2,638 sq. feet
|
3 baths 4 beds |
show details | |

|
#29
E Alabama Dr
Aurora, CO 80017
|
2,343 sq. feet
|
2 baths 4 beds |
show details | |

|
#30
S Dillon Way
Aurora, CO 80012
|
1,186 sq. feet
|
1 baths 2 beds |
show details |
| Photo | Address | Area | Beds / Baths | Price | Details |
|---|---|---|---|---|---|

|
#31
Biscay St
Aurora, CO 80011
|
2,702 sq. feet
|
3 baths 3 beds |
show details | |

|
#32
E Columbia Dr
Aurora, CO 80014
|
1,008 sq. feet
|
2 baths 3 beds |
show details | |

|
#33
E Dorado Cir
Aurora, CO 80015
|
3,066 sq. feet
|
4 baths 4 beds |
show details | |

|
#34
S Vaughn Cir
Aurora, CO 80012
|
2,152 sq. feet
|
3 baths 4 beds |
show details | |

|
#35
N Patsburg St
Aurora, CO 80018
|
- sq. feet
|
3 baths 3 beds |
show details | |

|
#36
E Warren Dr Unit 101
Aurora, CO 80013
|
1,013 sq. feet
|
2 baths 2 beds |
show details | |

|
#37
E Vassar Dr
Aurora, CO 80013
|
1,927 sq. feet
|
2 baths 3 beds |
show details | |

|
#38
S Danube Way Unit 103
Aurora, CO 80017
|
990 sq. feet
|
2 baths 2 beds |
show details | |

|
#39
S Jasper St
Aurora, CO 80013
|
1,032 sq. feet
|
2 baths 5 beds |
show details | |

|
#40
E Louisiana Cir
Aurora, CO 80018
|
1,582 sq. feet
|
3 baths 3 beds |
show details |
| Photo | Address | Area | Beds / Baths | Price | Details |
|---|---|---|---|---|---|

|
#41
S Flat Rock Ct
Aurora, CO 80016
|
2,822 sq. feet
|
2 baths 3 beds |
show details | |

|
#42
Emporia St
Aurora, CO 80010
|
1,040 sq. feet
|
1 baths 3 beds |
show details | |

|
#43
E Alaska Ave
Aurora, CO 80012
|
2,080 sq. feet
|
2 baths 2 beds |
show details | |

|
#44
E Arbor Dr
Aurora, CO 80016
|
3,505 sq. feet
|
4 baths 4 beds |
show details | |

|
#45
S Olathe Ct
Aurora, CO 80013
|
1,620 sq. feet
|
3 baths 3 beds |
show details | |

|
#46
S Shady Grove Way
Aurora, CO 80016
|
- sq. feet
|
3 baths 3 beds |
show details | |

|
#47
S Pitkin Cir
Aurora, CO 80017
|
738 sq. feet
|
1 baths 1 beds |
show details | |

|
#48
E Girard Dr
Aurora, CO 80013
|
1,408 sq. feet
|
2 baths 3 beds |
show details | |

|
#49
E Smoky Hill Rd
Aurora, CO 80015
|
- sq. feet
|
2 baths 2 beds |
show details | |

|
Check over 1 million property listings on Foreclosure.com!
|
browse all offers | |||


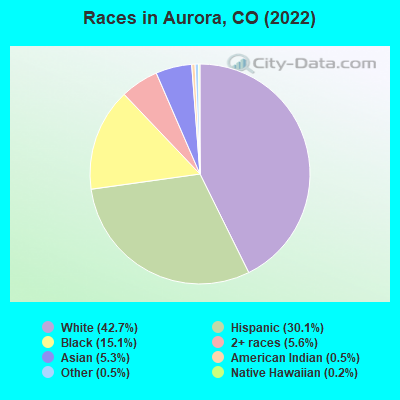
- 167,94642.7%White alone
- 118,40730.1%Hispanic
- 59,21815.1%Black alone
- 22,1855.6%Two or more races
- 20,8125.3%Asian alone
- 2,0210.5%American Indian alone
- 1,9750.5%Other race alone
- 7550.2%Native Hawaiian and Other
Pacific Islander alone
According to our research of Colorado and other state lists, there were 1,048 registered sex offenders living in Aurora, Colorado as of April 27, 2024.
The ratio of all residents to sex offenders in Aurora is 346 to 1.
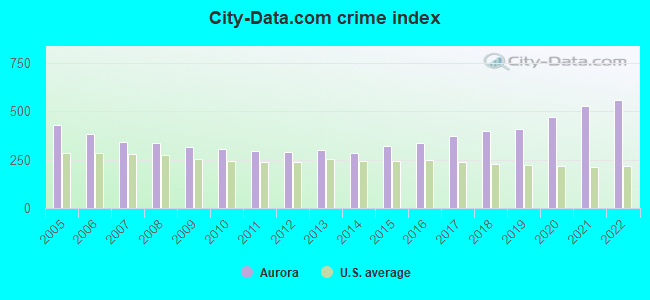
The City-Data.com crime index weighs serious crimes and violent crimes more heavily. Higher means more crime, U.S. average is 246.1. It adjusts for the number of visitors and daily workers commuting into cities.
- means the value is smaller than the state average.- means the value is about the same as the state average.
- means the value is bigger than the state average.
- means the value is much bigger than the state average.
Crime rate in Aurora detailed stats: murders, rapes, robberies, assaults, burglaries, thefts, arson
Full-time law enforcement employees in 2021, including police officers: 877 (689 officers - 611 male; 78 female).
| Officers per 1,000 residents here: | 1.75 |
| Colorado average: | 2.14 |
 Recent articles from our blog. Our writers, many of them Ph.D. graduates or candidates, create easy-to-read articles on a wide variety of topics.

 | Do you think Aurora will get as pricey as other Denver metro communities? (21 replies) |
| The Reputation of Aurora (89 replies) |
| Work in Aurora but where do you live? (24 replies) |
| SE Aurora PHOTO TOUR (13 replies) |
| Explain Aurora street names? (20 replies) |
| How safe is Aurora? (11 replies) |
Latest news from Aurora, CO collected exclusively by city-data.com from local newspapers, TV, and radio stations
Ancestries: German (5.9%), English (4.1%), American (4.0%), Irish (3.2%), Ethiopian (2.8%), European (2.7%).
Current Local Time: MST time zone
Incorporated on 5/5/1903
Elevation: 5435 feet
Land area: 142.5 square miles.
Population density: 2,762 people per square mile (average).
82,995 residents are foreign born (10.7% Latin America, 4.9% Asia, 3.7% Africa).
| This city: | 21.1% |
| Colorado: | 9.5% |
Median real estate property taxes paid for housing units with mortgages in 2022: $2,379 (0.5%)
Median real estate property taxes paid for housing units with no mortgage in 2022: $2,048 (0.5%)
Nearest city with pop. 1,000,000+: Phoenix, AZ  (586.8 miles , pop. 1,321,045).
Nearest cities:
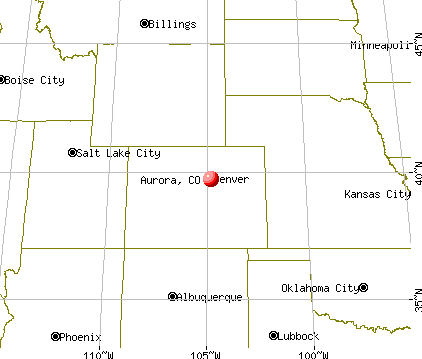
), ), ), ), ), ), Latitude: 39.70 N, Longitude: 104.81 W
Daytime population change due to commuting: -39,594 (-10.1%)
Workers who live and work in this city: 90,565 (43.1%)
Area codes: 303, 720
Property values in Aurora, CO
Aurora tourist attractions:
Aurora, Colorado accommodation & food services, waste management - Economy and Business Data
| Here: | 3.5% |
| Colorado: | 3.2% |
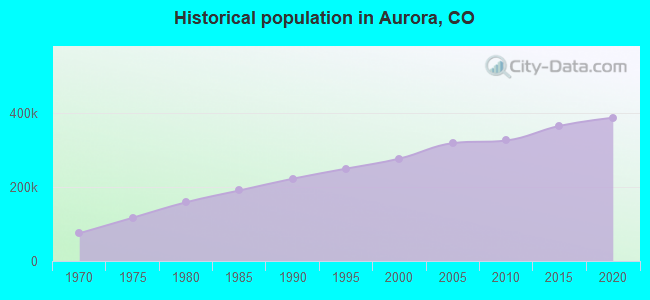

Population change in the 1990s: +53,274 (+23.9%).
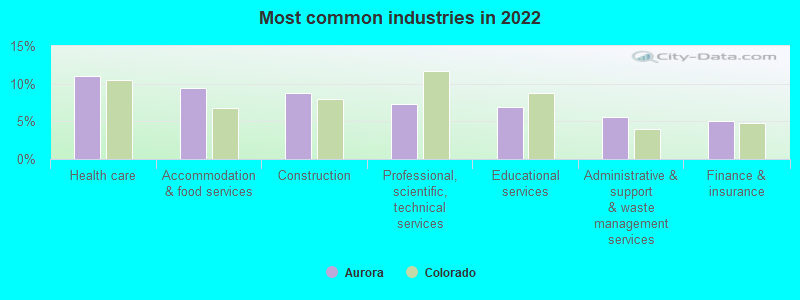
- Health care (11.1%)
- Accommodation & food services (9.5%)
- Construction (8.7%)
- Professional, scientific, technical services (7.3%)
- Educational services (6.9%)
- Administrative & support & waste management services (5.6%)
- Finance & insurance (5.0%)
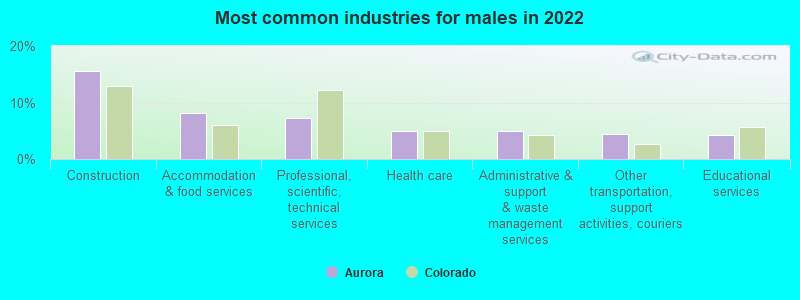
- Construction (15.5%)
- Accommodation & food services (8.1%)
- Professional, scientific, technical services (7.2%)
- Health care (5.0%)
- Administrative & support & waste management services (5.0%)
- Other transportation, support activities, couriers (4.5%)
- Educational services (4.2%)
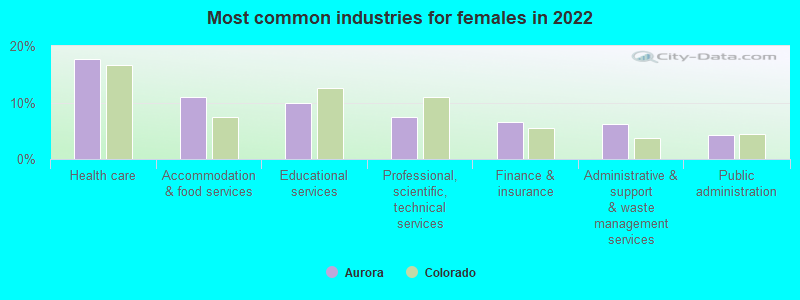
- Health care (17.8%)
- Accommodation & food services (11.0%)
- Educational services (9.8%)
- Professional, scientific, technical services (7.4%)
- Finance & insurance (6.5%)
- Administrative & support & waste management services (6.3%)
- Public administration (4.3%)
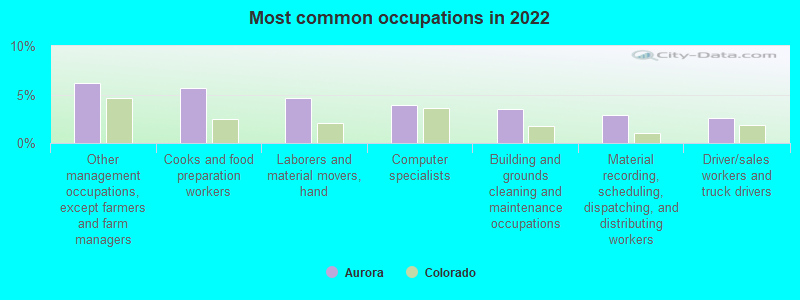
- Other management occupations, except farmers and farm managers (6.1%)
- Cooks and food preparation workers (5.7%)
- Laborers and material movers, hand (4.7%)
- Computer specialists (3.9%)
- Building and grounds cleaning and maintenance occupations (3.5%)
- Material recording, scheduling, dispatching, and distributing workers (2.9%)
- Driver/sales workers and truck drivers (2.5%)
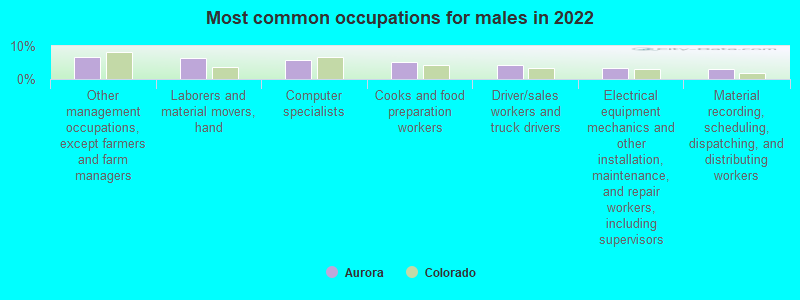
- Other management occupations, except farmers and farm managers (6.7%)
- Laborers and material movers, hand (6.3%)
- Computer specialists (5.8%)
- Cooks and food preparation workers (5.0%)
- Driver/sales workers and truck drivers (4.2%)
- Electrical equipment mechanics and other installation, maintenance, and repair workers, including supervisors (3.5%)
- Material recording, scheduling, dispatching, and distributing workers (3.1%)
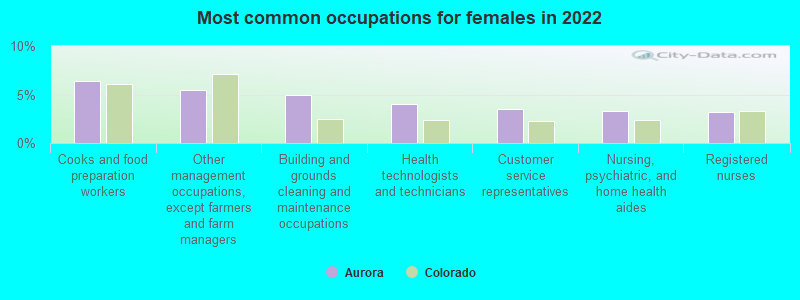
- Cooks and food preparation workers (6.4%)
- Other management occupations, except farmers and farm managers (5.5%)
- Building and grounds cleaning and maintenance occupations (4.9%)
- Health technologists and technicians (4.1%)
- Customer service representatives (3.5%)
- Nursing, psychiatric, and home health aides (3.3%)
- Registered nurses (3.2%)
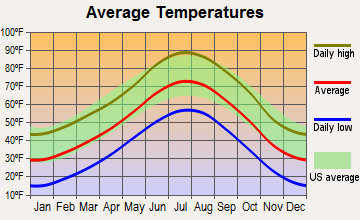
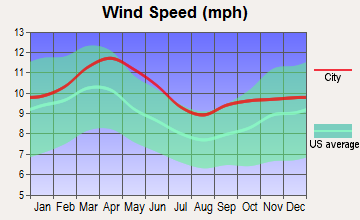
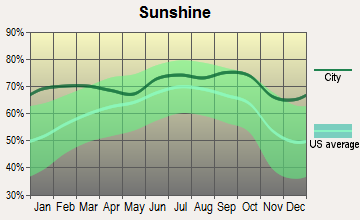
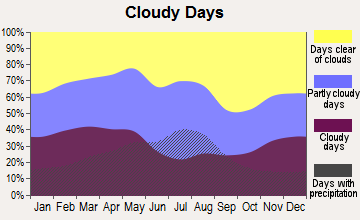
Average climate in Aurora, Colorado
Based on data reported by over 4,000 weather stations


|
|

(lower is better)
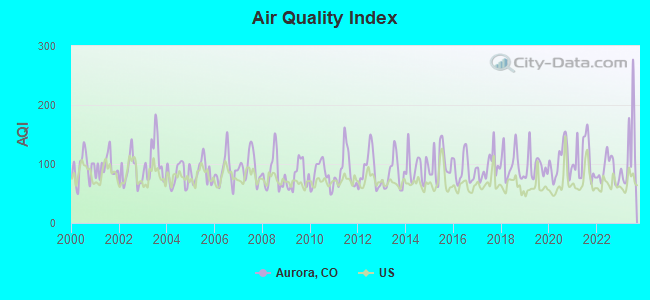
Air Quality Index (AQI) level in 2023 was 122. This is significantly worse than average.
| City: | 122 |
| U.S.: | 73 |
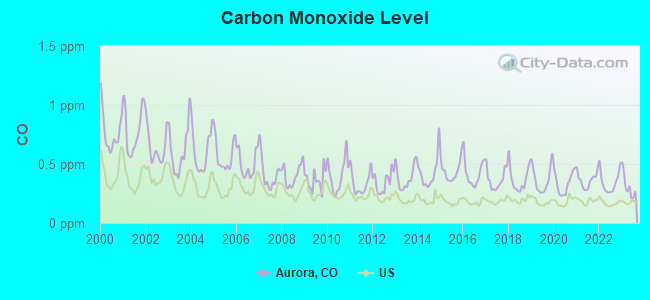
Carbon Monoxide (CO) [ppm] level in 2023 was 0.313. This is worse than average. Closest monitor was 2.3 miles away from the city center.
| City: | 0.313 |
| U.S.: | 0.251 |
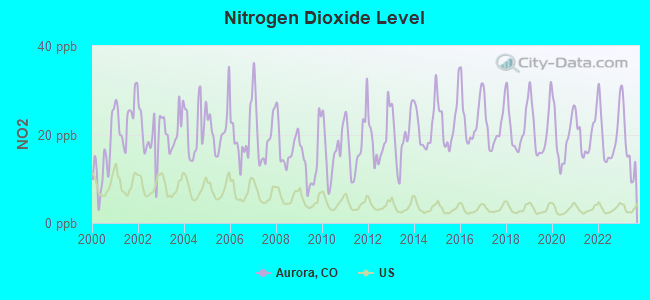
Nitrogen Dioxide (NO2) [ppb] level in 2023 was 17.3. This is significantly worse than average. Closest monitor was 2.3 miles away from the city center.
| City: | 17.3 |
| U.S.: | 5.1 |
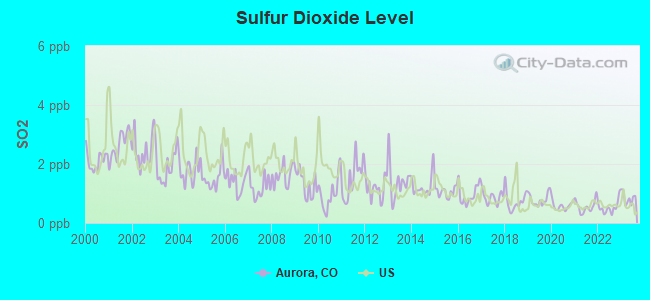
Sulfur Dioxide (SO2) [ppb] level in 2023 was 0.845. This is significantly better than average. Closest monitor was 7.7 miles away from the city center.
| City: | 0.845 |
| U.S.: | 1.515 |
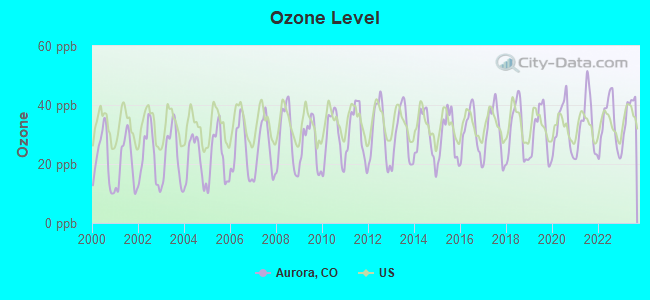
Ozone [ppb] level in 2023 was 36.8. This is about average. Closest monitor was 2.3 miles away from the city center.
| City: | 36.8 |
| U.S.: | 33.3 |
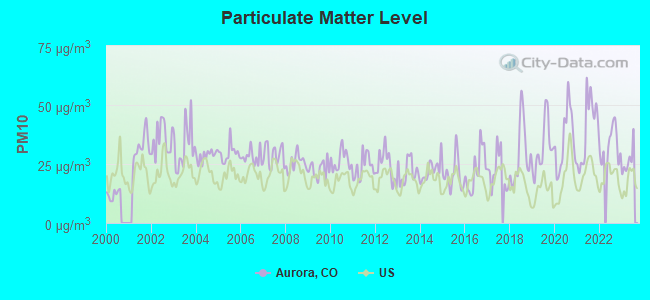
Particulate Matter (PM10) [µg/m3] level in 2023 was 26.4. This is worse than average. Closest monitor was 4.7 miles away from the city center.
| City: | 26.4 |
| U.S.: | 19.2 |
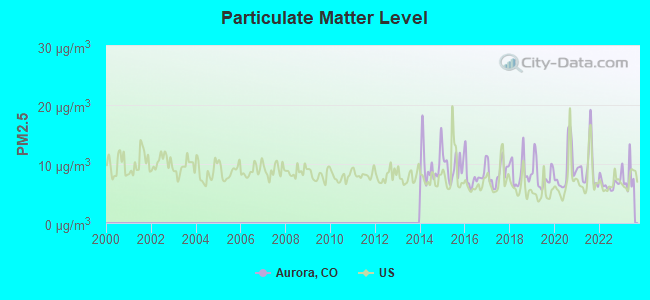
Particulate Matter (PM2.5) [µg/m3] level in 2023 was 7.96. This is about average. Closest monitor was 7.6 miles away from the city center.
| City: | 7.96 |
| U.S.: | 8.11 |
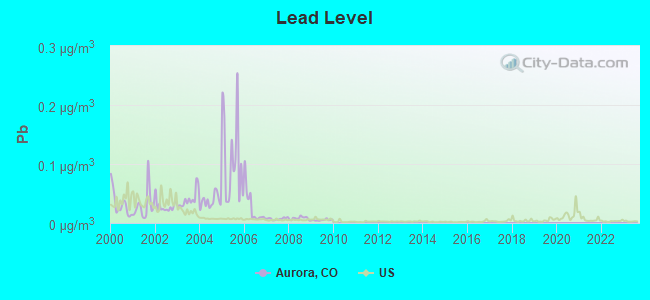
Lead (Pb) [µg/m3] level in 2009 was 0.00502. This is significantly better than average. Closest monitor was 4.1 miles away from the city center.
| City: | 0.00502 |
| U.S.: | 0.00931 |
Tornado activity:
Aurora-area historical tornado activity is significantly above Colorado state average. It is 39% greater than the overall U.S. average.
On 6/15/1988, a category F3 (max. wind speeds 158-206 mph) tornado 6.9 miles away from the Aurora city center injured 7 people and caused between $5,000,000 and $50,000,000 in damages.
On 5/18/1975, a category F3 tornado 8.3 miles away from the city center .
Earthquake activity:
Aurora-area historical earthquake activity is significantly above Colorado state average. It is 696% greater than the overall U.S. average.On 8/18/1959 at 06:37:13, a magnitude 7.7 (7.7 UK, Class: Major, Intensity: VIII - XII) earthquake occurred 450.8 miles away from the city center, causing $26,000,000 total damage
On 10/18/1984 at 15:30:23, a magnitude 5.5 (5.4 MB, 5.1 MS, 5.5 ML, Class: Moderate, Intensity: VI - VII) earthquake occurred 190.9 miles away from Aurora center
On 8/23/2011 at 05:46:18, a magnitude 5.3 (5.3 MW, Depth: 2.5 mi) earthquake occurred 182.2 miles away from the city center
On 10/28/1983 at 14:06:06, a magnitude 7.3 (6.2 MB, 7.3 MS, 7.0 MW) earthquake occurred 553.0 miles away from the city center, causing 2 deaths (2 shaking deaths) and 3 injuries, causing $15,000,000 total damage
On 8/10/2005 at 22:08:22, a magnitude 5.0 (5.0 MW, Depth: 3.1 mi) earthquake occurred 190.1 miles away from Aurora center
On 8/10/2005 at 22:08:22, a magnitude 5.0 (5.0 MB, 4.7 MS, 5.0 MW) earthquake occurred 192.0 miles away from the city center
Magnitude types: body-wave magnitude (MB), local magnitude (ML), surface-wave magnitude (MS), moment magnitude (MW)
Natural disasters:
The number of natural disasters in Adams County (11) is smaller than the US average (15).Major Disasters (Presidential) Declared: 6
Emergencies Declared: 4
Causes of natural disasters: Floods: 6, Storms: 5, Landslides: 3, Mudslides: 3, Snows: 2, Tornadoes: 2, Fire: 1, Heavy Rain: 1, Hurricane: 1, Snowstorm: 1, Other: 1 (Note: some incidents may be assigned to more than one category).
Main business address for: PROLOGIS (REAL ESTATE INVESTMENT TRUSTS).
Hospitals in Aurora:
- CHILDRENS HOSPITAL COLORADO (Voluntary non-profit - Private, provides emergency services, 13123 EAST 16TH AVENUE)
- MEDICAL CENTER OF AURORA, THE (Proprietary, provides emergency services, 1501 S POTOMAC ST)
- ROCKY MTN REHABILITATION INSTITUTE (900 POTOMAC ST)
- UNIVERSITY OF COLORADO HOSPITAL ANSCHUTZ INPATIENT (Government - Hospital District or Authority, 12605 EAST 16TH AVENUE)
Nursing Homes in Aurora:
- ADVANCED HEALTH CARE OF AURORA (1800 SOUTH POTOMAC STREET)
- BETH ISRAEL AT SHALOM PARK (14800 EAST BELLEVIEW DRIVE)
- CHERRY CREEK NURSING CENTER (14699 EAST HAMPDEN AVENUE)
- COLORADO STATE VETERANS HOME AT FITZSIMONS (1919 QUENTIN STREET)
- GARDEN TERRACE ALZHEIMER'S CENTER OF EXCELLENCE (1600 SOUTH POTOMAC STREET)
- KINDRED NURSING AND REHABILITATION-AURORA (10201 EAST THIRD AVENUE)
- LIFE CARE CENTER OF AURORA (14101 EAST EVANS AVENUE)
- SABLE CARE AND REHABILITATION CENTER (656 DILLON WAY)
- ST ANDREWS VILLAGE-LTC (2670 SOUTH ABILENE STREET WEST)
- SUMMIT REHABILITATION AND CARE COMMUNITY (500 GENEVA STREET)
Dialysis Facilities in Aurora:
- AURORA DIALYSIS (DVA) (1411 S POTOMAC ST STE 100)
- AURORA DIALYSIS (FMC) (962 POTOMAC CIR)
- EAST AURORA DIALYSIS (DVA) (482 S CHAMBERS RD)
- SABLE DIALYSIS (DVA) (509 N SABLE BLVD)
- THE CHILDRENS HOSPITAL KIDNEY CTR. (13123 E 16TH AVE #328)
Home Health Centers in Aurora:
- AGAPE CARE COMMUNITY, LLC (1690 S CHAMBERS RD)
- AHC HOME CARE (1800 SOUTH POTOMAC STREET)
- AMAZING CARE HOME HEALTH SERVICES, INC (2821 SOUTH PARKER ROAD, #615)
- ANGELS CARE HOME HEALTH OF COLORADO (10800 E BETHANY DRIVE #100)
- DIVINE DEDICATION INC (12510 EAST ILIFF AVENUE, #115)
- ESSENTIAL MEDICAL SERVICES INC (3000 S JAMAICA CT, #175)
- ETAHNU IN-HOME SERVICES (14800 E BELLEVIEW DRIVE)
- LIFE CARE AT HOME OF COLORADO (2121 S BLACKHAWK STREET, #100)
- PSA HOME HEALTHCARE (14231 EAST 4TH AVENUE #200)
- SATURDAY PARTNERS LLC (12200 EAST ILIFF AVE #102)
Airports and heliports located in Aurora:
- Buckley Afb Airport (BKF) (Runways: 1, Air Taxi Ops: 40,000, Itinerant Ops: 10,000, Local Ops: 70,000, Military Ops: 40,000)
- Simons Airport (34CO) (Runways: 1)
- Aurora Presbyterian Hospital Heliport (CO05)
- Aurora Regional Medical Center Heliport (1CO0)
- Children's Hospital Colorado Heliport (2CD8)
- Saddle Rock Er Heliport (7CO5)
Amtrak stations near Aurora:
- 11 miles: DENVER (1701 WYNKOOP ST.) . Services: ticket office, fully wheelchair accessible, enclosed waiting area, public restrooms, public payphones, full-service food facilities and snack bar, paid short-term parking, paid long-term parking, call for car rental service, taxi stand, public transit connection.
- 14 miles: DENVER INTERNATIONAL AP'T (DENVER, DENVER INTERNATIONAL AIRPORT) - Bus Station . Services: enclosed waiting area, public restrooms, public payphones, full-service food facilities, paid short-term parking, paid long-term parking, car rental agency, taxi stand, public transit connection.
Colleges/Universities in Aurora:
- Community College of Aurora (Full-time enrollment: 4,730; Location: 16000 E CentreTech Pky; Public; Website: www.ccaurora.edu)
- American Sentinel University (Full-time enrollment: 1,669; Location: 2260 South Xanadu Way; Private, for-profit; Website: www.americansentinel.edu; Offers Doctor's degree)
- Concorde Career College-Aurora (Full-time enrollment: 1,436; Location: 111 N. Havana Street; Private, for-profit; Website: www.concorde.edu)
- Colorado Technical University-Greenwood Village (Full-time enrollment: 923; Location: 3151 S Vaughn Way; Private, for-profit; Website: www.coloradotech.edu/Denver; Offers Doctor's degree)
- Pickens Technical College (Full-time enrollment: 777; Location: 500 Airport Blvd; Public; Website: www.pickenstech.org)
- Everest College-Aurora (Full-time enrollment: 598; Location: 14280 East Jewell Ave; Private, for-profit; Website: www.everest.edu/campus/aurora)
- Anthem College-Denver (Full-time enrollment: 431; Location: 350 Blackhawk Street; Private, for-profit; Website: www.anthem.edu)
- Ecotech Institute (Full-time enrollment: 378; Location: 1400 South Abilene Street; Private, for-profit; Website: ecotechinstitute.com)
- ITT Technical Institute-Aurora (Full-time enrollment: 278; Location: 12500 E Iliff Ave Ste 100; Private, for-profit; Website: www.itt-tech.edu)
- Utah College of Massage Therapy-Aurora (Full-time enrollment: 274; Location: 14107A East Exposition Avenue; Private, for-profit; Website: www.steinered.com/)
- Platt College-Aurora (Full-time enrollment: 265; Location: 3100 S Parker Rd; Private, for-profit; Website: www.plattcolorado.edu)
- Pima Medical Institute-South Denver (Full-time enrollment: 124; Location: 13750 E. Mississippi Avenue; Private, for-profit; Website: pmi.edu)
- Xenon International Academy-Denver (Full-time enrollment: 113; Location: 2231 S Peoria; Private, for-profit; Website: www.xenonacademy.net/index.html)
- Empire Beauty School-Aurora (Full-time enrollment: 72; Location: 16800 E. Mississippi Ave.; Private, for-profit; Website: www.empire.edu)
Other colleges/universities with over 2000 students near Aurora:
- Colorado State University-Global Campus (about 8 miles; Greenwood Village, CO; Full-time enrollment: 3,642)
- University of Denver (about 9 miles; Denver, CO; FT enrollment: 9,621)
- Jones International University (about 10 miles; Centennial, CO; FT enrollment: 2,556)
- Emily Griffith Technical College (about 11 miles; Denver, CO; FT enrollment: 2,460)
- University of Colorado Denver (about 11 miles; Denver, CO; FT enrollment: 14,727)
- Metropolitan State University of Denver (about 11 miles; Denver, CO; FT enrollment: 17,242)
- Community College of Denver (about 11 miles; Denver, CO; FT enrollment: 7,329)
Biggest public high schools in Aurora:
- GRANDVIEW HIGH SCHOOL (Students: 2,750, Location: 20500 EAST ARAPAHOE ROAD, Grades: 9-12)
- SMOKY HILL HIGH SCHOOL (Students: 2,498, Location: 16100 EAST SMOKY HILL ROAD, Grades: 9-12)
- AURORA CENTRAL HIGH SCHOOL (Students: 2,247, Location: 11700 EAST 11TH AVE, Grades: 9-12)
- RANGEVIEW HIGH SCHOOL (Students: 2,245, Location: 17599 EAST ILIFF AVE, Grades: 9-12)
- OVERLAND HIGH SCHOOL (Students: 2,135, Location: 12400 EAST JEWELL AVENUE, Grades: 9-12)
- CHEROKEE TRAIL HIGH SCHOOL (Students: 1,927, Location: 25901 ARAPAHOE PARKWAY, Grades: 9-12)
- HINKLEY HIGH SCHOOL (Students: 1,795, Location: 1250 CHAMBERS ROAD, Grades: 9-12)
- GATEWAY HIGH SCHOOL (Students: 1,751, Location: 1300 SOUTH SABLE BLVD, Grades: 9-12)
- OPTIONS SCHOOL (Students: 1,085, Location: 16500 E. SMOKEY HILL ROAD, Grades: KG-12)
- OPTIONS SCHOOL (Students: 1,085, Location: 11351 E. MONTVIEW BLVD, Grades: KG-12)
Private high schools in Aurora:
Biggest public elementary/middle schools in Aurora:
- PRAIRIE MIDDLE SCHOOL (Students: 1,589, Location: 12600 EAST JEWELL AVENUE, Grades: 6-8)
- LAREDO MIDDLE SCHOOL (Students: 1,248, Location: 5000 SOUTH LAREDO STREET, Grades: 6-8)
- LIBERTY MIDDLE SCHOOL (Students: 1,232, Location: 21500 EAST DRY CREEK ROAD, Grades: 6-8)
- THUNDER RIDGE MIDDLE SCHOOL (Students: 1,181, Location: 5250 SOUTH PICADILLY STREET, Grades: 6-8)
- HORIZON MIDDLE SCHOOL (Students: 1,151, Location: 3981 SOUTH RESERVOIR ROAD, Grades: 6-8)
- MRACHEK MIDDLE SCHOOL (Students: 1,148, Location: 1955 SOUTH TELLURIDE ST, Grades: 6-8)
- FALCON CREEK MIDDLE SCHOOL (Students: 1,138, Location: 6100 SOUTH GENOA STREET, Grades: 6-8)
- AURORA HILLS MIDDLE SCHOOL (Students: 1,063, Location: 1009 SOUTH UVALDA ST, Grades: 6-8)
- EASTRIDGE COMMUNITY ELEMENTARY SCHOOL (Students: 914, Location: 11777 EAST WESLEY AVENUE, Grades: PK-5)
- EAST MIDDLE SCHOOL (Students: 901, Location: 1275 FRASER ST, Grades: 6-8)
Private elementary/middle schools in Aurora:
- ST PIUS X CATHOLIC SCHOOL (Students: 284, Location: 13680 E 14TH PL, Grades: PK-8)
- PEACE WITH CHRIST CHRISTIAN SCHOOL (Students: 243, Location: 3290 S TOWER RD, Grades: PK-8)
- ST THERESE CATHOLIC SCHOOL (Students: 200, Location: 1200 KENTON ST, Grades: PK-8)
- MEADOWOOD CHRISTIAN SCHOOL (Students: 86, Location: 16051 E DARTMOUTH AVE, Grades: PK-8)
- CALVARY CHRISTIAN ACADEMY (Students: 76, Location: 18900 E HAMPDEN AVE, Grades: PK-8)
- CHRIST OUR REDEEMER LUTHERAN SCHOOL (Students: 52, Location: 17700 E ILIFF AVE, Grades: PK-8)
- WOOD ADVENTIST CHRISTIAN SCHOOL (Students: 34, Location: 1159 S MOLINE ST, Grades: PK-8)
User-submitted facts and corrections:
- Aurora is 80% in Arapahoe County, about 20% in Adams County
- Meadowood Christian School is Pre-K - 8th Grade
Points of interest:
Notable locations in Aurora: Meadow Hills Golf Course (A), Magee (B), Aurora Filtration Plant (C), Aurora Hills Golf Course (D), Centre Hills Golf Course (E), Springhill Golf Course (F), Aurora Hills Golf Course (G), Fitzsimons Golf Course (H), Heather Gardens Country Club (I), Heather Ridge Country Club (J), Charles A Wemlinger Water Treatment Plant (K), Murphy Creek Golf Course (L), Valley Country Club (M), Mesa (N), Victory Grange (O), Aurora Fire Department - Administration (P), Aurora History Museum (Q), Aurora Municipal Courthouse (R), Children's Hospital of Colorado Ambulance (S), Air Life Denver (T). Display/hide their locations on the map
Shopping Centers: Buckingham Square Shopping Center (1), Aurora Mall Shopping Center (2), Buckingham Square Shopping Mall (3), Hoffman Heights Shopping Center (4), Abilene Street Market Shopping Center (5), Aurora Mall Plaza West Shopping Center (6), Buckley Marketplace Shopping Center (7), Center Tech Plaza Shopping Center (8), Chambers Arizona Center Shopping Center (9). Display/hide their locations on the map
Main business address in Aurora: PROLOGIS (A). Display/hide its location on the map
Churches in Aurora include: Trinity Baptist Church (A), Southeast Church of Christ (B), Saint Therese Catholic Church (C), Saint Pius Tenth Church (D), Saint Martin In The Fields Episcopal Church (E), Saint Mark's Lutheran Church (F), Queen of Peace Catholic Church (G), Peaceful Rest Baptist Church (H), Peace With Christ Christian Center (I). Display/hide their locations on the map
Cemeteries: Saint Simeon Catholic Cemetery (1), Lewis Cemetery (2), Mount Nebo Cemetery (3), Eastlawn Memorial Gardens (4). Display/hide their locations on the map
Reservoirs: Quincy Reservoir (A), Aurora Reservoir (B). Display/hide their locations on the map
Creeks: Murphy Creek (A), Senac Creek (B), Coal Creek (C), Toll Gate Creek (D). Display/hide their locations on the map
Parks in Aurora include: Montview Park (1), Fairplay Park (2), City Center Park (3), Centre Point Park (4), Great Plains Park (5), Eagle Park (6), Sagebrush Park (7), Hampden Run Park (8), Flanders Park (9). Display/hide their locations on the map
Tourist attractions: Aurora City Government - Fire Department- South Region Libraries- Reservoirs- Quincy Reser (Cultural Attractions- Events- & Facilities; 18350 East Quincy Avenue) (1), Wings Over the Rockies Air Museum (Cultural Attractions- Events- & Facilities; 7711 East Academy Boulevard) (2), Casa de LA Cultura (Cultural Attractions- Events- & Facilities; 10231 East Colfax Avenue) (3), Aurora City Government - Fire Department- South Region Libraries- Tallyn's Reach Lib (Cultural Attractions- Events- & Facilities; 23911 East Arapahoe Road) (4), Plains Conservation Center (Cultural Attractions- Events- & Facilities; 21901 East Hampden Avenue) (5), NATL Cigarette Service CO (Amusement & Theme Parks; 14705 East 33rd Place) (6), Apollo-Stereo Music CO Inc (Amusement & Theme Parks; 14705 East 33rd Place) (7), Amf Bowling Centers - Amf Aurora Lanes (Amusement & Theme Parks; 16700 East Mississippi Avenue) (8), P & M Vending CO Inc (Amusement & Theme Parks; 14705 East 33rd Place) (9). Display/hide their approximate locations on the map
Hotels: Corporate Housing Solutions (10890 East Dartmouth Avenue) (1), Comfort Inn-Airport (16921 East 32nd Avenue) (2), Denver Airport Marriott at Gateway Park (16455 E 40th Cir) (3), Biltmore Motel (8900 East Colfax Avenue) (4), LA Quinta - Inns- Aurora (1011 South Abilene Street) (5), Comfort Inn Denver International Airport (16921 E 32nd Ave) (6), Crystal Inn DIA (3300 North Ouray Street) (7), Aspen's Cafe (3200 South Parker Road) (8), Hampton Inn Hotel - Aurora (1500 South Abilene Street) (9). Display/hide their approximate locations on the map
Courts: Arapahoe County - Community Services- Judicial Services Division- Court Ordered Community Serv (15400 East 14th Place) (1), Aurora City Government - City Attorney's Office- City Attorney's Municipal Court Of (14999 East Alameda Parkway) (2), Arapahoe County - District Attorney- County Court Divisions- Divisi (15400 East 14th Place) (3), Arapahoe County - District Attorney- County Court Divisions- Juvenile Diversion Pro (15400 East 14th Place) (4), ADM Wholesale Custom Computers and Hardware (3568 Peoria Street) (5). Display/hide their approximate locations on the map
Birthplace of: John Kerry - (born 1943), politician, Danny Dietz - Recipient of the Purple Heart medal, Aaron Moorehead - 2005 NFL player (Indianapolis Colts, born: Nov 5, 1980), Michael Chiesa - Mixed martial artist, Paul G. Tremblay - Author and editor, Sterling Wescott - Soccer player-coach, Brendan Schaub - Lacrosse player, Tiffany Vise - Figure skater, Maggie Flecknoe - Radio reporter, Eddie Gill - NBA player (Indiana Pacers, born: Aug 16, 1978).
Drinking water stations with addresses in Aurora and their reported violations in the past:
AURORA CITY OF (Population served: 325,000, Surface water):Past health violations:EAST CHERRY CREEK VALLEY WSD (Population served: 50,500, Purch surface water):Past monitoring violations:
- MCL, Acute (TCR) - In JAN-2011, Contaminant: Coliform. Follow-up actions: St Public Notif requested (JAN-18-2011), St Violation/Reminder Notice (JAN-18-2011), St Public Notif received (FEB-08-2011), St Compliance achieved (JUL-31-2011)
- Monitoring, Turbidity (Enhanced SWTR) - In MAY-2011, Contaminant: IESWTR. Follow-up actions: St Public Notif requested (JUL-11-2011), St Violation/Reminder Notice (JUL-11-2011), St Compliance achieved (DEC-30-2011)
Past monitoring violations:HILLCREST VILLAGE MHP (Population served: 1,505, Purch surface water):
- 696 regular monitoring violations
Past health violations:GREEN ACRES MHP (Population served: 325, Groundwater):Past monitoring violations:
- MCL, Monthly (TCR) - In SEP-2013, Contaminant: Coliform. Follow-up actions: St Public Notif requested (OCT-09-2013), St Violation/Reminder Notice (OCT-09-2013), St Compliance achieved (OCT-15-2013)
- Monitoring, Repeat Major (TCR) - In SEP-2013, Contaminant: Coliform (TCR). Follow-up actions: St Compliance achieved (SEP-23-2013), St Public Notif requested (OCT-09-2013), St Violation/Reminder Notice (OCT-09-2013)
- Monitoring, Source Water (GWR) - In SEP-2013, Contaminant: E. COLI. Follow-up actions: St Public Notif requested (OCT-09-2013), St Compliance achieved (OCT-09-2013), St Violation/Reminder Notice (OCT-09-2013)
- Monitoring, Source Water (GWR) - In SEP-2013, Contaminant: E. COLI. Follow-up actions: St Public Notif requested (OCT-09-2013), St Compliance achieved (OCT-09-2013), St Violation/Reminder Notice (OCT-09-2013)
- Monitoring, Source Water (GWR) - In SEP-2013, Contaminant: E. COLI. Follow-up actions: St Public Notif requested (OCT-09-2013), St Compliance achieved (OCT-09-2013), St Violation/Reminder Notice (OCT-09-2013)
- Monitoring and Reporting (DBP) - Between OCT-2012 and DEC-2012, Contaminant: Total Haloacetic Acids (HAA5). Follow-up actions: St Violation/Reminder Notice (JAN-28-2013), St Public Notif requested (JAN-28-2013)
- One other older monitoring violation
Past monitoring violations:GALAMBS MOBILE HOME AND RV PARK (Population served: 130, Groundwater):
- Monitoring and Reporting (DBP) - Between JUL-2011 and SEP-2011, Contaminant: Chlorine. Follow-up actions: St Public Notif requested (SEP-06-2011), St Violation/Reminder Notice (SEP-06-2011), St Compliance achieved (JAN-31-2012), St Public Notif received (JUN-28-2012)
- Follow-up Or Routine LCR Tap M/R - In OCT-01-2008, Contaminant: Lead and Copper Rule. Follow-up actions: St Public Notif requested (NOV-11-2008), St Violation/Reminder Notice (NOV-11-2008), St Compliance achieved (DEC-03-2008)
- Monitoring and Reporting (DBP) - Between JUL-2007 and SEP-2007, Contaminant: Chlorine. Follow-up actions: St Violation/Reminder Notice (NOV-21-2007), St Compliance achieved (DEC-12-2007)
- Monitoring and Reporting (DBP) - Between JAN-2007 and MAR-2007, Contaminant: Chlorine. Follow-up actions: St Violation/Reminder Notice (MAY-08-2007), St Compliance achieved (MAY-22-2007)
- Monitoring and Reporting (DBP) - Between JUL-2006 and SEP-2006, Contaminant: Chlorine. Follow-up actions: St Public Notif requested (DEC-18-2006), St Violation/Reminder Notice (DEC-18-2006), St Compliance achieved (JAN-19-2007)
- One routine major monitoring violation
- 2 other older monitoring violations
Past health violations:Past monitoring violations:
- MCL, Monthly (TCR) - In SEP-2012, Contaminant: Coliform. Follow-up actions: St Public Notif requested (SEP-27-2012), St Violation/Reminder Notice (SEP-27-2012), St Compliance achieved (MAR-31-2013)
- MCL, Monthly (TCR) - In JUN-2008, Contaminant: Coliform. Follow-up actions: St Public Notif requested (JUL-08-2008), St Violation/Reminder Notice (JUL-08-2008), St Compliance achieved (JAN-12-2009)
- MCL, Monthly (TCR) - In JUL-2007, Contaminant: Coliform. Follow-up actions: St Public Notif requested (JUL-16-2007), St Violation/Reminder Notice (JUL-16-2007), St Compliance achieved (2 times from FEB-19-2008 to APR-04-2008)
- MCL, Monthly (TCR) - In JUN-2007, Contaminant: Coliform. Follow-up actions: St Public Notif requested (JUL-16-2007), St Violation/Reminder Notice (JUL-16-2007), St Compliance achieved (2 times from FEB-19-2008 to APR-04-2008)
- MCL, Monthly (TCR) - In SEP-2005, Contaminant: Coliform. Follow-up actions: St Public Notif requested (OCT-05-2005), St Violation/Reminder Notice (OCT-05-2005), St Public Notif received (NOV-14-2005), St Compliance achieved (2 times from JAN-11-2007 to APR-04-2008)
- Follow-up Or Routine LCR Tap M/R - In OCT-01-2013, Contaminant: Lead and Copper Rule. Follow-up actions: St Violation/Reminder Notice (NOV-11-2013), St Public Notif requested (NOV-11-2013)
- Monitoring and Reporting (DBP) - Between JUL-2013 and SEP-2013, Contaminant: Chlorine. Follow-up actions: St Violation/Reminder Notice (NOV-07-2013), St Public Notif requested (NOV-07-2013)
- Monitoring and Reporting (DBP) - Between APR-2011 and JUN-2011, Contaminant: Chlorine. Follow-up actions: St Public Notif requested (JUN-21-2011), St Violation/Reminder Notice (JUN-21-2011), St Compliance achieved (NOV-30-2011), St Public Notif received (JUL-02-2012)
- Monitoring and Reporting (DBP) - Between JAN-2011 and DEC-2013, Contaminant: Total Haloacetic Acids (HAA5). Follow-up actions: St Violation/Reminder Notice (NOV-11-2013), St Public Notif requested (NOV-11-2013)
- Monitoring and Reporting (DBP) - Between JAN-2011 and DEC-2013, Contaminant: TTHM. Follow-up actions: St Violation/Reminder Notice (NOV-11-2013), St Public Notif requested (NOV-11-2013)
- 10 routine major monitoring violations
- 3 minor monitoring violations
- 96 regular monitoring violations
- 18 other older monitoring violations
Drinking water stations with addresses in Aurora that have no violations reported:
- SPINNEY MOUNTAIN RESERVOIR (Population served: 25, Primary Water Source Type: Groundwater)
| This city: | 2.6 people |
| Colorado: | 2.5 people |
| This city: | 65.3% |
| Whole state: | 63.9% |
| This city: | 7.1% |
| Whole state: | 6.5% |
Likely homosexual households (counted as self-reported same-sex unmarried-partner households)
- Lesbian couples: 0.4% of all households
- Gay men: 0.4% of all households
People in group quarters in Aurora in 2010:
- 1,145 people in nursing facilities/skilled-nursing facilities
- 429 people in federal detention centers
- 267 people in military barracks and dormitories (nondisciplinary)
- 228 people in residential treatment centers for juveniles (non-correctional)
- 149 people in other noninstitutional facilities
- 136 people in emergency and transitional shelters (with sleeping facilities) for people experiencing homelessness
- 76 people in residential treatment centers for adults
- 45 people in workers' group living quarters and job corps centers
- 33 people in group homes intended for adults
- 27 people in group homes for juveniles (non-correctional)
- 18 people in local jails and other municipal confinement facilities
- 3 people in in-patient hospice facilities
People in group quarters in Aurora in 2000:
- 812 people in nursing homes
- 340 people in federal prisons and detention centers
- 283 people in other noninstitutional group quarters
- 203 people in residential treatment centers for emotionally disturbed children
- 191 people in military barracks, etc.
- 72 people in other group homes
- 63 people in homes for the mentally retarded
- 43 people in local jails and other confinement facilities (including police lockups)
- 31 people in homes or halfway houses for drug/alcohol abuse
- 22 people in homes for the mentally ill
- 9 people in religious group quarters
- 8 people in hospitals/wards and hospices for chronically ill
- 8 people in hospices or homes for chronically ill
- 7 people in homes for the physically handicapped
- 3 people in orthopedic wards and institutions for the physically handicapped
- 2 people in wards in general hospitals for patients who have no usual home elsewhere
Banks with most branches in Aurora (2011 data):
- U.S. Bank National Association: 11 branches. Info updated 2012/01/30: Bank assets: $330,470.8 mil, Deposits: $236,091.5 mil, headquarters in Cincinnati, OH, positive income, 3121 total offices, Holding Company: U.S. Bancorp
- Wells Fargo Bank, National Association: 11 branches. Info updated 2011/04/05: Bank assets: $1,161,490.0 mil, Deposits: $905,653.0 mil, headquarters in Sioux Falls, SD, positive income, 6395 total offices, Holding Company: Wells Fargo & Company
- JPMorgan Chase Bank, National Association: 10 branches. Info updated 2011/11/10: Bank assets: $1,811,678.0 mil, Deposits: $1,190,738.0 mil, headquarters in Columbus, OH, positive income, International Specialization, 5577 total offices, Holding Company: Jpmorgan Chase & Co.
- FirstBank: 8 branches. Info updated 2011/12/05: Bank assets: $11,597.1 mil, Deposits: $10,530.4 mil, headquarters in Lakewood, CO, positive income, Mortgage Lending Specialization, 130 total offices, Holding Company: Firstbank Holding Company
- KeyBank National Association: 4090 South Parker Road Branch, East Arizona Branch, South Tower Aurora Branch, Havana Gardens Branch, Smoky Hill & Buckley Branch, 3000 South Peoria Branch. Info updated 2008/03/03: Bank assets: $86,198.8 mil, Deposits: $64,214.8 mil, headquarters in Cleveland, OH, positive income, Commercial Lending Specialization, 1067 total offices, Holding Company: Keycorp
- Bank of the West: Buckingham, Saddlerock, Heather Gardens Branch, Aurora Town Center, Aurora Branch. Info updated 2009/11/16: Bank assets: $62,408.3 mil, Deposits: $43,995.2 mil, headquarters in San Francisco, CA, positive income, 647 total offices, Holding Company: Bnp Paribas
- TCF National Bank: Havana Mexico #7024, Buckley #7019, Quincy & Buckley Branch, 6th & Chambers #7029 Branch, Tower King Sooper #7010. Info updated 2009/11/23: Bank assets: $19,007.0 mil, Deposits: $12,377.0 mil, headquarters in Sioux Falls, SD, positive income, Commercial Lending Specialization, 441 total offices, Holding Company: Tcf Financial Corporation
- Academy Bank, National Association: Walmart Aurora Branch, Aurora Smokey Hill Branch, Aurora South Financial Center, Tower Road Branch. Info updated 2008/06/10: Bank assets: $282.1 mil, Deposits: $218.0 mil, headquarters in Colorado Springs, CO, positive income, Commercial Lending Specialization, 54 total offices, Holding Company: Dickinson Financial Corporation Ii
- CoreFirst Bank & Trust: Aurora Havana Branch, Corefirst Bank & Trust - Safeway #19, Corefirst Bank & Trust. Info updated 2007/10/03: Bank assets: $1,154.4 mil, Deposits: $811.4 mil, headquarters in Topeka, KS, positive income, Commercial Lending Specialization, 35 total offices, Holding Company: Commerce Bank And Trust Holding Company Employee Stock Ownership Plan
- 10 other banks with 14 local branches
For population 15 years and over in Aurora:
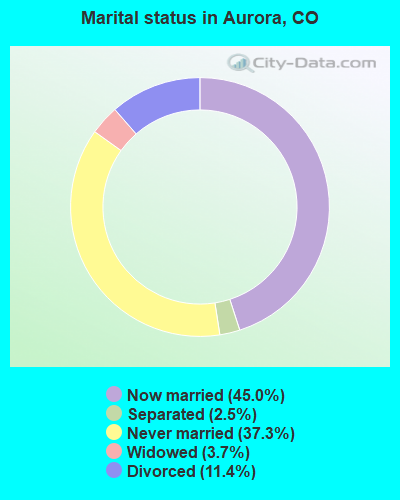
- Never married: 37.3%
- Now married: 45.0%
- Separated: 2.5%
- Widowed: 3.7%
- Divorced: 11.4%
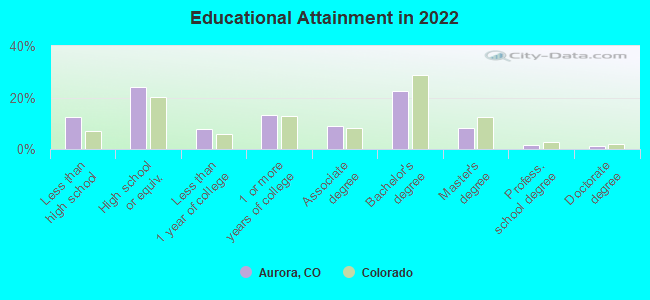
For population 25 years and over in Aurora:
- High school or higher: 87.6%
- Bachelor's degree or higher: 33.5%
- Graduate or professional degree: 10.9%
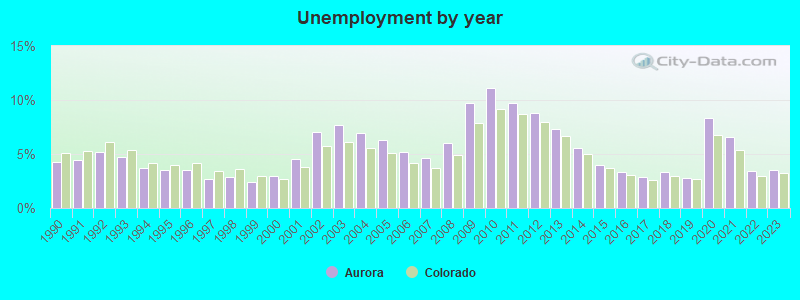
- Unemployed: 4.2%
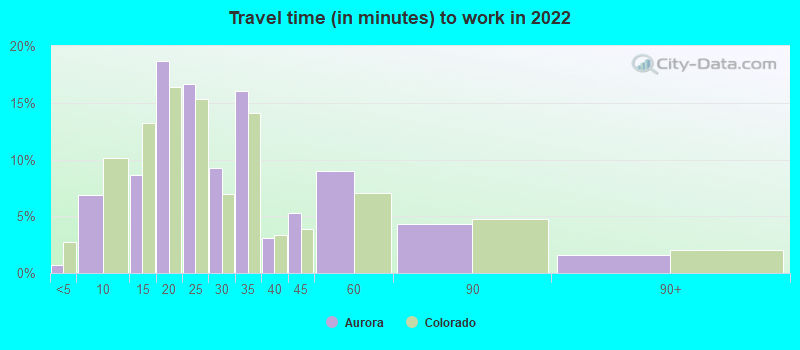
- Mean travel time to work (commute): 23.4 minutes
| Here: | 12.9 |
| Colorado average: | 11.1 |
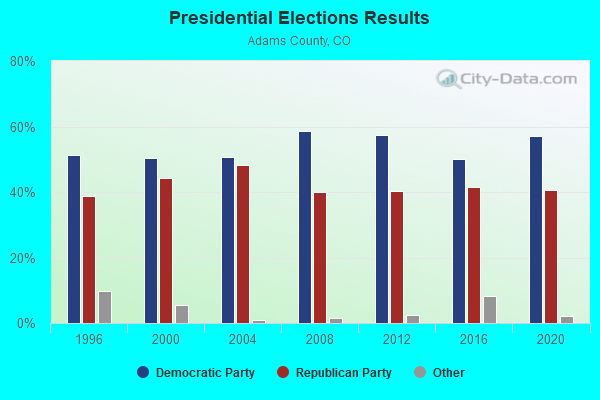
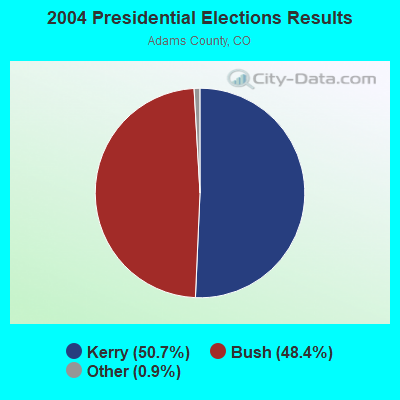
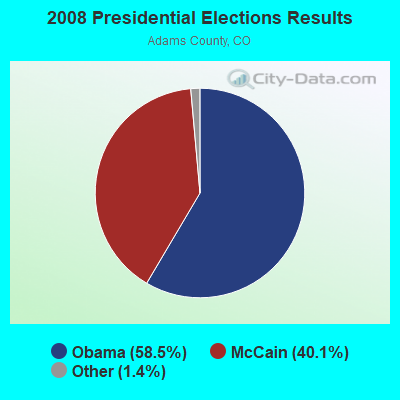
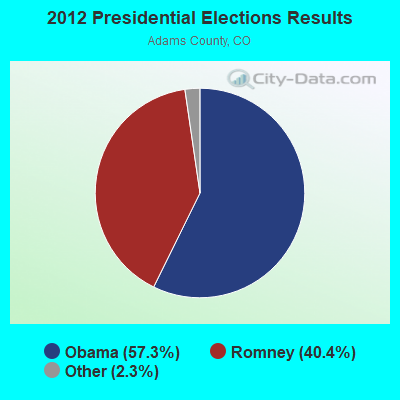
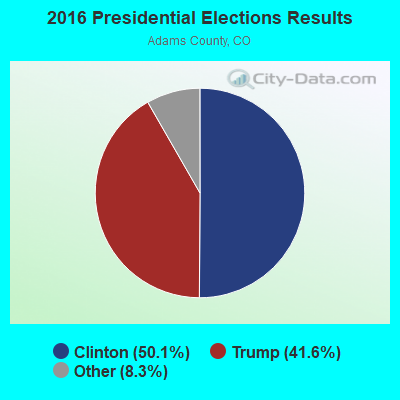
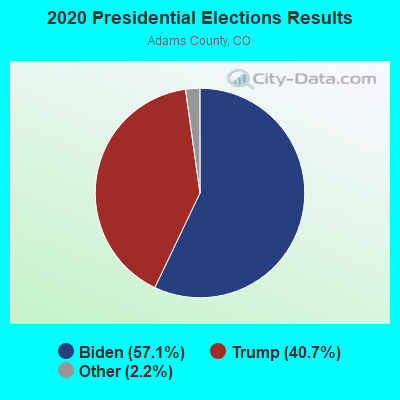
Graphs represent county-level data. Detailed 2008 Election Results
Neighborhoods in Aurora:
(Aurora, Colorado Neighborhood Map)- Abshire neighborhood
- Acme Tower neighborhood
- Airport Distribution Center neighborhood
- Airways Business Center neighborhood
- Akron Street neighborhood
- Altura neighborhood
- American neighborhood
- Arts District neighborhood
- Aurora neighborhood
- Aurora Business Center neighborhood
- Aurora Cascades neighborhood
- Aurora Commerce Center neighborhood
- Aurora District neighborhood
- Aurora East neighborhood
- Aurora Meadows neighborhood
- Aurora Park neighborhood
- Aurora Point Plaza neighborhood
- Aurora Vista neighborhood
- Beeler Townhouse Condominiums neighborhood
- Blue Spruce Energy Center neighborhood
- Boonedocks neighborhood
- Boston Heights neighborhood
- Buzard Bay neighborhood
- Carlton Estates neighborhood
- Century neighborhood
- Chambers neighborhood
- Chambers Heights neighborhood
- Cherry Creek District neighborhood
- City Center neighborhood
- Colfax Gardens neighborhood
- Colfax Mini Mall neighborhood
- Commerce neighborhood
- Commerce Park No neighborhood
- Cottage Grove neighborhood
- Cottonwood Industrial Park neighborhood
- Country Acres neighborhood
- Crossland neighborhood
- Daybreak at Tower neighborhood
- Dayton Condominiums neighborhood
- Del Mar Parkway neighborhood
- Dutch Mill Village neighborhood
- Eagle Estates neighborhood
- Eagle Street neighborhood
- Eagle Village neighborhood
- Eastern Plains neighborhood
- Eastlawn Memorial Gardens neighborhood
- Eastpark neighborhood
- Eastwood Park neighborhood
- Edgar Acres #1 neighborhood
- Elvessie Nelson Farm neighborhood
- Envirotest Station neighborhood
- Fairway neighborhood
- First Creek Farm Condominiums neighborhood
- Fitzsimons neighborhood
- Fletcher Plaza neighborhood
- Florence Square neighborhood
- Frazier neighborhood
- Friendly Village of Aurora neighborhood
- Front Range neighborhood
- Galena Gardens neighborhood
- Gateway Industrial Park neighborhood
- Gateway Park neighborhood
- Gifford Gardens neighborhood
- Global Business Center neighborhood
- Granby Commons neighborhood
- Gutheil Gardens neighborhood
- Haven Acres neighborhood
- Helen Manor neighborhood
- Highline Village neighborhood
- Hillview neighborhood
- Hospitality Acre neighborhood
- International Plaza neighborhood
- Jackquelyn Ranch neighborhood
- Jewell Heights (Hoffman Heights) neighborhood
- Joliet Village neighborhood
- Jqh Commercial Park neighborhood
- Kane Condominiums neighborhood
- Karen Park neighborhood
- Kennedy neighborhood
- Lady Nelson Townhomes neighborhood
- Lima Street Condominiums neighborhood
- Main Street neighborhood
- Majestic Commercenter neighborhood
- Marvel Homes neighborhood
- Mid America neighborhood
- Mills neighborhood
- Montview Gardens neighborhood
- Moormans neighborhood
- Morbro Industrial Park neighborhood
- Morris Heights neighborhood
- Mountain States Industrial Park neighborhood
- Murray Johnson Farm neighborhood
- New England Heights neighborhood
- Norfolk Glen neighborhood
- Norfolk Place neighborhood
- North Satellite neighborhood
- Northwest neighborhood
- Old Country Estates neighborhood
- Original Aurora neighborhood
- Pacifica Gateway Plaza neighborhood
- Palo Duro neighborhood
- Park Chambers neighborhood
- Peoria 33 Condominiums neighborhood
- Phillips neighborhood
- Prologis Park neighborhood
- Quincy Plains neighborhood
- Raft Club Condominiums neighborhood
- Sable Place Condominiums neighborhood
- Sable Village neighborhood
- San Miguel Condominiums neighborhood
- Sand Creek neighborhood
- Shady Meadows Mobile Home Park neighborhood
- Singletree neighborhood
- Sky Ranch neighborhood
- Skylark Townhomes neighborhood
- Smith Road Industrial Center neighborhood
- Southeast neighborhood
- Stapleton South Business Park neighborhood
- Star K Ranch Industrial Center neighborhood
- Straits neighborhood
- The Square at Fitzsimons neighborhood
- The Vineyard neighborhood
- Timberline neighborhood
- Tollgate Valley Gardens neighborhood
- Tower Center neighborhood
- Twin Ridge neighborhood
- United Aurora neighborhood
- United Properties Southwest neighborhood
- Upland Park neighborhood
- Virginia Heights neighborhood
- Wagon Wheel neighborhood
- Westerly Creek Condominiums neighborhood
- Wheeling Condominiums neighborhood
- Wiley Heights neighborhood
- Windler neighborhood
- Woodmor Village Condominiums neighborhood
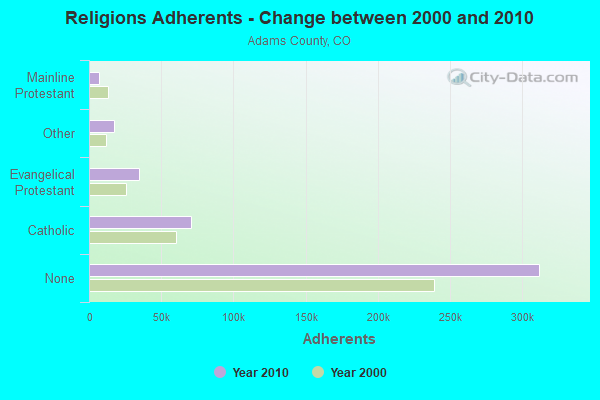
Religion statistics for Aurora, CO (based on Adams County data)
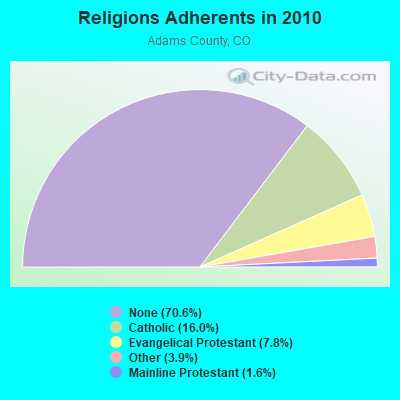
| Religion | Adherents | Congregations |
|---|---|---|
| Catholic | 70,598 | 11 |
| Evangelical Protestant | 34,568 | 159 |
| Other | 17,157 | 38 |
| Mainline Protestant | 7,133 | 33 |
| Black Protestant | 195 | 2 |
| Orthodox | - | 1 |
| None | 311,952 | - |
Food Environment Statistics:
| Adams County: | 1.16 / 10,000 pop. |
| Colorado: | 1.50 / 10,000 pop. |
| This county: | 0.17 / 10,000 pop. |
| State: | 0.15 / 10,000 pop. |
| Adams County: | 0.21 / 10,000 pop. |
| Colorado: | 0.45 / 10,000 pop. |
| Adams County: | 2.47 / 10,000 pop. |
| State: | 3.13 / 10,000 pop. |
| Here: | 4.66 / 10,000 pop. |
| State: | 8.99 / 10,000 pop. |
| This county: | 6.8% |
| Colorado: | 5.3% |
| Adams County: | 24.3% |
| Colorado: | 18.4% |
| This county: | 10.0% |
| State: | 9.6% |
Health and Nutrition:
| This city: | 48.1% |
| State: | 49.4% |
| Here: | 46.6% |
| Colorado: | 47.8% |
| Aurora: | 28.6 |
| Colorado: | 28.5 |
| Aurora: | 20.6% |
| Colorado: | 20.7% |
| Aurora: | 10.7% |
| Colorado: | 9.7% |
| Aurora: | 6.8 |
| Colorado: | 6.8 |
| Here: | 32.7% |
| Colorado: | 33.3% |
| This city: | 56.6% |
| Colorado: | 57.3% |
| This city: | 81.2% |
| State: | 80.2% |
More about Health and Nutrition of Aurora, CO Residents
Aurora government finances - Expenditure in 2021 (per resident):
- Construction - Water Utilities: $43,194,000 ($109.76)
Regular Highways: $37,009,000 ($94.04)
Sewerage: $31,247,000 ($79.40)
Parks and Recreation: $6,276,000 ($15.95)
General - Other: $1,331,000 ($3.38)
Central Staff Services: $200,000 ($0.51)
Local Fire Protection: $170,000 ($0.43)
- Current Operations - Police Protection: $127,220,000 ($323.27)
General - Other: $92,637,000 ($235.40)
Water Utilities: $65,776,000 ($167.14)
Local Fire Protection: $62,349,000 ($158.43)
Sewerage: $51,982,000 ($132.09)
Central Staff Services: $47,269,000 ($120.11)
Parks and Recreation: $41,325,000 ($105.01)
Regular Highways: $37,628,000 ($95.61)
Financial Administration: $24,507,000 ($62.27)
Housing and Community Development: $15,357,000 ($39.02)
Judicial and Legal Services: $13,264,000 ($33.70)
Libraries: $5,761,000 ($14.64)
- General - Interest on Debt: $10,390,000 ($26.40)
- Intergovernmental to Local - Other - Sewerage: $29,399,000 ($74.70)
- Other Capital Outlay - Water Utilities: $51,997,000 ($132.13)
Regular Highways: $4,994,000 ($12.69)
Sewerage: $2,286,000 ($5.81)
Parks and Recreation: $2,164,000 ($5.50)
Police Protection: $942,000 ($2.39)
Local Fire Protection: $930,000 ($2.36)
Central Staff Services: $38,000 ($0.10)
- Total Salaries and Wages: $248,116,000 ($630.48)
- Water Utilities - Interest on Debt: $18,575,000 ($47.20)
Aurora government finances - Revenue in 2021 (per resident):
- Charges - Sewerage: $72,449,000 ($184.10)
Parks and Recreation: $8,677,000 ($22.05)
- Federal Intergovernmental - Housing and Community Development: $2,889,000 ($7.34)
Other: $2,870,000 ($7.29)
- Local Intergovernmental - Other: $13,446,000 ($34.17)
Highways: $5,063,000 ($12.87)
Water Utilities: $35,000 ($0.09)
- Miscellaneous - General Revenue - Other: $68,726,000 ($174.64)
Interest Earnings: $20,260,000 ($51.48)
Fines and Forfeits: $4,126,000 ($10.48)
Special Assessments: $89,000 ($0.23)
- Revenue - Water Utilities: $135,566,000 ($344.48)
- State Intergovernmental - Other: $48,713,000 ($123.78)
Highways: $11,645,000 ($29.59)
- Tax - General Sales and Gross Receipts: $289,061,000 ($734.52)
Property: $83,180,000 ($211.37)
Other Selective Sales: $20,314,000 ($51.62)
Other License: $14,745,000 ($37.47)
Public Utilities Sales: $14,238,000 ($36.18)
Occupation and Business License - Other: $9,245,000 ($23.49)
Motor Vehicle License: $1,092,000 ($2.77)
Alcoholic Beverage License: $383,000 ($0.97)
Amusements License: $21,000 ($0.05)
Aurora government finances - Debt in 2021 (per resident):
- Long Term Debt - Outstanding Unspecified Public Purpose: $602,996,000 ($1532.25)
Beginning Outstanding - Unspecified Public Purpose: $573,201,000 ($1456.54)
Beginning Outstanding - Public Debt for Private Purpose: $104,785,000 ($266.26)
Retired Nonguaranteed - Public Debt for Private Purpose: $104,785,000 ($266.26)
Issue, Unspecified Public Purpose: $43,770,000 ($111.22)
Retired Unspecified Public Purpose: $13,975,000 ($35.51)
Aurora government finances - Cash and Securities in 2021 (per resident):
- Other Funds - Cash and Securities: $678,953,000 ($1725.26)
- Sinking Funds - Cash and Securities: $3,215,000 ($8.17)
11.65% of this county's 2021 resident taxpayers lived in other counties in 2020 ($55,974 average adjusted gross income)
| Here: | 11.65% |
| Colorado average: | 11.28% |
0.01% of residents moved from foreign countries ($73 average AGI)
Adams County: 0.01% Colorado average: 0.05%
Top counties from which taxpayers relocated into this county between 2020 and 2021:
| from Denver County, CO | |
| from Jefferson County, CO | |
| from Arapahoe County, CO |
11.37% of this county's 2020 resident taxpayers moved to other counties in 2021 ($59,124 average adjusted gross income)
| Here: | 11.37% |
| Colorado average: | 11.05% |
0.01% of residents moved to foreign countries ($78 average AGI)
Adams County: 0.01% Colorado average: 0.03%
Top counties to which taxpayers relocated from this county between 2020 and 2021:
| to Denver County, CO | |
| to Jefferson County, CO | |
| to Arapahoe County, CO |
| Businesses in Aurora, CO | ||||
| Name | Count | Name | Count | |
|---|---|---|---|---|
| 24 Hour Fitness | 4 | Journeys | 2 | |
| 7-Eleven | 23 | Justice | 2 | |
| AMF Bowling | 1 | KFC | 8 | |
| AT&T | 10 | Kmart | 1 | |
| Ace Hardware | 3 | Kohl's | 3 | |
| Advance Auto Parts | 5 | Kroger | 9 | |
| Aeropostale | 1 | La Quinta | 1 | |
| Albertsons | 2 | Lane Bryant | 2 | |
| American Eagle Outfitters | 1 | Lane Furniture | 2 | |
| Applebee's | 2 | LensCrafters | 3 | |
| Arby's | 4 | Little Caesars Pizza | 4 | |
| AutoZone | 4 | Long John Silver's | 2 | |
| Baja Fresh Mexican Grill | 1 | Lowe's | 3 | |
| Bakers | 1 | Macy's | 1 | |
| Bally Total Fitness | 1 | Marriott | 3 | |
| Barnes & Noble | 2 | Marshalls | 1 | |
| Baskin-Robbins | 3 | MasterBrand Cabinets | 11 | |
| Bath & Body Works | 3 | Mazda | 1 | |
| Bed Bath & Beyond | 3 | McDonald's | 14 | |
| Best Western | 1 | Men's Wearhouse | 3 | |
| Big O Tires | 4 | Motel 6 | 1 | |
| Blockbuster | 4 | Motherhood Maternity | 2 | |
| Brunswick Bowling & Billiards | 1 | New Balance | 3 | |
| Burger King | 9 | New York & Co | 2 | |
| Burlington Coat Factory | 1 | Nike | 29 | |
| Cambria | 1 | Nissan | 1 | |
| Caribou Coffee | 2 | Office Depot | 4 | |
| Carl\s Jr. | 2 | OfficeMax | 3 | |
| Catherines | 1 | Old Navy | 1 | |
| Charlotte Russe | 1 | Olive Garden | 2 | |
| Chevrolet | 2 | On The Border | 1 | |
| Chick-Fil-A | 4 | Outback | 1 | |
| Chico's | 1 | Outback Steakhouse | 1 | |
| Chipotle | 8 | Panda Express | 3 | |
| Chuck E. Cheese's | 1 | Panera Bread | 2 | |
| Church's Chicken | 1 | Papa John's Pizza | 2 | |
| Cinnabon | 1 | Payless | 6 | |
| Circle K | 9 | Penske | 1 | |
| Cold Stone Creamery | 4 | PetSmart | 3 | |
| Coldwater Creek | 1 | Pizza Hut | 6 | |
| Comfort Inn | 2 | Popeyes | 3 | |
| Costco | 1 | Qdoba Mexican Grill | 4 | |
| Cricket Wireless | 21 | Quiznos | 2 | |
| Crossland Economy Studios | 1 | RadioShack | 5 | |
| Curves | 4 | Red Lobster | 2 | |
| DHL | 2 | Red Robin | 2 | |
| Dairy Queen | 8 | Rite Aid | 2 | |
| Deb | 1 | Ruby Tuesday | 1 | |
| Dennys | 3 | SAS Shoes | 1 | |
| Discount Tire | 6 | SONIC Drive-In | 4 | |
| Domino's Pizza | 5 | Safeway | 5 | |
| DressBarn | 2 | Sam's Club | 2 | |
| Dressbarn | 2 | Sears | 5 | |
| Eddie Bauer | 1 | Skechers USA | 1 | |
| Express | 1 | Sleep Inn | 1 | |
| Extended Stay Deluxe | 1 | Spencer Gifts | 1 | |
| Famous Footwear | 4 | Sprint Nextel | 4 | |
| FedEx | 33 | Starbucks | 24 | |
| Finish Line | 2 | Subaru | 1 | |
| Firestone Complete Auto Care | 4 | Subway | 11 | |
| Foot Locker | 1 | Super 8 | 1 | |
| Ford | 1 | T-Mobile | 18 | |
| GNC | 6 | T.G.I. Driday's | 2 | |
| GameStop | 9 | T.J.Maxx | 2 | |
| Gap | 1 | Taco Bell | 9 | |
| Gymboree | 1 | Talbots | 1 | |
| H&R Block | 13 | Target | 5 | |
| Hilton | 2 | Toyota | 1 | |
| Hobby Lobby | 1 | Toys"R"Us | 4 | |
| Holiday Inn | 1 | U-Haul | 11 | |
| Hollister Co. | 1 | UPS | 35 | |
| Home Depot | 4 | Vans | 9 | |
| Homestead Studio Suites | 1 | Verizon Wireless | 8 | |
| Hot Topic | 2 | Victoria's Secret | 2 | |
| IHOP | 2 | Village Inn | 7 | |
| InTown Suites | 1 | Volkswagen | 1 | |
| JCPenney | 2 | Vons | 6 | |
| Jack In The Box | 1 | Waffle House | 1 | |
| Jamba Juice | 2 | Walgreens | 12 | |
| Jimmy John's | 5 | Walmart | 4 | |
| JoS. A. Bank | 1 | Wendy's | 8 | |
| Jones New York | 1 | YMCA | 1 | |
Strongest AM radio stations in Aurora:
- KMXA (1090 AM; 50 kW; AURORA, CO; Owner: ENTRAVISION HOLDINGS, LLC)
- KOA (850 AM; 50 kW; DENVER, CO; Owner: JACOR BROADCASTING OF COLORADO, INC.)
- KLTT (670 AM; 50 kW; COMMERCE CITY, CO; Owner: KLZ RADIO, INC.)
- KNRC (1150 AM; 10 kW; ENGLEWOOD, CO; Owner: NRC BROADCASTING, INC.)
- KKZN (760 AM; 50 kW; THORNTON, CO; Owner: JACOR BROADCASTING OF COLORADO, INC.)
- KRKS (990 AM; 10 kW; DENVER, CO; Owner: SALEM MEDIA OF COLORADO, INC.)
- KCUV (1510 AM; 25 kW; LITTLETON, CO; Owner: PEOPLE WIRELESS, INC.)
- KADZ (1550 AM; 10 kW; ARVADA, CO; Owner: ABC, INC.)
- KEZW (1430 AM; 10 kW; AURORA, CO; Owner: ENTERCOM DENVER LICENSE, LLC)
- KDDZ (1690 AM; 10 kW; ARVADA, CO; Owner: ABC, INC.)
- KLZ (560 AM; 5 kW; DENVER, CO; Owner: KLZ RADIO, INC.)
- KBJD (1650 AM; 10 kW; DENVER, CO; Owner: SALEM MEDIA OF COLORADO, INC.)
- KBNO (1280 AM; 5 kW; DENVER, CO; Owner: LATINO COMMUNICATIONS, LLC)
Strongest FM radio stations in Aurora:
- KQMT (99.5 FM; DENVER, CO; Owner: ENTERCOM DENVER LICENSE, LLC)
- KJMN (92.1 FM; CASTLE ROCK, CO; Owner: ENTRAVISION HOLDINGS, LLC)
- KALC (105.9 FM; DENVER, CO; Owner: ENTERCOM DENVER LICENSE, LLC)
- KBPI (106.7 FM; DENVER, CO; Owner: JACOR BROADCASTING OF COLORADO, INC.)
- KOSI (101.1 FM; DENVER, CO; Owner: ENTERCOM DENVER LICENSE, LLC)
- KFMD (95.7 FM; DENVER, CO; Owner: CITICASTERS LICENSES, L.P.)
- KRFX (103.5 FM; DENVER, CO; Owner: JACOR BROADCASTING OF COLORADO, INC.)
- KQKS (107.5 FM; LAKEWOOD, CO; Owner: JEFFERSON-PILOT COMMUNICATIONS COMPANY OF COLORADO)
- KXKL-FM (105.1 FM; DENVER, CO; Owner: INFINITY RADIO OPERATIONS INC.)
- KLDV (91.1 FM; MORRISON, CO; Owner: EDUCATIONAL MEDIA FOUNDATION)
- KIMN (100.3 FM; DENVER, CO; Owner: INFINITY RADIO OPERATIONS INC.)
- KVOD (90.1 FM; DENVER, CO; Owner: PUBLIC BROADCASTING OF COLORADO, INC)
- KJCD (104.3 FM; LONGMONT, CO; Owner: JEFFERSON-PILOT COMMUNICATIONS COMPANY OF COLORADO)
- KBCO-FM (97.3 FM; BOULDER, CO; Owner: CITICASTERS LICENSES, L.P.)
- KUVO (89.3 FM; DENVER, CO; Owner: DENVER EDUCATIONAL BROADCASTING)
- KYGO-FM (98.5 FM; DENVER, CO; Owner: JEFFERSON-PILOT COMMUNICATIONS COMPANY OF COLORADO)
- KXPK (96.5 FM; EVERGREEN, CO; Owner: ENTRAVISION HOLDINGS, LLC)
- KDJM (92.5 FM; BROOMFIELD, CO; Owner: INFINITY RADIO OPERATIONS INC.)
- KRKS-FM (94.7 FM; LAFAYETTE, CO; Owner: SALEM MEDIA OF COLORADO, INC)
- KTCL (93.3 FM; FORT COLLINS, CO; Owner: JACOR BROADCASTING OF COLORADO, INC.)
TV broadcast stations around Aurora:
- K48FW (Channel 48; DENVER, CO; Owner: TRINITY BROADCASTING NETWORK)
- KDEO-LP (Channel 38; AURORA, CO; Owner: PETER B. VAN DE SANDE)
- KDEV-LP (Channel 62; AURORA, CO; Owner: TIGER EYE BROADCASTING CORPORATION)
- KMGH-TV (Channel 7; DENVER, CO; Owner: MCGRAW-HILL BROADCASTING COMPANY, INC.)
- KRMA-TV (Channel 6; DENVER, CO; Owner: ROCKY MOUNTAIN PUBLIC BROADCASTING NETWORK, INC.)
- KUSA-TV (Channel 9; DENVER, CO; Owner: MULTIMEDIA HOLDINGS CORPORATION)
- KTVD (Channel 20; DENVER, CO; Owner: TWENVER BROADCAST, INC.)
- KCNC-TV (Channel 4; DENVER, CO; Owner: CBS TELEVISION STATIONS INC.)
- KDEN (Channel 25; LONGMONT, CO; Owner: LONGMONT CHANNEL 25, INC.)
- KWGN-TV (Channel 2; DENVER, CO; Owner: KWGN INC.)
- KMAS-LP (Channel 63; DENVER, CO; Owner: TELEMUNDO OF STEAMBOAT SPRINGS COLO. LIC. CORP.)
- KWHD (Channel 53; CASTLE ROCK, CO; Owner: LESEA BROADCASTING CORPORATION)
- KDVR (Channel 31; DENVER, CO; Owner: FOX TELEVISION STATIONS, INC.)
- KPXC-TV (Channel 59; DENVER, CO; Owner: PAXSON DENVER LICENSE, INC.)
- K66FB (Channel 66; DENVER, CO; Owner: TRINITY BROADCASTING NETWORK)
- National Bridge Inventory (NBI) Statistics
- 261Number of bridges
- 3,294ft / 1,004mTotal length
- $25,442,000Total costs
- 6,870,261Total average daily traffic
- 457,585Total average daily truck traffic
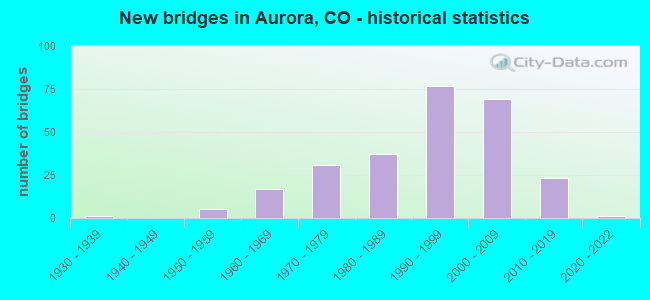
- New bridges - historical statistics
- 11930-1939
- 51950-1959
- 171960-1969
- 311970-1979
- 371980-1989
- 771990-1999
- 692000-2009
- 232010-2019
- 12020-2022
FCC Registered Antenna Towers: 529 (See the full list of FCC Registered Antenna Towers)
FCC Registered Commercial Land Mobile Towers: 4 (See the full list of FCC Registered Commercial Land Mobile Towers in Aurora, CO)
FCC Registered Private Land Mobile Towers: 6 (See the full list of FCC Registered Private Land Mobile Towers)
FCC Registered Broadcast Land Mobile Towers: 184 (See the full list of FCC Registered Broadcast Land Mobile Towers)
FCC Registered Microwave Towers: 290 (See the full list of FCC Registered Microwave Towers in this town)
FCC Registered Paging Towers: 12 (See the full list of FCC Registered Paging Towers)
FCC Registered Maritime Coast & Aviation Ground Towers: 5 (See the full list of FCC Registered Maritime Coast & Aviation Ground Towers)
FCC Registered Amateur Radio Licenses: 1,686 (See the full list of FCC Registered Amateur Radio Licenses in Aurora)
FAA Registered Aircraft Manufacturers and Dealers: 19 (See the full list of FAA Registered Manufacturers and Dealers in Aurora)
FAA Registered Aircraft: 138 (See the full list of FAA Registered Aircraft)
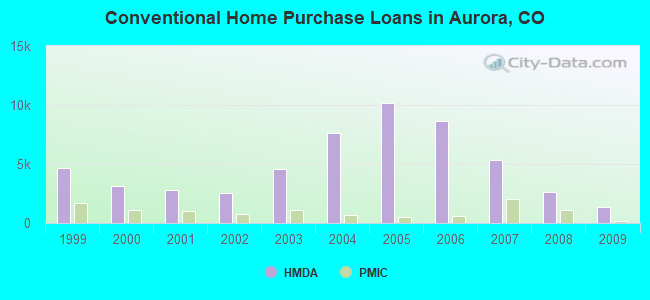
| Home Mortgage Disclosure Act Aggregated Statistics For Year 2009 (Based on 58 full and 19 partial tracts) | ||||||||||||||
| A) FHA, FSA/RHS & VA Home Purchase Loans | B) Conventional Home Purchase Loans | C) Refinancings | D) Home Improvement Loans | E) Loans on Dwellings For 5+ Families | F) Non-occupant Loans on < 5 Family Dwellings (A B C & D) | G) Loans On Manufactured Home Dwelling (A B C & D) | ||||||||
|---|---|---|---|---|---|---|---|---|---|---|---|---|---|---|
| Number | Average Value | Number | Average Value | Number | Average Value | Number | Average Value | Number | Average Value | Number | Average Value | Number | Average Value | |
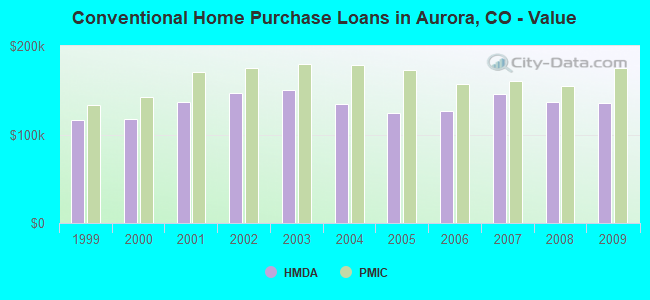
| LOANS ORIGINATED | 2,894 | $155,031 | 1,364 | $135,532 | 5,354 | $181,298 | 225 | $52,440 | 10 | $6,239,846 | 674 | $101,078 | 14 | $47,624 |
| APPLICATIONS APPROVED, NOT ACCEPTED | 184 | $155,275 | 150 | $146,447 | 564 | $179,748 | 47 | $25,621 | 2 | $184,500 | 76 | $98,148 | 2 | $50,405 |
| APPLICATIONS DENIED | 444 | $148,174 | 302 | $124,264 | 1,972 | $172,302 | 282 | $32,288 | 7 | $433,571 | 231 | $108,561 | 18 | $51,657 |
| APPLICATIONS WITHDRAWN | 255 | $152,864 | 174 | $149,599 | 1,232 | $177,851 | 49 | $109,593 | 1 | $347,000 | 139 | $105,380 | 2 | $57,500 |
| FILES CLOSED FOR INCOMPLETENESS | 62 | $155,239 | 34 | $145,578 | 376 | $178,517 | 12 | $82,892 | 0 | $0 | 17 | $147,074 | 1 | $101,620 |
Detailed mortgage data for all 70 tracts in Aurora, CO
| Private Mortgage Insurance Companies Aggregated Statistics For Year 2009 (Based on 57 full and 19 partial tracts) | ||||||
| A) Conventional Home Purchase Loans | B) Refinancings | C) Non-occupant Loans on < 5 Family Dwellings (A & B) | ||||
|---|---|---|---|---|---|---|
| Number | Average Value | Number | Average Value | Number | Average Value | |
| LOANS ORIGINATED | 194 | $175,043 | 159 | $208,101 | 7 | $170,879 |
| APPLICATIONS APPROVED, NOT ACCEPTED | 80 | $179,402 | 83 | $218,539 | 13 | $112,463 |
| APPLICATIONS DENIED | 56 | $170,871 | 50 | $218,198 | 2 | $198,540 |
| APPLICATIONS WITHDRAWN | 21 | $176,501 | 15 | $201,253 | 0 | $0 |
| FILES CLOSED FOR INCOMPLETENESS | 23 | $119,391 | 4 | $246,835 | 10 | $71,148 |
2002 - 2018 National Fire Incident Reporting System (NFIRS) incidents
- Fire incident types reported to NFIRS in Aurora, CO
- 3,76839.5%Structure Fires
- 3,76339.4%Outside Fires
- 1,30913.7%Mobile Property/Vehicle Fires
- 7087.4%Other
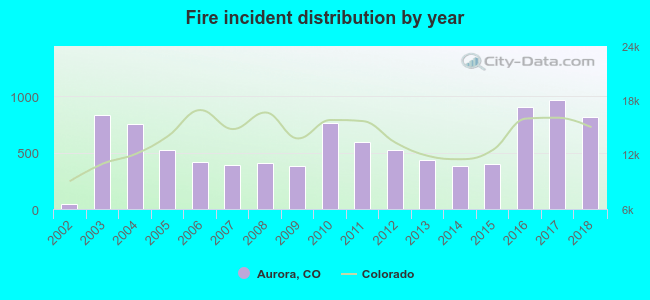 According to the data from the years 2002 - 2018 the average number of fire incidents per year is 562. The highest number of fires - 965 took place in 2017, and the least - 48 in 2002. The data has an increasing trend.
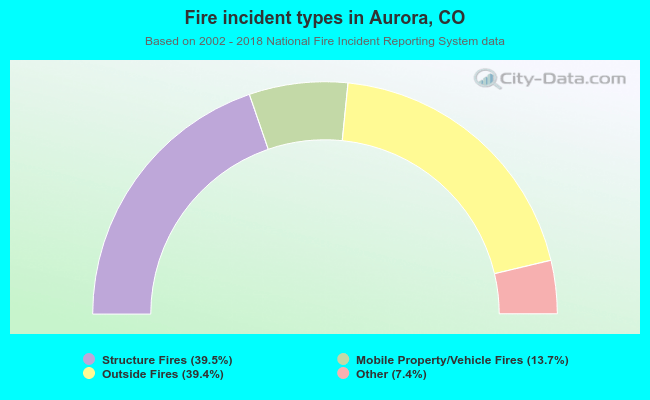 When looking into fire subcategories, the most reports belonged to: Structure Fires (39.5%), and Outside Fires (39.4%).
Fire-safe hotels and motels in Aurora, Colorado:
- Travelodge, 14200 E 6TH Ave, Aurora, Colorado 80011 , Phone: (303) 366-7333, Fax: (303) 344-1536
- DoubleTree Hotel Aurora, 13696 E Iliff Pl, Aurora, Colorado 80014 , Phone: (303) 337-2800, Fax: (303) 752-0296
- Radisson Hotel Denver - Aurora, 3155 S Vaughn Way, Aurora, Colorado 80014 , Phone: (720) 857-9000
- Extended Stay America - Denver - Aurora South, 13941 E Harvard Ave, Aurora, Colorado 80014 , Phone: (303) 750-9116, Fax: (303) 750-5013
- Comfort Inn Denver Intl Airport, 16921 E 32nd Ave, Aurora, Colorado 80011 , Phone: (303) 367-5000, Fax: (303) 367-5300
- Hyatt Place Denver Airport, 16250 E 40th Ave, Aurora, Colorado 80011 , Phone: (303) 371-0700, Fax: (303) 371-2223
- In Town Suites Denver East, 2221 S Havana St, Aurora, Colorado 80012 , Phone: (303) 283-8421, Fax: (303) 306-1697
- Comfort Inn Denver Southeast, 14071 E Iliff Ave, Aurora, Colorado 80014 , Phone: (303) 755-8000, Fax: (303) 755-4041
- 21 other hotels and motels
| Most common first names in Aurora, CO among deceased individuals | ||
| Name | Count | Lived (average) |
|---|---|---|
| Robert | 635 | 70.6 years |
| John | 632 | 71.0 years |
| Mary | 608 | 78.1 years |
| William | 571 | 72.9 years |
| James | 503 | 70.5 years |
| Charles | 358 | 71.5 years |
| Helen | 335 | 80.3 years |
| Dorothy | 290 | 77.7 years |
| George | 284 | 75.4 years |
| Richard | 268 | 66.3 years |
| Most common last names in Aurora, CO among deceased individuals | ||
| Last name | Count | Lived (average) |
|---|---|---|
| Smith | 263 | 74.3 years |
| Johnson | 243 | 72.0 years |
| Miller | 179 | 75.0 years |
| Brown | 174 | 73.4 years |
| Jones | 158 | 70.3 years |
| Williams | 134 | 71.6 years |
| Anderson | 131 | 74.3 years |
| Davis | 124 | 73.4 years |
| Wilson | 96 | 76.7 years |
| Martin | 90 | 72.0 years |
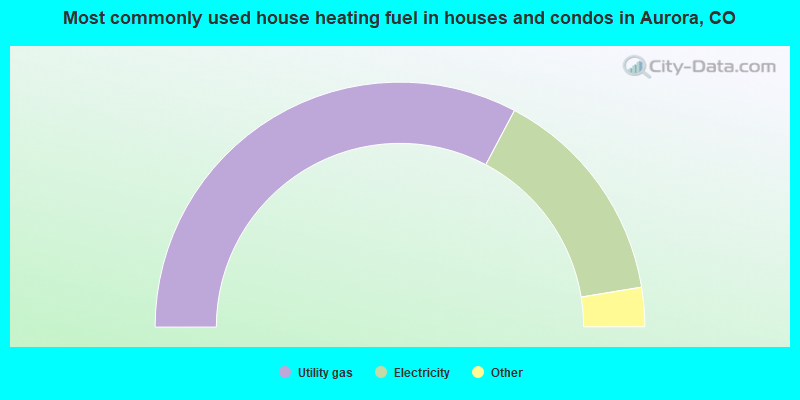
- 65.5%Utility gas
- 29.3%Electricity
- 1.6%Bottled, tank, or LP gas
- 1.5%Solar energy
- 1.1%Other fuel
- 0.6%Wood
- 0.3%No fuel used
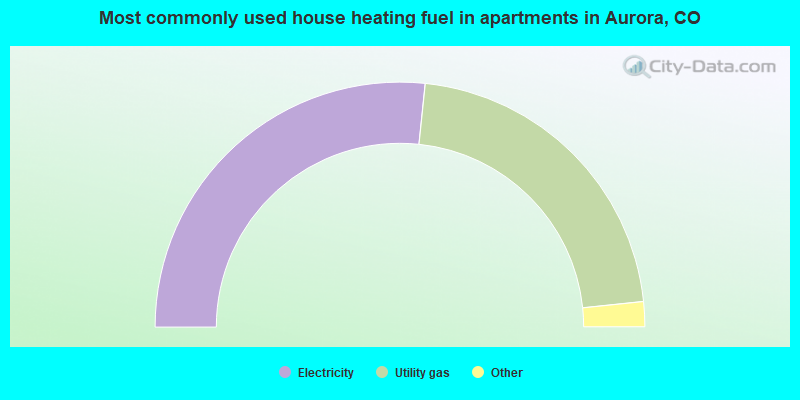
- 53.3%Electricity
- 43.4%Utility gas
- 1.9%Bottled, tank, or LP gas
- 0.6%Other fuel
- 0.4%No fuel used
- 0.3%Wood
Aurora compared to Colorado state average:
- Unemployed percentage significantly below state average.
- Black race population percentage significantly above state average.
- Hispanic race population percentage above state average.
- Median age below state average.
- Foreign-born population percentage significantly above state average.
Aurora, CO compared to other similar cities:
Aurora on our top lists:
- #10 on the list of "Top 100 highest located cities (pop. 50,000+)"
- #15 on the list of "Top 101 cities with the smallest sunshine amount differences during a year (population 50,000+)"
- #32 on the list of "Top 101 cities with the most residents born in Born at sea (population 500+)"
- #34 on the list of "Top 101 cities with largest percentage of females in industries: administrative and support and waste management services (population 50,000+)"
- #43 on the list of "Top 101 cities with largest percentage of males in industries: transportation and warehousing (population 50,000+)"
- #45 on the list of "Top 101 cities with largest percentage of males in occupations: transportation occupations (population 50,000+)"
- #46 on the list of "Top 101 cities with the lowest average humidity (population 50,000+)"
- #47 on the list of "Top 101 cities with the largest differences between daily high and daily low temperatures (population 50,000+)"
- #49 on the list of "Top 101 cities with largest percentage of males in industries: management of companies and enterprises (population 50,000+)"
- #51 on the list of "Top 101 cities with the lowest maximum monthly morning or afternoon humidity (population 50,000+)"
- #51 on the list of "Top 101 cities with largest percentage of females in industries: mining, quarrying, and oil and gas extraction (population 50,000+)"
- #56 on the list of "Top 101 cities with largest percentage of males in industries: administrative and support and waste management services (population 50,000+)"
- #59 on the list of "Top 101 cities with the largest city-data.com crime index decrease from 2002 to 2012 (population 50,000+)"
- #65 on the list of "Top 101 cities with largest percentage of females in industries: transportation and warehousing (population 50,000+)"
- #67 on the list of "Top 101 cities with the most residents born in Other Eastern Asia (population 500+)"
- #67 on the list of "Top 100 biggest cities"
- #68 on the list of "Top 101 biggest cities in 2013"
- #71 on the list of "Top 100 most racially diverse cities (pop. 50,000+)"
- #75 on the list of "Top 101 cities with largest percentage of females in occupations: construction and extraction occupations (population 50,000+)"
- #78 on the list of "Top 101 larger cities with the largest decrease or smallest increase in household income from 2000 (population 50,000+)"
- #18 (80112) on the list of "Top 101 zip codes with the most finance and insurance companies in 2005"
- #19 (80112) on the list of "Top 101 zip codes with the most medium-big companies in 2005 (at least 100 employees)"
- #3 on the list of "Top 101 counties with the highest Nitrogen Dioxide air pollution readings in 2012 (ppm)"
- #24 on the list of "Top 101 counties with the highest carbon monoxide air pollution readings in 2012 (ppm)"
- #32 on the list of "Top 101 counties with the lowest percentage of residents that visited a dentist within the past year"
- #59 on the list of "Top 101 counties with the lowest percentage of residents relocating from foreign countries between 2010 and 2011 (pop. 50,000+)"
- #59 on the list of "Top 101 counties with the largest decrease in the number of infant deaths per 1000 residents 2000-2006 to 2007-2013 (pop. 50,000+)"

|
|
Total of 1325 patent applications in 2008-2024.