Estimated zip code population in 2022: 74,754 Zip code population in 2010: 69,588 Zip code population in 2000: 57,255
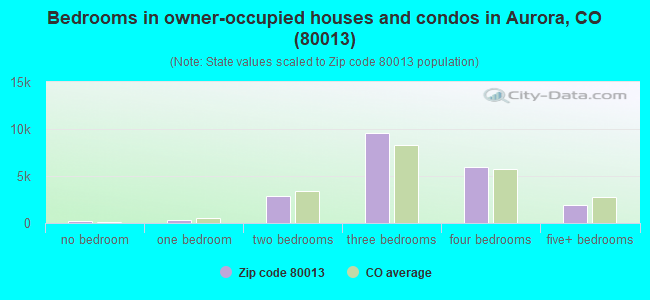
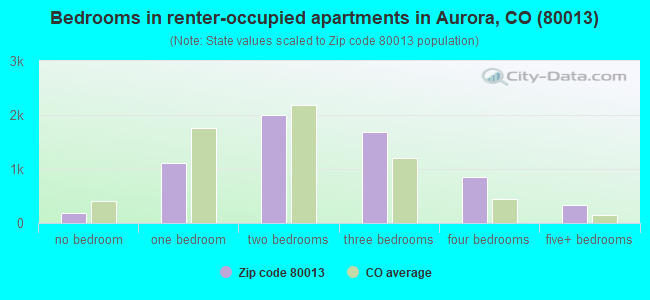
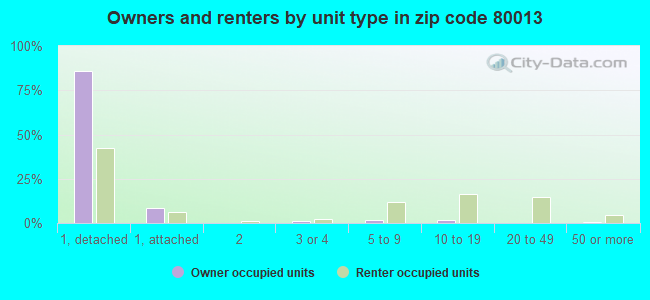
Houses and condos: 27,550 Renter-occupied apartments: 6,132
% of renters here:
23%
State:
34%
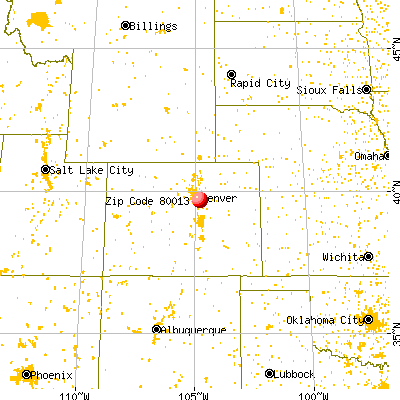
March 2022 cost of living index in zip code 80013: 102.5 (near average, U.S. average is 100)
Land area: 14.0 sq. mi. Water area: 0.0 sq. mi.
Population density: 5,344 people per square mile
(average).
OSM Map
General Map
Google Map
MSN Map
OSM Map
General Map
Google Map
MSN Map
OSM Map
General Map
Google Map
MSN Map
OSM Map
General Map
Google Map
MSN Map
Please wait while loading the map...
Real estate property taxes paid for housing units in 2022:
This zip code:
0.5% ($2,221)
Colorado:
0.5% ($2,422)
Median real estate property taxes paid for housing units with mortgages in 2022: $2,224 (0.5%) Median real estate property taxes paid for housing units with no mortgage in 2022: $2,223 (0.5%)
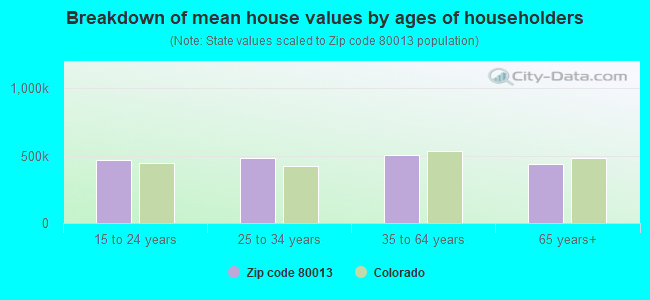
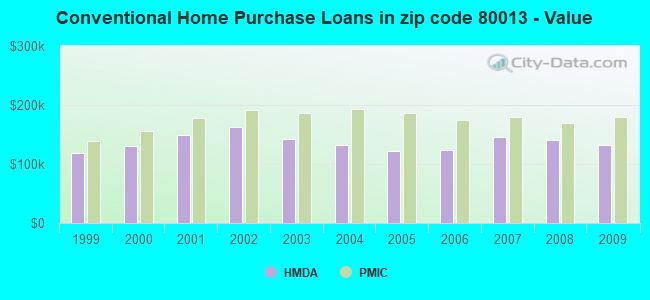
Estimated median house/condo value in 2022: $481,740
80013:
$481,740
Colorado:
$531,100
According to our research of Colorado and other state lists, there were 145 registered sex offenders living in 80013 zip code as of April 27, 2024. The ratio of all residents to sex offenders in zip code 80013 is 505 to 1. The ratio of registered sex offenders to all residents in this zip code is near the state average.
Median resident age:
This zip code:
36.9 years
Colorado median age:
37.7 years
Average household size:
This zip code:
2.8 people
Colorado:
2.4 people
Averages for the 2020 tax year for zip code 80013, filed in 2021:
Average Adjusted Gross Income (AGI) in 2020: $59,827 (Individual Income Tax Returns)
Here:
$59,827
State:
$89,260
Salary/wage: $55,175 (reported on 86.3% of returns)
Here:
$55,175
State:
$70,330
(% of AGI for various income ranges: 1196.2% for AGIs below $25k, 3818.4% for AGIs $25k-50k, 6941.7% for AGIs $50k-75k, 10396.7% for AGIs $75k-100k, 18905.5% for AGIs $100k-200k, 53703.5% for AGIs over 200k)
Taxable interest for individuals: $750 (reported on 21.5% of returns)
This zip code:
$750
Colorado:
$2,176
(% of AGI for various income ranges: 7.4% for AGIs below $25k, 8.6% for AGIs $25k-50k, 19.9% for AGIs $50k-75k, 28.9% for AGIs $75k-100k, 49.6% for AGIs $100k-200k, 528.8% for AGIs over 200k)
Ordinary dividends: $2,430 (reported on 12.5% of returns)
Here:
$2,430
State:
$8,820
(% of AGI for various income ranges: 10.8% for AGIs below $25k, 14.9% for AGIs $25k-50k, 32.8% for AGIs $50k-75k, 51.2% for AGIs $75k-100k, 112.3% for AGIs $100k-200k, 1018.5% for AGIs over 200k)
Net capital gain/loss in AGI: +$7,703 (reported on 11.6% of returns)
Here:
+$7,703
State:
+$37,276
(% of AGI for various income ranges: 6.6% for AGIs below $25k, 12.7% for AGIs $25k-50k, 42.3% for AGIs $50k-75k, 88.0% for AGIs $75k-100k, 316.9% for AGIs $100k-200k, 6574.6% for AGIs over 200k)
Profit/loss from business: +$9,409 (reported on 17.5% of returns)
Here:
+$9,409
State:
+$15,295
(% of AGI for various income ranges: 155.9% for AGIs below $25k, 174.4% for AGIs $25k-50k, 247.1% for AGIs $50k-75k, 316.9% for AGIs $75k-100k, 331.2% for AGIs $100k-200k, 1605.0% for AGIs over 200k)
Taxable individual retirement arrangement distribution: $16,484 (reported on 5.8% of returns)
80013:
$16,484
Colorado:
$23,785
(% of AGI for various income ranges: 36.5% for AGIs below $25k, 53.1% for AGIs $25k-50k, 126.6% for AGIs $50k-75k, 188.0% for AGIs $75k-100k, 399.5% for AGIs $100k-200k, 1529.2% for AGIs over 200k)
Self-employed (Keogh) retirement plans: $11,583 (reported on 0.2% of returns)
80013:
$11,583
Colorado:
$23,633
(% of AGI for various income ranges: 2.3% for AGIs $25k-50k, 15.6% for AGIs $100k-200k)
Total itemized deductions: $24,496 (reported on 10.1% of returns)
Here:
$24,496
State:
$35,141
(% of AGI for various income ranges: 43.3% for AGIs below $25k, 141.6% for AGIs $25k-50k, 398.7% for AGIs $50k-75k, 625.6% for AGIs $75k-100k, 963.5% for AGIs $100k-200k, 3535.0% for AGIs over 200k)
Charity contributions: $5,503 (reported on 6.8% of returns)
Here:
$5,503
State:
$12,103
(% of AGI for various income ranges: 3.3% for AGIs below $25k, 14.9% for AGIs $25k-50k, 45.9% for AGIs $50k-75k, 68.7% for AGIs $75k-100k, 175.6% for AGIs $100k-200k, 1038.1% for AGIs over 200k)
Taxes paid: $6,414 (reported on 10.1% of returns)
80013:
$6,414
State:
$7,710
(% of AGI for various income ranges: 6.0% for AGIs below $25k, 27.2% for AGIs $25k-50k, 96.9% for AGIs $50k-75k, 170.4% for AGIs $75k-100k, 295.1% for AGIs $100k-200k, 907.7% for AGIs over 200k)
Earned income credit: $2,155 (reported on 13.8% of returns)
Here:
$2,155
State:
$2,053
(% of AGI for various income ranges: 85.4% for AGIs below $25k, 58.7% for AGIs $25k-50k, 1.0% for AGIs $50k-75k)
Percentage of individuals using paid preparers for their 2020 taxes: 92.5%
Here:
92%
State:
93%
(% for various income ranges: 90.7% for AGIs below $25k, 93.0% for AGIs $25k-50k, 93.0% for AGIs $50k-75k, 92.8% for AGIs $75k-100k, 93.6% for AGIs $100k-200k, 93.2% for AGIs over 200k)
Averages for the 2012 tax year for zip code 80013, filed in 2013:
Average Adjusted Gross Income (AGI) in 2012: $51,794 (Individual Income Tax Returns)
Here:
$51,794
State:
$69,103
Salary/wage: $48,261 (reported on 90.1% of returns)
Here:
$48,261
State:
$54,794
(% of AGI for various income ranges: 80.0% for AGIs below $25k, 87.0% for AGIs $25k-50k, 85.5% for AGIs $50k-75k, 84.4% for AGIs $75k-100k, 85.4% for AGIs $100k-200k, 62.1% for AGIs over 200k)
Taxable interest for individuals: $548 (reported on 24.6% of returns)
This zip code:
$548
Colorado:
$1,971
(% of AGI for various income ranges: 0.4% for AGIs below $25k, 0.3% for AGIs $25k-50k, 0.2% for AGIs $50k-75k, 0.2% for AGIs $75k-100k, 0.2% for AGIs $100k-200k, 0.4% for AGIs over 200k)
Ordinary dividends: $1,670 (reported on 13.2% of returns)
Here:
$1,670
State:
$7,140
(% of AGI for various income ranges: 0.7% for AGIs below $25k, 0.3% for AGIs $25k-50k, 0.4% for AGIs $50k-75k, 0.3% for AGIs $75k-100k, 0.4% for AGIs $100k-200k, 1.1% for AGIs over 200k)
Net capital gain/loss in AGI: +$3,406 (reported on 10.1% of returns)
Here:
+$3,406
State:
+$23,009
(% of AGI for various income ranges: 0.3% for AGIs $50k-75k, 0.4% for AGIs $75k-100k, 0.5% for AGIs $100k-200k, 7.6% for AGIs over 200k)
Profit/loss from business: +$8,524 (reported on 14.7% of returns)
Here:
+$8,524
State:
+$13,514
(% of AGI for various income ranges: 8.5% for AGIs below $25k, 2.9% for AGIs $25k-50k, 1.9% for AGIs $50k-75k, 1.6% for AGIs $75k-100k, 1.3% for AGIs $100k-200k, 2.3% for AGIs over 200k)
Taxable individual retirement arrangement distribution: $12,713 (reported on 6.5% of returns)
80013:
$12,713
Colorado:
$17,927
(% of AGI for various income ranges: 1.7% for AGIs below $25k, 1.2% for AGIs $25k-50k, 1.5% for AGIs $50k-75k, 1.8% for AGIs $75k-100k, 1.7% for AGIs $100k-200k, 2.0% for AGIs over 200k)
Self-employment retirement plans: $9,114 (reported on 0.2% of returns)
80013:
$9,114
Colorado:
$19,483
Total itemized deductions: $18,171 (22% of AGI, reported on 38.1% of returns)
Here:
$18,171
State:
$24,621
Here:
22.5% of AGI
State:
18.5% of AGI
(% of AGI for various income ranges: 9.0% for AGIs below $25k, 10.9% for AGIs $25k-50k, 14.1% for AGIs $50k-75k, 14.5% for AGIs $75k-100k, 14.5% for AGIs $100k-200k, 16.0% for AGIs over 200k)
Charity contributions: $2,582 (reported on 30.2% of returns)
Here:
$2,582
State:
$4,449
(% of AGI for various income ranges: 0.7% for AGIs below $25k, 1.0% for AGIs $25k-50k, 1.4% for AGIs $50k-75k, 1.7% for AGIs $75k-100k, 2.0% for AGIs $100k-200k, 1.9% for AGIs over 200k)
Taxes paid: $4,742 (reported on 38.0% of returns)
80013:
$4,742
State:
$7,641
(% of AGI for various income ranges: 1.3% for AGIs below $25k, 2.2% for AGIs $25k-50k, 3.3% for AGIs $50k-75k, 3.9% for AGIs $75k-100k, 4.7% for AGIs $100k-200k, 4.3% for AGIs over 200k)
Earned income credit: $2,137 (reported on 16.6% of returns)
Here:
$2,137
State:
$2,095
(% of AGI for various income ranges: 6.0% for AGIs below $25k, 1.1% for AGIs $25k-50k)
Percentage of individuals using paid preparers for their 2012 taxes: 43.8%
Here:
44%
State:
49%
(% for various income ranges: 42.6% for AGIs below $25k, 43.9% for AGIs $25k-50k, 44.3% for AGIs $50k-75k, 45.0% for AGIs $75k-100k, 43.9% for AGIs $100k-200k, 62.1% for AGIs over 200k)
Averages for the 2004 tax year for zip code 80013, filed in 2005:
Average Adjusted Gross Income (AGI) in 2004: $46,524 (Individual Income Tax Returns)
Here:
$46,524
State:
$55,014
Salary/wage: $44,950 (reported on 92.4% of returns)
Here:
$44,950
State:
$46,010
(% of AGI for various income ranges: 128.2% for AGIs below $10k, 84.8% for AGIs $10k-25k, 90.7% for AGIs $25k-50k, 89.7% for AGIs $50k-75k, 90.9% for AGIs $75k-100k, 85.1% for AGIs over 100k)
Taxable interest for individuals: $576 (reported on 37.9% of returns)
This zip code:
$576
Colorado:
$2,127
(% of AGI for various income ranges: 2.8% for AGIs below $10k, 0.7% for AGIs $10k-25k, 0.4% for AGIs $25k-50k, 0.4% for AGIs $50k-75k, 0.4% for AGIs $75k-100k, 0.4% for AGIs over 100k)
Taxable dividends: $988 (reported on 17.3% of returns)
Here:
$988
State:
$3,782
(% of AGI for various income ranges: 2.1% for AGIs below $10k, 0.6% for AGIs $10k-25k, 0.3% for AGIs $25k-50k, 0.3% for AGIs $50k-75k, 0.3% for AGIs $75k-100k, 0.5% for AGIs over 100k)
Net capital gain/loss: +$2,132 (reported on 14.0% of returns)
Here:
+$2,132
State:
+$17,882
(% of AGI for various income ranges: -1.3% for AGIs below $10k, 0.1% for AGIs $10k-25k, 0.1% for AGIs $25k-50k, 0.2% for AGIs $50k-75k, 0.4% for AGIs $75k-100k, 2.3% for AGIs over 100k)
Profit/loss from business: +$6,575 (reported on 15.2% of returns)
Here:
+$6,575
State:
+$11,247
(% of AGI for various income ranges: 7.9% for AGIs below $10k, 6.3% for AGIs $10k-25k, 2.6% for AGIs $25k-50k, 2.1% for AGIs $50k-75k, 1.2% for AGIs $75k-100k, 1.1% for AGIs over 100k)
Profit/loss from farming: +$355 (reported on 0.1% of returns)
Here:
+$355
State:
-$7,127
(% of AGI for various income ranges: -0.2% for AGIs below $10k, 0.0% for AGIs $50k-75k, 0.0% for AGIs $75k-100k)
IRA payment deduction: $2,639 (reported on 2.4% of returns)
80013:
$2,639
Colorado:
$2,947
(% of AGI for various income ranges: 0.3% for AGIs below $10k, 0.1% for AGIs $10k-25k, 0.2% for AGIs $25k-50k, 0.1% for AGIs $50k-75k, 0.1% for AGIs $75k-100k, 0.1% for AGIs over 100k)
Self-employed pension: $6,475 (reported on 0.4% of returns)
Here:
$6,475
Colorado:
$13,653
(% of AGI for various income ranges: 0.3% for AGIs below $10k, 0.0% for AGIs $25k-50k, 0.1% for AGIs $50k-75k, 0.0% for AGIs $75k-100k, 0.1% for AGIs over 100k)
Total itemized deductions: $16,602 (25% of AGI, reported on 51.3% of returns)
Here:
$16,602
State:
$20,560
Here:
25.0% of AGI
State:
21.4% of AGI
(% of AGI for various income ranges: 21.2% for AGIs below $10k, 13.3% for AGIs $10k-25k, 18.9% for AGIs $25k-50k, 20.4% for AGIs $50k-75k, 18.8% for AGIs $75k-100k, 16.2% for AGIs over 100k)
Charity contributions deductions: $2,153 (3% of AGI, reported on 44.0% of returns)
Here:
$2,153
State:
$3,518
Here:
3.1% of AGI
State:
3.4% of AGI
(% of AGI for various income ranges: 1.0% for AGIs below $10k, 1.2% for AGIs $10k-25k, 1.8% for AGIs $25k-50k, 2.2% for AGIs $50k-75k, 2.2% for AGIs $75k-100k, 2.3% for AGIs over 100k)
Total tax: $5,429 (reported on 79.5% of returns)
80013:
$5,429
State:
$9,173
(% of AGI for various income ranges: 3.6% for AGIs below $10k, 4.4% for AGIs $10k-25k, 6.5% for AGIs $25k-50k, 8.2% for AGIs $50k-75k, 9.8% for AGIs $75k-100k, 14.6% for AGIs over 100k)
Earned income credit: $1,667 (reported on 11.7% of returns)
Here:
$1,667
State:
$1,595
Percentage of individuals using paid preparers for their 2004 taxes: 49.6%
Here:
50%
State:
55%
(% for various income ranges: 42.2% for AGIs below $10k, 53.0% for AGIs $10k-25k, 51.0% for AGIs $25k-50k, 51.8% for AGIs $50k-75k, 48.3% for AGIs $75k-100k, 46.9% for AGIs over 100k)
Likely homosexual households (counted as self-reported same-sex unmarried-partner households)
Lesbian couples: 0.1% of all households
Gay men: 0.1% of all households
Household received Food Stamps/SNAP in the past 12 months: 2,348 Household did not receive Food Stamps/SNAP in the past 12 months: 24,551
Women who had a birth in the past 12 months: 895 (672 now married, 216 unmarried) Women who did not have a birth in the past 12 months: 18,536 (8,311 now married, 10,223 unmarried)
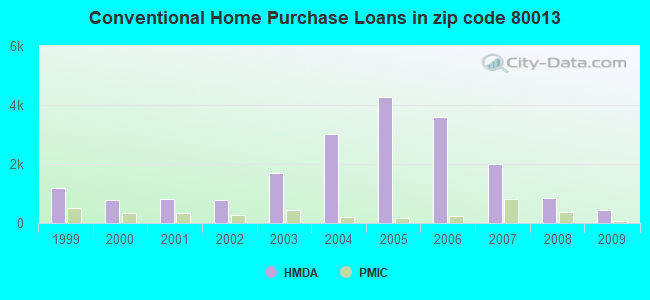
Housing units in zip code 80013 with a mortgage: 16,393 (1,874 second mortgage, 45 home equity loan, 1,398 both second mortgage and home equity loan) Houses without a mortgage: 272
Median monthly owner costs for units with a mortgage: $1,971 Median monthly owner costs for units without a mortgage: $580
Residents with income below the poverty level in 2022:
This zip code:
9.6%
Whole state:
9.4%
Residents with income below 50% of the poverty level in 2022:
This zip code:
5.7%
Whole state:
4.6%
Median number of rooms in houses and condos:
Here:
6.7
State:
6.8
Median number of rooms in apartments:
Here:
4.7
State:
4.0
Notable locations in this zip code not listed on our city pages
Notable locations in zip code 80013: South Branch Aurora Public Library (A), Aurora Fire Department Station 6 (B), Aurora Fire Department Station 10 (C). Display/hide their locations on the map
Churches in zip code 80013 include: Trinity Baptist Church (A), Peace With Christ Christian Center (B), New Hope Community Church (C), Kingdom Hall Jehovah's Witnesses (D), Church of Jesus Christ of Latter Day Saints (E), Christ Our Redeemer Evangelical Lutheran Church (F), New Life Evangelical Free Church (G), Redeemed Chrsitian Church of God (H), All Saints Lutheran Church (I). Display/hide their locations on the map
Parks in zip code 80013 include: Great Plains Park (1), Hampden Run Park (2), Flanders Park (3), Seven Hills Park (4), Pagosa Park (5), Eldorado Park (6), Meadowood Park (7), Hill Top Park (8), La Parquita Park (9). Display/hide their locations on the map
Tourist attraction (not listed on the city page) : Cuesplus (Arcades & Amusements; 18121 East Hampden Avenue Unit C).
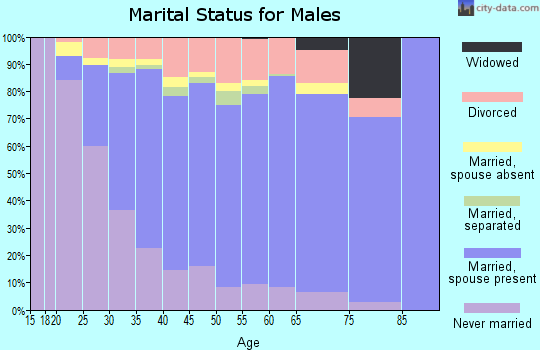
10,303 married couples with children.
5,224 single-parent households (1,752 men, 3,472 women).
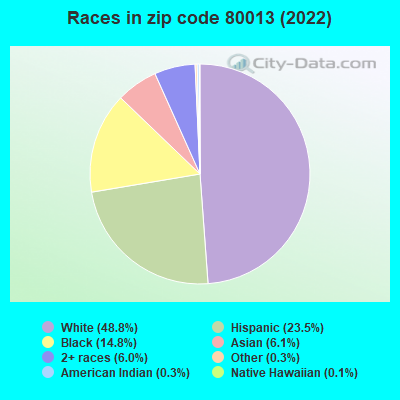
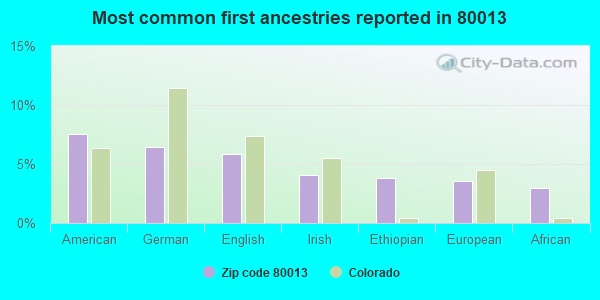
73.6% of residents of 80013 zip code speak English at home.
13.8% of residents speak Spanish at home (66% very well, 22% well, 10% not well, 3% not at all).
3.9% of residents speak other Indo-European language at home (72% very well, 22% well, 5% not well).
4.0% of residents speak Asian or Pacific Island language at home (51% very well, 22% well, 22% not well, 6% not at all).
4.0% of residents speak other language at home (63% very well, 31% well, 4% not well, 3% not at all).
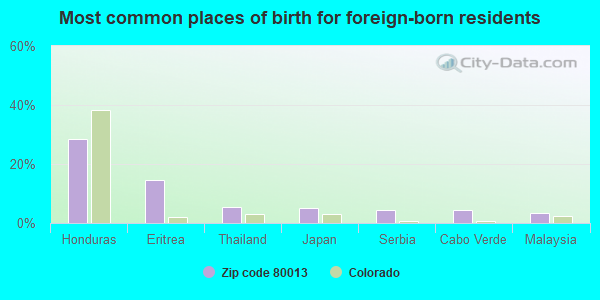
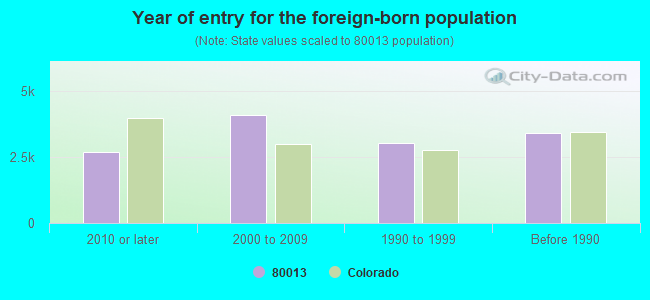
Foreign born population: 12,057 (16.1%) (63.4% of them are naturalized citizens)
Major facilities with environmental interests located in this zip code:
CENTURY ELEMENTARY SCHOOL (2500 S GRANBY WY in AURORA, CO)
(National Center for Education Statistics) - STATE ID-1470 Conditionally Exempt Small Quantity Generators, less than 100 kg/month of hazardous waste (Resource Conservation and Recovery Act (tracking hazardous waste)) - notification Organizations: AURORA PUBLIC SCHOOLS (CONTACT/OWNER)
, ADAMS-ARAPAHOE 28J (SCHOOL DISTRICT)
DALTON ELEMENTARY SCHOOL (17401 E DARTMOUTH AVE in AURORA, CO)
(National Center for Education Statistics) - STATE ID-2095 Conditionally Exempt Small Quantity Generators, less than 100 kg/month of hazardous waste (Resource Conservation and Recovery Act (tracking hazardous waste)) - notification Organizations: AURORA PUBLIC SCHOOLS (CONTACT/OWNER)
, ADAMS-ARAPAHOE 28J (SCHOOL DISTRICT)
DARTMOUTH ELEMENTARY SCHOOL (3050 S LAREDO ST in AURORA, CO)
(National Center for Education Statistics) - STATE ID-2114 Conditionally Exempt Small Quantity Generators, less than 100 kg/month of hazardous waste (Resource Conservation and Recovery Act (tracking hazardous waste)) - notification Organizations: AURORA PUBLIC SCHOOLS (CONTACT/OWNER)
, ADAMS-ARAPAHOE 28J (SCHOOL DISTRICT)
AMOCO GAS STA NO 2151 (16701 EAST ILIFF AVENUE in AURORA, CO)
AIR MINOR (AIRS/AFS) CRITERIA AND HAZARDOUS AIR POLLUTANT INVENTORY (Inventory of air pollution sources) (Resource Conservation and Recovery Act (tracking hazardous waste)) Business SIC classification: GASOLINE SERVICE STATIONS Organizations: AMOCO OIL CO (CONTACT/OWNER)
Alternative names: AMOCO RETAIL BUSINESS UNIT 829, BP AMOCO OIL
ARROWHEAD ELEMENTARY SCHOOL (19100 EAST BATES AVENUE in AURORA, CO)
(National Center for Education Statistics) - STATE ID-0348 Organizations: CHERRY CREEK 5 (SCHOOL DISTRICT)
DAKOTA VALLEY ELEMENTARY SCHOOL (3950 SOUTH KIRK WAY in AURORA, CO)
(National Center for Education Statistics) - STATE ID-2094 Organizations: CHERRY CREEK 5 (SCHOOL DISTRICT)
G CLNRS (2250 S CHAMBERS RD in AURORA, CO)
AIR MINOR (AIRS/AFS) ENFORCEMENT/COMPLIANCE ACTIVITY (Integrated Compliance Information System) CRITERIA AND HAZARDOUS AIR POLLUTANT INVENTORY (Inventory of air pollution sources) Conditionally Exempt Small Quantity Generators, less than 100 kg/month of hazardous waste (Resource Conservation and Recovery Act (tracking hazardous waste)) - notification Business SIC classification: DRYCLEANING PLANTS, EXCEPT RUG CLEANING Business NAICS classification: DRYCLEANING AND LAUNDRY SERVICES (EXCEPT COIN-OPERATED). Organizations: YOUR CLEANERS INC (CONTACT/OPERATOR)
, JOHN PARK (CONTACT/OWNER)
Alternative names: GEM CLEANERS
HORIZON MIDDLE SCHOOL (3981 SOUTH RESERVOIR ROAD in AURORA, CO)
(National Center for Education Statistics) - STATE ID-4100 Organizations: CHERRY CREEK 5 (SCHOOL DISTRICT)
BUCKLEY VALET CLEANING (17200 EAST ILIFF in AURORA, CO)
AIR MINOR (AIRS/AFS) CRITERIA AND HAZARDOUS AIR POLLUTANT INVENTORY (Inventory of air pollution sources) Conditionally Exempt Small Quantity Generators, less than 100 kg/month of hazardous waste (Resource Conservation and Recovery Act (tracking hazardous waste)) - notification Business SIC classification: DRYCLEANING PLANTS, EXCEPT RUG CLEANING Business NAICS classification: DRYCLEANING AND LAUNDRY SERVICES (EXCEPT COIN-OPERATED). Organizations: SUN HOY (CONTACT/OWNER)
Alternative names: BUCKLEY VALET CLENAERS
ALPINE STATION #8 (15351 E ILIFF AVE in AURORA, CO)
AIR MINOR (AIRS/AFS) CRITERIA AND HAZARDOUS AIR POLLUTANT INVENTORY (Inventory of air pollution sources) Business SIC classification: GASOLINE SERVICE STATIONS Alternative names: CONOCO INCORPORATED NUMBER 06312, CONOCO INC NO 6313
BOYD RESIDENCE (3572 S VENTURA WY in AURORA, CO)
(Resource Conservation and Recovery Act (tracking hazardous waste)) Organizations: DATA NOT REQUESTED (CONTACT/OWNER)
K&G PETROLEUM, LLC (18181 E HAMPDEN AVE in AURORA, CO)
AIR MINOR (AIRS/AFS) CRITERIA AND HAZARDOUS AIR POLLUTANT INVENTORY (Inventory of air pollution sources) Business SIC classification: GASOLINE SERVICE STATIONS Alternative names: AMOCO OIL COMPANY NUMBER 13505, BP # 13505
BANGERT BROS CONSTRUCTION CO (16093 E HAMILTON PL in DENVER, CO)
AIR MINOR (AIRS/AFS) Business SIC classification: HIGHWAY AND STREET CONSTRUCTION, EXCEPT ELEVATED HIGHWAYS
Housing units lacking complete plumbing facilities: 0.2% Housing units lacking complete kitchen facilities: 0.5%
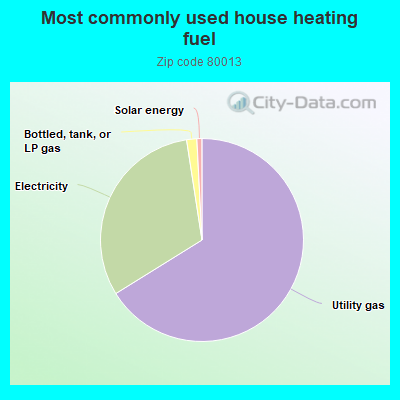
65.5%Utility gas
31.1%Electricity
1.6%Bottled, tank, or LP gas
0.8%Solar energy
Population in 1990: 45,335. Population change in the 1990s: +11,920 (+26.3%).
Place of birth for U.S.-born residents:
This state: 32,452
Northeast: 3,380
Midwest: 9,056
South: 7,513
West: 8,880
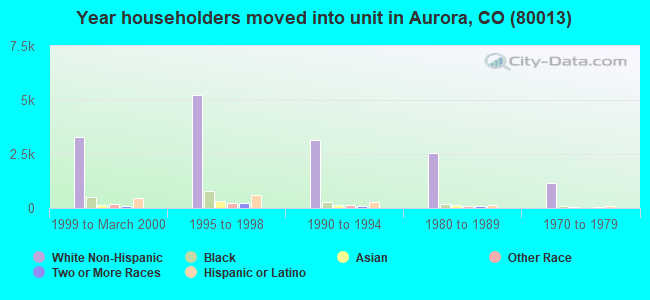
47% of the 80013 zip code residents lived in the same house 5 years ago. Out of people who lived in different houses, 45% lived in this county. Out of people who lived in different counties, 50% lived in Colorado.
89% of the 80013 zip code residents lived in the same house 1 year ago. Out of people who lived in different houses, 52% moved from this county. Out of people who lived in different houses, 30% moved from different county within same state. Out of people who lived in different houses, 17% moved from different state. Out of people who lived in different houses, 2% moved from abroad.
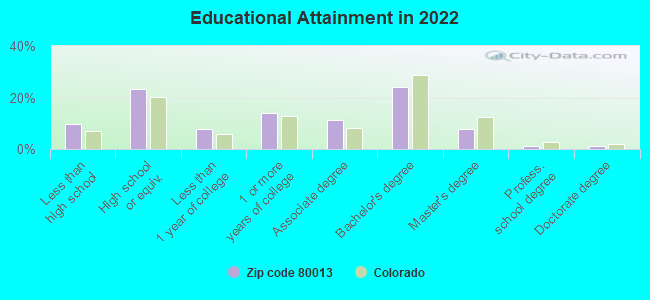
Private vs. public school enrollment:
Students in private schools in grades 1 to 8 (elementary and middle school): 732
Here:
9.4%
Colorado:
11.4%
Students in private schools in grades 9 to 12 (high school): 203
Here:
4.8%
Colorado:
8.5%
Students in private undergraduate colleges: 790
Here:
21.6%
Colorado:
14.0%
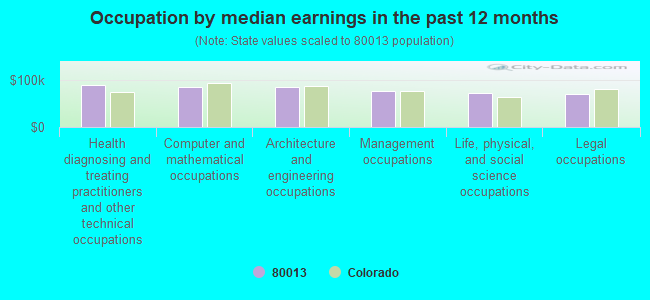
Occupation by median earnings in the past 12 months ($)
89,768Health diagnosing and treating practitioners and other technical occupations
86,564Computer and mathematical occupations
85,658Architecture and engineering occupations
76,045Management occupations
71,787Life, physical, and social science occupations
71,056Legal occupations
Companies with federal contracts located in this zip code (AURORA, CO):
IEM INC (3102 S HANNIBAL ST; small business) : $2,549,463 in 56 contractsfrom 2000 to 2003
Contracts for Maintenance, Repair or Alteration of Real Property -- Miscellaneous Buildings, Maintenance, Repair or Alteration of Real Property -- Other Non-Building Facilities, Maintenance, Repair or Alteration of Real Property -- Dams, Maintenance, Repair or Alteration of Real Property -- Other Utilities, and moreby Army Signed by year:2000: $1,020,706; 2001: $670,931; 2002: $794,136; 2003: $63,690; 2004: $0; 2005: $0; 2006: $0.
Biggest contracts:
$209,558 with Army for Maintenance, Repair or Alteration of Real Property -- Miscellaneous Buildings. Signed on 2002-09-23. Completion date: 2003-05-30.
$193,366 with Army for Maintenance, Repair or Alteration of Real Property -- Other Non-Building Facilities. Signed on 2000-09-29. Completion date: 2001-09-30.
$172,967 with Army for Maintenance, Repair or Alteration of Real Property -- Miscellaneous Buildings. Signed on 2001-09-24. Completion date: 2002-04-30.
$165,000, same as above.Signed on 2002-09-25. Completion date: 2002-12-31.
CLOCK TOWER PARTNERS (18511 E HAMDEN UNIT 210) : $199,216 in 13 contractsfrom 2001 to 2003
Contracts for Lease or Rental of Facilities -- Office Buildings by Public Buildings Service Signed by year:2000: $0; 2001: $52,000; 2002: $78,000; 2003: $69,216; 2004: $0; 2005: $0; 2006: $0.
Biggest contracts:
$26,000 with Public Buildings Service for Lease or Rental of Facilities -- Office Buildings. Signed on 2002-09-15. Completion date: 2002-09-15.
$26,000, same as above.Signed on 2002-06-15. Completion date: 2002-06-15.
$26,000, same as above.Signed on 2002-03-15. Completion date: 2002-03-15.
$26,000, same as above.Signed on 2001-12-15. Completion date: 2001-12-15.
PLAYSCAPES BY DESIGN, LLC (3794 S PITKIN CIRCLE; small business)
$115,065 with Air Force for Installation of Equipment -- Recreational and Athletic Equipment. Signed on 2003-09-11. Completion date: 2003-11-10.
CERTIFIED NETWORK GROUP, INC (2984 S IDALIA ST; small business)
$3,327 with Air Force for ADP Software. Signed on 2005-09-30. Completion date: 2005-10-13.
EVELYN SMITH (2111 S IDALIA ST; small business) : $0 in 2 contractsin 2003
$166,430 with Air Force for Warehouse Trucks and Tractors, Self-Propelled. Signed on 2003-10-21. Completion date: 2004-03-30.
-$166,430, same as above.Signed on 2003-12-05. Completion date: 2003-12-05.
Top industries in this zip code by the number of employees in 2005:
2002 - 2018 National Fire Incident Reporting System (NFIRS) incidents
Based on the data from the years 2002 - 2018 the average number of fires per year is 68. The highest number of reported fires - 124 took place in 2017, and the least - 7 in 2002. The data has a growing trend.
When looking into fire subcategories, the most reports belonged to: Structure Fires (41.2%), and Outside Fires (38.1%).
Fire incident types reported to NFIRS in Zip Code 80013


+$355
-$7,127
(% of AGI for various income ranges: -0.2% for AGIs below $10k, 0.0% for AGIs $50k-75k, 0.0% for AGIs $75k-100k)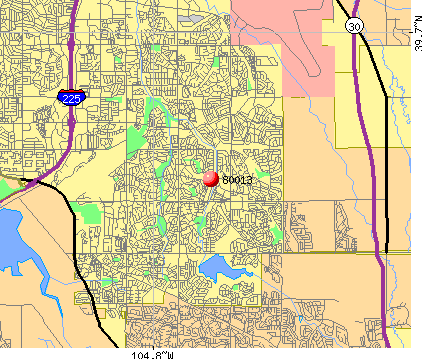 Nearest zip codes: 80015, 80017, 80014, 80011, 80018, 80012.
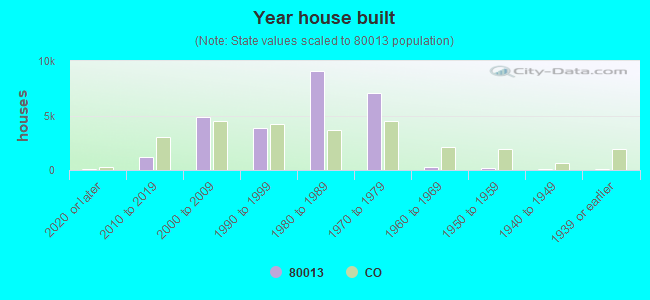


 Based on the data from the years 2002 - 2018 the average number of fires per year is 68. The highest number of reported fires - 124 took place in 2017, and the least - 7 in 2002. The data has a growing trend.
 When looking into fire subcategories, the most reports belonged to: Structure Fires (41.2%), and Outside Fires (38.1%).