Estimated zip code population in 2022: 65,618 Zip code population in 2010: 41,219 Zip code population in 2000: 7,754
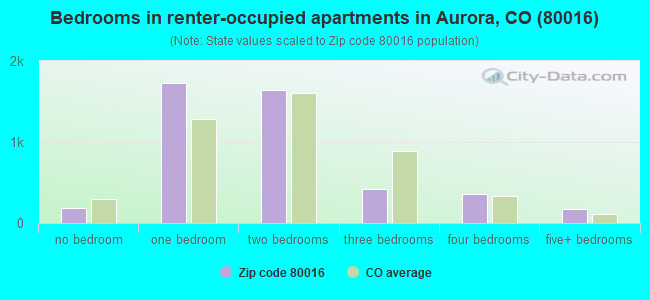
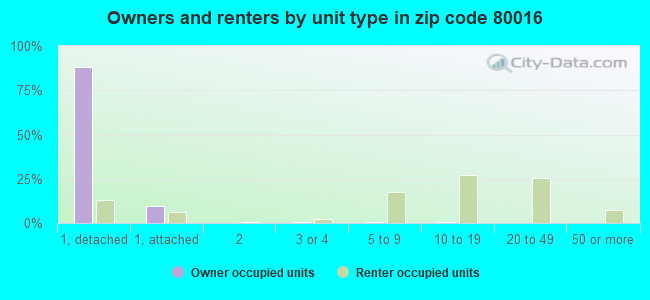
Houses and condos: 24,321 Renter-occupied apartments: 4,520
% of renters here:
19%
State:
34%
March 2022 cost of living index in zip code 80016: 102.9 (near average, U.S. average is 100)
Land area: 47.0 sq. mi. Water area: 1.2 sq. mi.
Population density: 1,396 people per square mile
(low).
OSM Map
General Map
Google Map
MSN Map
OSM Map
General Map
Google Map
MSN Map
OSM Map
General Map
Google Map
MSN Map
OSM Map
General Map
Google Map
MSN Map
Please wait while loading the map...
Real estate property taxes paid for housing units in 2022:
This zip code:
0.7% ($5,165)
Colorado:
0.5% ($2,422)
Median real estate property taxes paid for housing units with mortgages in 2022: $5,260 (0.7%) Median real estate property taxes paid for housing units with no mortgage in 2022: $4,817 (0.6%)
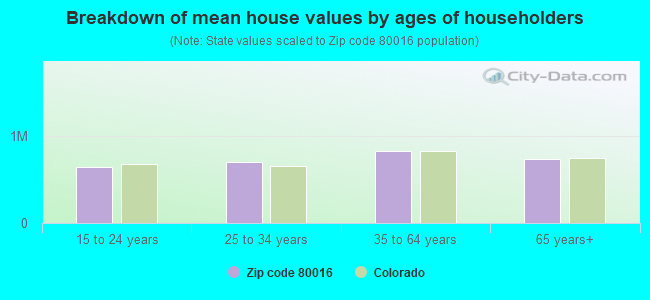
Estimated median house/condo value in 2022: $760,229
80016:
$760,229
Colorado:
$531,100
According to our research of Colorado and other state lists, there were 38 registered sex offenders living in 80016 zip code as of April 25, 2024. The ratio of all residents to sex offenders in zip code 80016 is 1,318 to 1. The ratio of registered sex offenders to all residents in this zip code is much lower than the state average.
Median resident age:
This zip code:
39.9 years
Colorado median age:
37.7 years
Average household size:
This zip code:
2.8 people
Colorado:
2.4 people
Averages for the 2020 tax year for zip code 80016, filed in 2021:
Average Adjusted Gross Income (AGI) in 2020: $127,664 (Individual Income Tax Returns)
Here:
$127,664
State:
$89,260
Salary/wage: $105,922 (reported on 84.1% of returns)
Here:
$105,922
State:
$70,330
(% of AGI for various income ranges: 1192.9% for AGIs below $25k, 3659.6% for AGIs $25k-50k, 6534.7% for AGIs $50k-75k, 9623.3% for AGIs $75k-100k, 19530.4% for AGIs $100k-200k, 76967.3% for AGIs over 200k)
Taxable interest for individuals: $1,804 (reported on 39.8% of returns)
This zip code:
$1,804
Colorado:
$2,176
(% of AGI for various income ranges: 17.2% for AGIs below $25k, 22.8% for AGIs $25k-50k, 59.7% for AGIs $50k-75k, 86.0% for AGIs $75k-100k, 118.6% for AGIs $100k-200k, 692.6% for AGIs over 200k)
Ordinary dividends: $6,701 (reported on 31.5% of returns)
Here:
$6,701
State:
$8,820
(% of AGI for various income ranges: 34.6% for AGIs below $25k, 62.2% for AGIs $25k-50k, 121.6% for AGIs $50k-75k, 214.3% for AGIs $75k-100k, 363.3% for AGIs $100k-200k, 2161.0% for AGIs over 200k)
Net capital gain/loss in AGI: +$26,663 (reported on 30.6% of returns)
Here:
+$26,663
State:
+$37,276
(% of AGI for various income ranges: 20.8% for AGIs below $25k, 42.9% for AGIs $25k-50k, 118.5% for AGIs $50k-75k, 228.5% for AGIs $75k-100k, 546.4% for AGIs $100k-200k, 12225.1% for AGIs over 200k)
Profit/loss from business: +$17,956 (reported on 18.9% of returns)
Here:
+$17,956
State:
+$15,295
(% of AGI for various income ranges: 104.4% for AGIs below $25k, 211.3% for AGIs $25k-50k, 263.6% for AGIs $50k-75k, 373.4% for AGIs $75k-100k, 629.8% for AGIs $100k-200k, 2897.8% for AGIs over 200k)
Taxable individual retirement arrangement distribution: $30,668 (reported on 10.8% of returns)
80016:
$30,668
Colorado:
$23,785
(% of AGI for various income ranges: 49.9% for AGIs below $25k, 130.0% for AGIs $25k-50k, 262.2% for AGIs $50k-75k, 562.7% for AGIs $75k-100k, 978.8% for AGIs $100k-200k, 2027.0% for AGIs over 200k)
Self-employed (Keogh) retirement plans: $25,260 (reported on 1.0% of returns)
80016:
$25,260
Colorado:
$23,633
(% of AGI for various income ranges: 6.6% for AGIs $25k-50k, 30.4% for AGIs $100k-200k, 335.4% for AGIs over 200k)
Total itemized deductions: $34,790 (reported on 25.1% of returns)
Here:
$34,790
State:
$35,141
(% of AGI for various income ranges: 81.4% for AGIs below $25k, 226.6% for AGIs $25k-50k, 615.6% for AGIs $50k-75k, 1088.1% for AGIs $75k-100k, 2082.1% for AGIs $100k-200k, 7361.3% for AGIs over 200k)
Charity contributions: $9,600 (reported on 20.7% of returns)
Here:
$9,600
State:
$12,103
(% of AGI for various income ranges: 3.8% for AGIs below $25k, 27.9% for AGIs $25k-50k, 61.6% for AGIs $50k-75k, 135.2% for AGIs $75k-100k, 317.6% for AGIs $100k-200k, 2362.7% for AGIs over 200k)
Taxes paid: $8,853 (reported on 25.1% of returns)
80016:
$8,853
State:
$7,710
(% of AGI for various income ranges: 13.5% for AGIs below $25k, 44.3% for AGIs $25k-50k, 144.4% for AGIs $50k-75k, 303.0% for AGIs $75k-100k, 626.0% for AGIs $100k-200k, 1670.9% for AGIs over 200k)
Earned income credit: $1,982 (reported on 6.1% of returns)
Here:
$1,982
State:
$2,053
(% of AGI for various income ranges: 46.9% for AGIs below $25k, 42.8% for AGIs $25k-50k, 0.8% for AGIs $50k-75k)
Percentage of individuals using paid preparers for their 2020 taxes: 93.2%
Here:
93%
State:
93%
(% for various income ranges: 91.4% for AGIs below $25k, 93.8% for AGIs $25k-50k, 93.4% for AGIs $50k-75k, 93.0% for AGIs $75k-100k, 93.8% for AGIs $100k-200k, 93.8% for AGIs over 200k)
Averages for the 2012 tax year for zip code 80016, filed in 2013:
Average Adjusted Gross Income (AGI) in 2012: $106,852 (Individual Income Tax Returns)
Here:
$106,852
State:
$69,103
Salary/wage: $90,236 (reported on 87.1% of returns)
Here:
$90,236
State:
$54,794
(% of AGI for various income ranges: 79.7% for AGIs below $25k, 79.7% for AGIs $25k-50k, 76.9% for AGIs $50k-75k, 74.9% for AGIs $75k-100k, 80.0% for AGIs $100k-200k, 65.9% for AGIs over 200k)
Taxable interest for individuals: $1,717 (reported on 44.0% of returns)
This zip code:
$1,717
Colorado:
$1,971
(% of AGI for various income ranges: 1.5% for AGIs below $25k, 0.7% for AGIs $25k-50k, 0.7% for AGIs $50k-75k, 0.7% for AGIs $75k-100k, 0.5% for AGIs $100k-200k, 0.9% for AGIs over 200k)
Ordinary dividends: $5,895 (reported on 31.3% of returns)
Here:
$5,895
State:
$7,140
(% of AGI for various income ranges: 3.0% for AGIs below $25k, 1.4% for AGIs $25k-50k, 1.4% for AGIs $50k-75k, 1.2% for AGIs $75k-100k, 1.2% for AGIs $100k-200k, 2.4% for AGIs over 200k)
Net capital gain/loss in AGI: +$13,240 (reported on 28.4% of returns)
Here:
+$13,240
State:
+$23,009
(% of AGI for various income ranges: 0.2% for AGIs below $25k, 0.8% for AGIs $25k-50k, 0.5% for AGIs $50k-75k, 0.7% for AGIs $75k-100k, 1.0% for AGIs $100k-200k, 7.4% for AGIs over 200k)
Profit/loss from business: +$19,683 (reported on 18.1% of returns)
Here:
+$19,683
State:
+$13,514
(% of AGI for various income ranges: 7.8% for AGIs below $25k, 3.8% for AGIs $25k-50k, 3.0% for AGIs $50k-75k, 3.6% for AGIs $75k-100k, 2.9% for AGIs $100k-200k, 3.4% for AGIs over 200k)
Taxable individual retirement arrangement distribution: $23,305 (reported on 11.8% of returns)
80016:
$23,305
Colorado:
$17,927
(% of AGI for various income ranges: 3.0% for AGIs below $25k, 3.3% for AGIs $25k-50k, 3.4% for AGIs $50k-75k, 3.4% for AGIs $75k-100k, 2.9% for AGIs $100k-200k, 1.9% for AGIs over 200k)
Self-employment retirement plans: $20,215 (reported on 1.3% of returns)
80016:
$20,215
Colorado:
$19,483
(% of AGI for various income ranges: 0.3% for AGIs $25k-50k, 0.1% for AGIs $75k-100k, 0.2% for AGIs $100k-200k, 0.4% for AGIs over 200k)
Total itemized deductions: $29,058 (18% of AGI, reported on 57.5% of returns)
Here:
$29,058
State:
$24,621
Here:
18.3% of AGI
State:
18.5% of AGI
(% of AGI for various income ranges: 16.7% for AGIs below $25k, 15.4% for AGIs $25k-50k, 17.7% for AGIs $50k-75k, 19.0% for AGIs $75k-100k, 17.8% for AGIs $100k-200k, 12.7% for AGIs over 200k)
Charity contributions: $4,360 (reported on 50.5% of returns)
Here:
$4,360
State:
$4,449
(% of AGI for various income ranges: 1.0% for AGIs below $25k, 1.5% for AGIs $25k-50k, 1.7% for AGIs $50k-75k, 1.9% for AGIs $75k-100k, 2.2% for AGIs $100k-200k, 2.2% for AGIs over 200k)
Taxes paid: $10,263 (reported on 57.4% of returns)
80016:
$10,263
State:
$7,641
(% of AGI for various income ranges: 3.4% for AGIs below $25k, 3.3% for AGIs $25k-50k, 4.6% for AGIs $50k-75k, 5.5% for AGIs $75k-100k, 6.0% for AGIs $100k-200k, 5.6% for AGIs over 200k)
Earned income credit: $1,956 (reported on 7.0% of returns)
Here:
$1,956
State:
$2,095
(% of AGI for various income ranges: 3.9% for AGIs below $25k, 0.8% for AGIs $25k-50k)
Percentage of individuals using paid preparers for their 2012 taxes: 48.3%
Here:
48%
State:
49%
(% for various income ranges: 40.5% for AGIs below $25k, 42.6% for AGIs $25k-50k, 49.0% for AGIs $50k-75k, 48.0% for AGIs $75k-100k, 50.9% for AGIs $100k-200k, 64.7% for AGIs over 200k)
Averages for the 2004 tax year for zip code 80016, filed in 2005:
Average Adjusted Gross Income (AGI) in 2004: $100,386 (Individual Income Tax Returns)
Here:
$100,386
State:
$55,014
Salary/wage: $80,341 (reported on 86.5% of returns)
Here:
$80,341
State:
$46,010
(% of AGI for various income ranges: 79.9% for AGIs $10k-25k, 80.1% for AGIs $25k-50k, 76.5% for AGIs $50k-75k, 81.5% for AGIs $75k-100k, 64.7% for AGIs over 100k)
Taxable interest for individuals: $2,858 (reported on 59.8% of returns)
This zip code:
$2,858
Colorado:
$2,127
(% of AGI for various income ranges: 2.6% for AGIs $10k-25k, 1.5% for AGIs $25k-50k, 1.4% for AGIs $50k-75k, 1.2% for AGIs $75k-100k, 1.7% for AGIs over 100k)
Taxable dividends: $3,809 (reported on 39.1% of returns)
Here:
$3,809
State:
$3,782
(% of AGI for various income ranges: 2.7% for AGIs $10k-25k, 1.6% for AGIs $25k-50k, 1.5% for AGIs $50k-75k, 1.2% for AGIs $75k-100k, 1.4% for AGIs over 100k)
Net capital gain/loss: +$25,681 (reported on 37.4% of returns)
Here:
+$25,681
State:
+$17,882
(% of AGI for various income ranges: 0.4% for AGIs $10k-25k, 0.5% for AGIs $25k-50k, 0.8% for AGIs $50k-75k, 1.3% for AGIs $75k-100k, 12.6% for AGIs over 100k)
Profit/loss from business: +$19,967 (reported on 19.4% of returns)
Here:
+$19,967
State:
+$11,247
(% of AGI for various income ranges: 7.3% for AGIs $10k-25k, 5.1% for AGIs $25k-50k, 4.4% for AGIs $50k-75k, 3.2% for AGIs $75k-100k, 3.7% for AGIs over 100k)
Profit/loss from farming: +$2,763 (reported on 0.3% of returns)
Here:
+$2,763
State:
-$7,127
IRA payment deduction: $3,520 (reported on 3.4% of returns)
80016:
$3,520
Colorado:
$2,947
(% of AGI for various income ranges: 0.5% for AGIs $10k-25k, 0.2% for AGIs $25k-50k, 0.2% for AGIs $50k-75k, 0.2% for AGIs $75k-100k, 0.1% for AGIs over 100k)
Self-employed pension: $17,637 (reported on 2.1% of returns)
Here:
$17,637
Colorado:
$13,653
(% of AGI for various income ranges: 0.1% for AGIs $25k-50k, 0.2% for AGIs $50k-75k, 0.1% for AGIs $75k-100k, 0.4% for AGIs over 100k)
Total itemized deductions: $28,373 (20% of AGI, reported on 63.0% of returns)
Here:
$28,373
State:
$20,560
Here:
19.7% of AGI
State:
21.4% of AGI
(% of AGI for various income ranges: 25.5% for AGIs $10k-25k, 23.1% for AGIs $25k-50k, 25.7% for AGIs $50k-75k, 25.1% for AGIs $75k-100k, 15.1% for AGIs over 100k)
Charity contributions deductions: $4,153 (3% of AGI, reported on 57.3% of returns)
Here:
$4,153
State:
$3,518
Here:
2.8% of AGI
State:
3.4% of AGI
(% of AGI for various income ranges: 1.8% for AGIs $10k-25k, 2.1% for AGIs $25k-50k, 2.5% for AGIs $50k-75k, 2.8% for AGIs $75k-100k, 2.3% for AGIs over 100k)
Total tax: $19,075 (reported on 84.6% of returns)
80016:
$19,075
State:
$9,173
(% of AGI for various income ranges: 5.1% for AGIs $10k-25k, 7.3% for AGIs $25k-50k, 8.7% for AGIs $50k-75k, 9.3% for AGIs $75k-100k, 18.7% for AGIs over 100k)
Earned income credit: $1,523 (reported on 5.0% of returns)
Here:
$1,523
State:
$1,595
Percentage of individuals using paid preparers for their 2004 taxes: 54.8%
Here:
55%
State:
55%
(% for various income ranges: 46.9% for AGIs below $10k, 52.5% for AGIs $10k-25k, 50.5% for AGIs $25k-50k, 56.2% for AGIs $50k-75k, 56.1% for AGIs $75k-100k, 60.5% for AGIs over 100k)
Likely homosexual households (counted as self-reported same-sex unmarried-partner households)
Lesbian couples: 0.0% of all households
Gay men: 0.0% of all households
Household received Food Stamps/SNAP in the past 12 months: 448 Household did not receive Food Stamps/SNAP in the past 12 months: 22,971
Women who had a birth in the past 12 months: 684 (640 now married, 56 unmarried) Women who did not have a birth in the past 12 months: 14,955 (8,623 now married, 6,273 unmarried)
Housing units in zip code 80016 with a mortgage: 15,461 (2,278 second mortgage, 67 home equity loan, 2,077 both second mortgage and home equity loan) Houses without a mortgage: 196
Median monthly owner costs for units with a mortgage: $2,949 Median monthly owner costs for units without a mortgage: $917
Residents with income below the poverty level in 2022:
This zip code:
4.0%
Whole state:
9.4%
Residents with income below 50% of the poverty level in 2022:
This zip code:
2.0%
Whole state:
4.6%
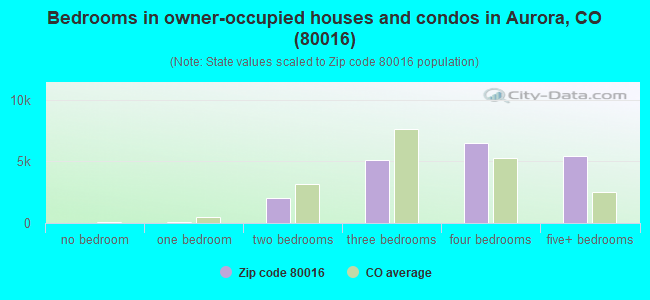
Median number of rooms in houses and condos:
Here:
8.0
State:
6.8
Median number of rooms in apartments:
Here:
3.9
State:
4.0
Notable locations in this zip code not listed on our city pages
Notable locations in zip code 80016: Valley Country Club (A), Aurora Police Department District 3 (B), South Metro Fire Rescue Authority Station 42 (C), Aurora Fire Department Station 13 (D), Aurora Fire Department Station 14 (E). Display/hide their locations on the map
Parks in zip code 80016 include: Cherry Creek State Park (1), Hutchison Memorial Park (2), Arapahoe Park Racetrack (3). Display/hide their locations on the map
14,161 married couples with children.
2,280 single-parent households (697 men, 1,583 women).
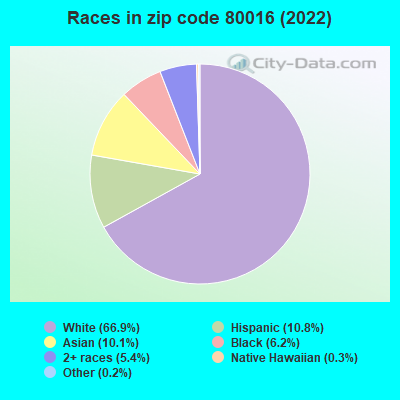
84.2% of residents of 80016 zip code speak English at home.
4.4% of residents speak Spanish at home (78% very well, 14% well, 6% not well, 3% not at all).
3.9% of residents speak other Indo-European language at home (74% very well, 17% well, 8% not well, 1% not at all).
5.7% of residents speak Asian or Pacific Island language at home (68% very well, 16% well, 15% not well, 1% not at all).
1.4% of residents speak other language at home (73% very well, 26% well, 1% not well).
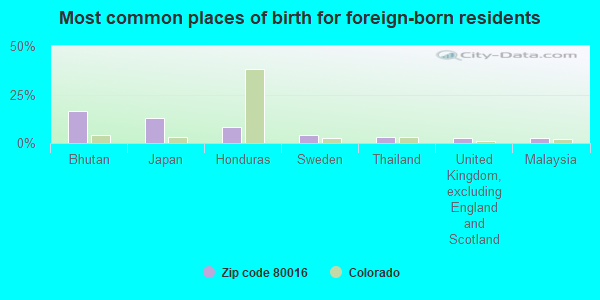
Foreign born population: 7,815 (11.9%) (67.5% of them are naturalized citizens)
This zip code:
11.9%
Whole state:
9.5%
17%Bhutan
13%Japan
8%Honduras
4%Sweden
3%Thailand
3%United Kingdom, excluding England and Scotland
3%Malaysia
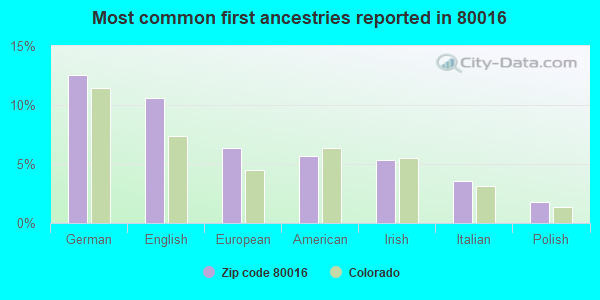
13%German
11%English
6%European
6%American
5%Irish
4%Italian
2%Polish
Year of entry for the foreign-born population
1,7492010 or later
2,6952000 to 2009
1,9501990 to 1999
2,460Before 1990
Facilities with environmental interests located in this zip code:
GIGANTIC CLEANERS AND LAUNDRY (15442 EAST ORCHARD ROAD in AURORA, CO)
AIR MINOR (AIRS/AFS) STATE MASTER (Colorado database) - RCRAINFO-COD981541402, SQG CRITERIA AND HAZARDOUS AIR POLLUTANT INVENTORY (Inventory of air pollution sources) Conditionally Exempt Small Quantity Generators, less than 100 kg/month of hazardous waste (Resource Conservation and Recovery Act (tracking hazardous waste)) - notification Business SIC classification: DRYCLEANING PLANTS, EXCEPT RUG CLEANING Business NAICS classification: DRYCLEANING AND LAUNDRY SERVICES (EXCEPT COIN-OPERATED). Organizations: CHOND AND SUK PAK (CONTACT/OWNER)
Alternative names: GIGANTIC CLEANERS #31, GIGANTIC CLNRS NO 31
CREEKSIDE ELEMENTARY SCHOOL (19993 EAST LONG AVENUE in CENTENNIAL, CO)
(National Center for Education Statistics) - STATE ID-1970 Organizations: CHERRY CREEK 5 (SCHOOL DISTRICT)
GRANDVIEW HIGH SCHOOL (20500 EAST ARAPAHOE ROAD in AURORA, CO)
(National Center for Education Statistics) - STATE ID-3589 Organizations: CHERRY CREEK 5 (SCHOOL DISTRICT)
FOX CLEANERS (6700 S PARKER RD UNIT B in AURORA, CO)
AIR MINOR (AIRS/AFS) CRITERIA AND HAZARDOUS AIR POLLUTANT INVENTORY (Inventory of air pollution sources) Business SIC classification: DRYCLEANING PLANTS, EXCEPT RUG CLEANING
ALBERTSONS #899 (6100 S GUN CLUB RD in AURORA, CO)
Small Quantity Generators, between 100 kg and 1000 kg of hazardous waste/month (Resource Conservation and Recovery Act (tracking hazardous waste)) Organizations: ALBERTSONS INC (CONTACT/OWNER)
ARAPAHOE PARK RACETRACK (26000 EAST QUINCY AVENUE in AURORA, CO)
National Pollutant Discharge Elimination System NON-MAJOR (Tracking pollutant discharge elimination systems) - permit Business SIC classification: SEWERAGE SYSTEMS Alternative names: RACING ASSOCIATES OF COLORADO
HIGH POINTE - D.R. HORTON (CORNER OF 60TH AND DUNKIRK in AURORA, CO)
National Pollutant Discharge Elimination System NON-MAJOR (Tracking pollutant discharge elimination systems) - permit Business SIC classification: GENERAL CONTRACTORS-SINGLE-FAMILY HOUSES
HOME DEPOT #1528 (6000 S GUN CLUB RD in AURORA, CO)
Conditionally Exempt Small Quantity Generators, less than 100 kg/month of hazardous waste (Resource Conservation and Recovery Act (tracking hazardous waste)) Organizations: HOME DEPOT #1528 (CONTACT/OPERATOR)
, HOME DEPOT USA (CONTACT/OWNER)
JEEP/DEMO RANGE (FORMER LOWRY BOMBING &) (E 1/2 OF S17 T5S R65W in AURORA, CO)
Small Quantity Generators, between 100 kg and 1000 kg of hazardous waste/month (Resource Conservation and Recovery Act (tracking hazardous waste)) Organizations: CITY OF AURORA (CONTACT/OWNER)
Housing units lacking complete plumbing facilities: 0.4% Housing units lacking complete kitchen facilities: 0.5%
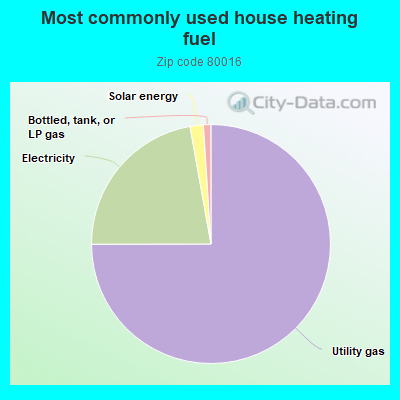
74.9%Utility gas
22.2%Electricity
1.8%Solar energy
1.0%Bottled, tank, or LP gas
Population in 1990: 4,085. Population change in the 1990s: +3,669 (+89.8%).
Place of birth for U.S.-born residents:
This state: 24,366
Northeast: 5,265
Midwest: 10,999
South: 6,640
West: 9,340
45% of the 80016 zip code residents lived in the same house 5 years ago. Out of people who lived in different houses, 48% lived in this county. Out of people who lived in different counties, 50% lived in Colorado.
88% of the 80016 zip code residents lived in the same house 1 year ago. Out of people who lived in different houses, 42% moved from this county. Out of people who lived in different houses, 24% moved from different county within same state. Out of people who lived in different houses, 31% moved from different state. Out of people who lived in different houses, 3% moved from abroad.
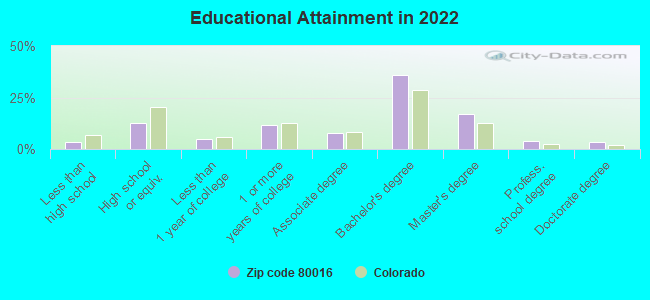
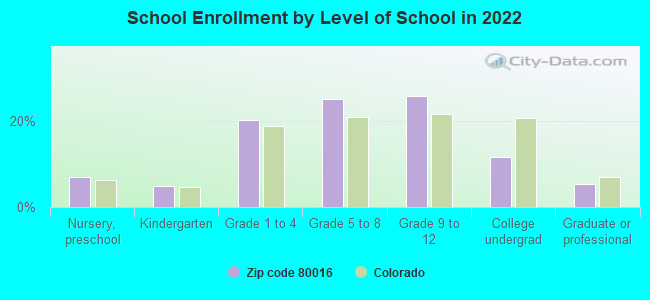
Private vs. public school enrollment:
Students in private schools in grades 1 to 8 (elementary and middle school): 1,008
Here:
12.3%
Colorado:
11.4%
Students in private schools in grades 9 to 12 (high school): 329
Here:
7.1%
Colorado:
8.5%
Students in private undergraduate colleges: 363
Here:
17.3%
Colorado:
14.0%
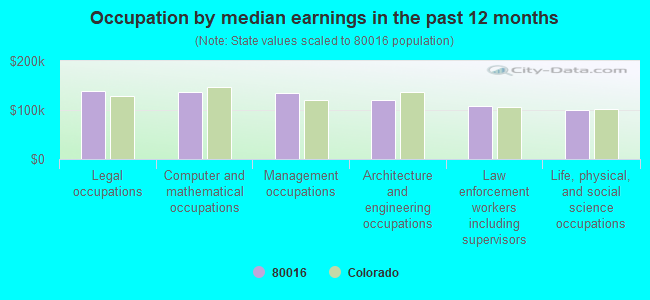
Occupation by median earnings in the past 12 months ($)
139,237Legal occupations
135,930Computer and mathematical occupations
134,043Management occupations
119,664Architecture and engineering occupations
109,039Law enforcement workers including supervisors
100,688Life, physical, and social science occupations
Companies with federal contracts located in this zip code:
DRAGOO, ROBERT A MD (6359 S NETHERLAND CIRCLE in AURORA, CO; small business) : $293,539 in 4 contractsfrom 2005 to 2006
$289,044 with Army for Ophthalmology Services. Signed on 2005-10-05. Completion date: 2005-09-30.
$24,620, same as above.Signed on 2005-07-20. Completion date: 2005-09-30.
-$6,475, same as above.Signed on 2006-03-03. Completion date: 2005-09-30.
-$13,650, same as above.Signed on 2006-04-27. Completion date: 2005-09-30.
STAMES, PAUL T (6781 S CHAPPARAL CIRCLE W in AURORA, CO; small business) : $89,000 in 2 contractsin 2005
$63,000 with Navy for Lectures For Training. Taking place in CA. Signed on 2005-06-07. Completion date: 2005-08-31.
$26,000 with Navy for Other Research and Development -- Engineering Development (R&D). Taking place in CA. Signed on 2005-09-01. Completion date: 2005-09-25.
WYATT SCIENTIFIC INC (8057 S MILLBROOK WAY in AURORA, CO; small business) : $55,888 in 2 contractsin 2005
$55,595 with Army for Hospital Furniture, Equipment, Utensils, and Supplies. Signed on 2005-03-29. Completion date: 2005-02-28.
$293, same as above.Signed on 2005-04-11. Completion date: 2005-02-28.
ABOUTBI, INC (7171 S CHEROKEE TRAIL #183 in AURORA, CO; small business)
$2,898 with Army for ADP Software. Taking place in KY. Signed on 2004-08-19. Completion date: 2004-09-20.
rocky mountain welding, inc. (19014 E. Low Dr. in Aurora, CO; small business)
$700 with Bureau of Prisoners/Federal Prison System for Gas Welding, Heat Cutting, and Metalizing Equipment. Signed on 2005-06-15. Completion date: 2005-06-30.
Top industries in this zip code by the number of employees in 2005:
2002 - 2018 National Fire Incident Reporting System (NFIRS) incidents
Based on the data from the years 2002 - 2018 the average number of fires per year is 48. The highest number of reported fires - 81 took place in 2017, and the least - 17 in 2002. The data has a growing trend.
When looking into fire subcategories, the most reports belonged to: Outside Fires (48.9%), and Structure Fires (37.4%).
Fire incident types reported to NFIRS in Zip Code 80016


+$2,763
-$7,127
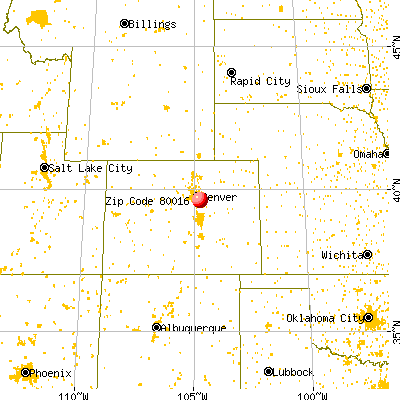
 Nearest zip codes: 80015, 80013, 80138, 80018, 80017, 80134.


 Based on the data from the years 2002 - 2018 the average number of fires per year is 48. The highest number of reported fires - 81 took place in 2017, and the least - 17 in 2002. The data has a growing trend.
 When looking into fire subcategories, the most reports belonged to: Outside Fires (48.9%), and Structure Fires (37.4%).