Estimated zip code population in 2022: 32,447 Zip code population in 2010: 30,930 Zip code population in 2000: 29,947
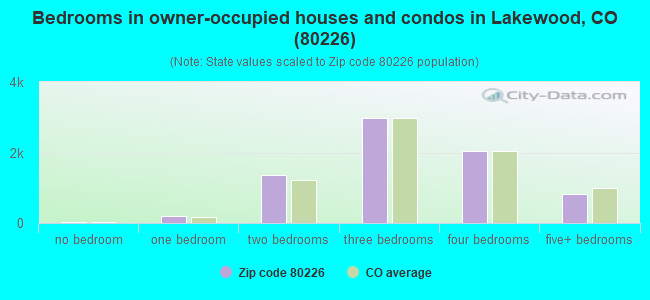
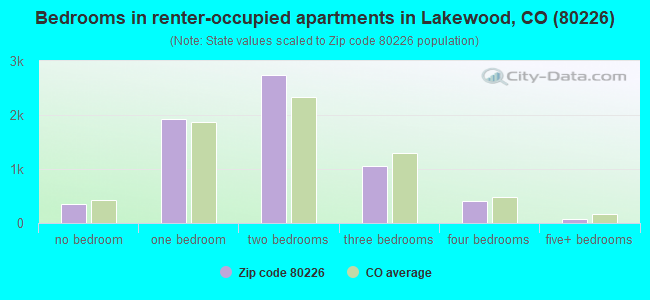
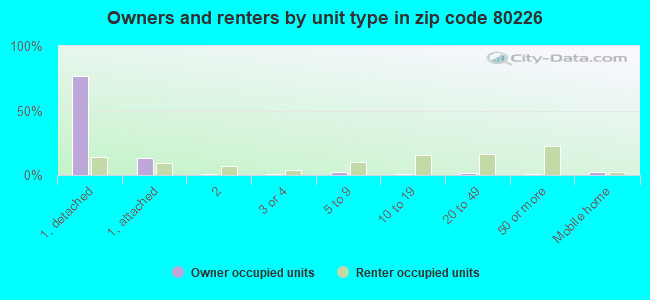
Houses and condos: 14,906 Renter-occupied apartments: 6,623
% of renters here:
47%
State:
34%
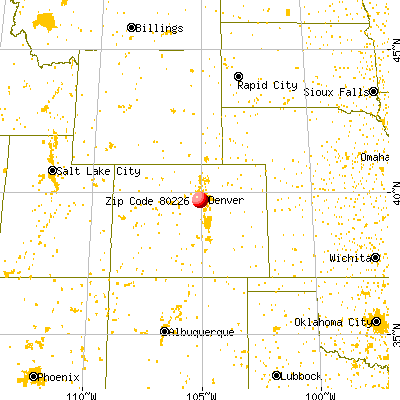
March 2022 cost of living index in zip code 80226: 110.6 (more than average, U.S. average is 100)
Land area: 8.1 sq. mi. Water area: 0.1 sq. mi.
Population density: 4,029 people per square mile
(average).
OSM Map
General Map
Google Map
MSN Map
OSM Map
General Map
Google Map
MSN Map
OSM Map
General Map
Google Map
MSN Map
OSM Map
General Map
Google Map
MSN Map
Please wait while loading the map...
Real estate property taxes paid for housing units in 2022:
This zip code:
0.4% ($2,452)
Colorado:
0.5% ($2,422)
Median real estate property taxes paid for housing units with mortgages in 2022: $2,501 (0.4%) Median real estate property taxes paid for housing units with no mortgage in 2022: $2,380 (0.5%)
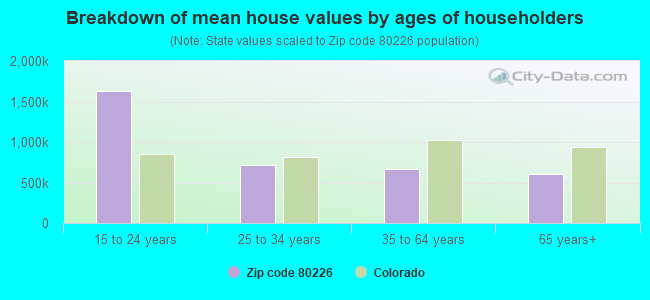
Estimated median house/condo value in 2022: $544,893
80226:
$544,893
Colorado:
$531,100
According to our research of Colorado and other state lists, there were 89 registered sex offenders living in 80226 zip code as of April 27, 2024. The ratio of all residents to sex offenders in zip code 80226 is 368 to 1. The ratio of registered sex offenders to all residents in this zip code is near the state average.
Median resident age:
This zip code:
36.7 years
Colorado median age:
37.7 years
Average household size:
This zip code:
2.2 people
Colorado:
2.4 people
Averages for the 2020 tax year for zip code 80226, filed in 2021:
Average Adjusted Gross Income (AGI) in 2020: $63,817 (Individual Income Tax Returns)
Here:
$63,817
State:
$89,260
Salary/wage: $54,371 (reported on 80.7% of returns)
Here:
$54,371
State:
$70,330
(% of AGI for various income ranges: 1161.8% for AGIs below $25k, 3723.6% for AGIs $25k-50k, 6723.0% for AGIs $50k-75k, 9941.3% for AGIs $75k-100k, 18440.4% for AGIs $100k-200k, 58242.9% for AGIs over 200k)
Taxable interest for individuals: $1,771 (reported on 27.2% of returns)
This zip code:
$1,771
Colorado:
$2,176
(% of AGI for various income ranges: 16.2% for AGIs below $25k, 18.7% for AGIs $25k-50k, 43.8% for AGIs $50k-75k, 76.5% for AGIs $75k-100k, 147.0% for AGIs $100k-200k, 2035.9% for AGIs over 200k)
Ordinary dividends: $4,497 (reported on 19.0% of returns)
Here:
$4,497
State:
$8,820
(% of AGI for various income ranges: 27.5% for AGIs below $25k, 37.4% for AGIs $25k-50k, 96.4% for AGIs $50k-75k, 146.9% for AGIs $75k-100k, 312.4% for AGIs $100k-200k, 2850.6% for AGIs over 200k)
Net capital gain/loss in AGI: +$19,484 (reported on 17.9% of returns)
Here:
+$19,484
State:
+$37,276
(% of AGI for various income ranges: 11.9% for AGIs below $25k, 34.1% for AGIs $25k-50k, 84.7% for AGIs $50k-75k, 181.3% for AGIs $75k-100k, 778.7% for AGIs $100k-200k, 26397.1% for AGIs over 200k)
Profit/loss from business: +$12,584 (reported on 17.2% of returns)
Here:
+$12,584
State:
+$15,295
(% of AGI for various income ranges: 209.3% for AGIs below $25k, 221.2% for AGIs $25k-50k, 273.9% for AGIs $50k-75k, 350.6% for AGIs $75k-100k, 648.0% for AGIs $100k-200k, 2485.3% for AGIs over 200k)
Taxable individual retirement arrangement distribution: $17,376 (reported on 8.5% of returns)
80226:
$17,376
Colorado:
$23,785
(% of AGI for various income ranges: 63.2% for AGIs below $25k, 79.9% for AGIs $25k-50k, 174.3% for AGIs $50k-75k, 327.4% for AGIs $75k-100k, 713.8% for AGIs $100k-200k, 2432.9% for AGIs over 200k)
Self-employed (Keogh) retirement plans: $14,233 (reported on 0.3% of returns)
80226:
$14,233
Colorado:
$23,633
(% of AGI for various income ranges: 3.9% for AGIs below $25k, 21.2% for AGIs $100k-200k, 262.4% for AGIs over 200k)
Total itemized deductions: $32,959 (reported on 9.4% of returns)
Here:
$32,959
State:
$35,141
(% of AGI for various income ranges: 52.7% for AGIs below $25k, 110.1% for AGIs $25k-50k, 369.8% for AGIs $50k-75k, 612.7% for AGIs $75k-100k, 1179.3% for AGIs $100k-200k, 10889.4% for AGIs over 200k)
Charity contributions: $7,618 (reported on 6.9% of returns)
Here:
$7,618
State:
$12,103
(% of AGI for various income ranges: 2.8% for AGIs below $25k, 14.7% for AGIs $25k-50k, 36.9% for AGIs $50k-75k, 75.6% for AGIs $75k-100k, 193.4% for AGIs $100k-200k, 2575.9% for AGIs over 200k)
Taxes paid: $6,664 (reported on 9.4% of returns)
80226:
$6,664
State:
$7,710
(% of AGI for various income ranges: 5.8% for AGIs below $25k, 18.3% for AGIs $25k-50k, 75.7% for AGIs $50k-75k, 157.4% for AGIs $75k-100k, 349.5% for AGIs $100k-200k, 1325.9% for AGIs over 200k)
Earned income credit: $2,016 (reported on 12.3% of returns)
Here:
$2,016
State:
$2,053
(% of AGI for various income ranges: 76.0% for AGIs below $25k, 44.3% for AGIs $25k-50k, 0.4% for AGIs $50k-75k)
Percentage of individuals using paid preparers for their 2020 taxes: 91.0%
Here:
91%
State:
93%
(% for various income ranges: 88.0% for AGIs below $25k, 91.9% for AGIs $25k-50k, 91.5% for AGIs $50k-75k, 92.3% for AGIs $75k-100k, 92.8% for AGIs $100k-200k, 94.6% for AGIs over 200k)
Averages for the 2012 tax year for zip code 80226, filed in 2013:
Average Adjusted Gross Income (AGI) in 2012: $49,205 (Individual Income Tax Returns)
Here:
$49,205
State:
$69,103
Salary/wage: $41,955 (reported on 82.9% of returns)
Here:
$41,955
State:
$54,794
(% of AGI for various income ranges: 74.6% for AGIs below $25k, 80.8% for AGIs $25k-50k, 76.0% for AGIs $50k-75k, 72.8% for AGIs $75k-100k, 74.7% for AGIs $100k-200k, 36.6% for AGIs over 200k)
Taxable interest for individuals: $1,368 (reported on 28.7% of returns)
This zip code:
$1,368
Colorado:
$1,971
(% of AGI for various income ranges: 0.9% for AGIs below $25k, 0.5% for AGIs $25k-50k, 0.6% for AGIs $50k-75k, 0.7% for AGIs $75k-100k, 0.8% for AGIs $100k-200k, 1.4% for AGIs over 200k)
Ordinary dividends: $4,085 (reported on 17.8% of returns)
Here:
$4,085
State:
$7,140
(% of AGI for various income ranges: 1.3% for AGIs below $25k, 0.7% for AGIs $25k-50k, 1.2% for AGIs $50k-75k, 1.2% for AGIs $75k-100k, 1.6% for AGIs $100k-200k, 3.1% for AGIs over 200k)
Net capital gain/loss in AGI: +$4,945 (reported on 14.4% of returns)
Here:
+$4,945
State:
+$23,009
(% of AGI for various income ranges: 0.2% for AGIs $25k-50k, 0.3% for AGIs $50k-75k, 0.9% for AGIs $75k-100k, 1.5% for AGIs $100k-200k, 6.6% for AGIs over 200k)
Profit/loss from business: +$11,988 (reported on 15.5% of returns)
Here:
+$11,988
State:
+$13,514
(% of AGI for various income ranges: 9.8% for AGIs below $25k, 3.3% for AGIs $25k-50k, 2.7% for AGIs $50k-75k, 2.8% for AGIs $75k-100k, 2.9% for AGIs $100k-200k, 4.0% for AGIs over 200k)
Taxable individual retirement arrangement distribution: $13,394 (reported on 9.4% of returns)
80226:
$13,394
Colorado:
$17,927
(% of AGI for various income ranges: 2.8% for AGIs below $25k, 2.2% for AGIs $25k-50k, 2.6% for AGIs $50k-75k, 2.7% for AGIs $75k-100k, 3.1% for AGIs $100k-200k, 1.7% for AGIs over 200k)
Self-employment retirement plans: $13,712 (reported on 0.5% of returns)
80226:
$13,712
Colorado:
$19,483
Total itemized deductions: $20,569 (23% of AGI, reported on 30.0% of returns)
Here:
$20,569
State:
$24,621
Here:
22.9% of AGI
State:
18.5% of AGI
(% of AGI for various income ranges: 8.4% for AGIs below $25k, 9.8% for AGIs $25k-50k, 13.0% for AGIs $50k-75k, 13.0% for AGIs $75k-100k, 13.1% for AGIs $100k-200k, 17.6% for AGIs over 200k)
Charity contributions: $5,153 (reported on 24.0% of returns)
Here:
$5,153
State:
$4,449
(% of AGI for various income ranges: 0.5% for AGIs below $25k, 0.9% for AGIs $25k-50k, 1.4% for AGIs $50k-75k, 1.4% for AGIs $75k-100k, 2.0% for AGIs $100k-200k, 10.1% for AGIs over 200k)
Taxes paid: $5,268 (reported on 29.8% of returns)
80226:
$5,268
State:
$7,641
(% of AGI for various income ranges: 1.4% for AGIs below $25k, 1.9% for AGIs $25k-50k, 3.0% for AGIs $50k-75k, 3.4% for AGIs $75k-100k, 4.3% for AGIs $100k-200k, 4.5% for AGIs over 200k)
Earned income credit: $2,204 (reported on 18.0% of returns)
Here:
$2,204
State:
$2,095
(% of AGI for various income ranges: 6.2% for AGIs below $25k, 0.9% for AGIs $25k-50k)
Percentage of individuals using paid preparers for their 2012 taxes: 47.0%
Here:
47%
State:
49%
(% for various income ranges: 45.0% for AGIs below $25k, 44.4% for AGIs $25k-50k, 48.6% for AGIs $50k-75k, 50.7% for AGIs $75k-100k, 53.2% for AGIs $100k-200k, 72.0% for AGIs over 200k)
Averages for the 2004 tax year for zip code 80226, filed in 2005:
Average Adjusted Gross Income (AGI) in 2004: $43,966 (Individual Income Tax Returns)
Here:
$43,966
State:
$55,014
Salary/wage: $37,433 (reported on 81.3% of returns)
Here:
$37,433
State:
$46,010
(% of AGI for various income ranges: 118.2% for AGIs below $10k, 71.7% for AGIs $10k-25k, 80.8% for AGIs $25k-50k, 76.6% for AGIs $50k-75k, 78.7% for AGIs $75k-100k, 46.7% for AGIs over 100k)
Taxable interest for individuals: $2,777 (reported on 45.3% of returns)
This zip code:
$2,777
Colorado:
$2,127
(% of AGI for various income ranges: 6.2% for AGIs below $10k, 2.5% for AGIs $10k-25k, 1.4% for AGIs $25k-50k, 1.6% for AGIs $50k-75k, 1.2% for AGIs $75k-100k, 5.7% for AGIs over 100k)
Taxable dividends: $2,523 (reported on 23.6% of returns)
Here:
$2,523
State:
$3,782
(% of AGI for various income ranges: 4.4% for AGIs below $10k, 1.6% for AGIs $10k-25k, 0.9% for AGIs $25k-50k, 1.0% for AGIs $50k-75k, 1.2% for AGIs $75k-100k, 1.8% for AGIs over 100k)
Net capital gain/loss: +$15,201 (reported on 19.6% of returns)
Here:
+$15,201
State:
+$17,882
(% of AGI for various income ranges: -2.5% for AGIs below $10k, 0.2% for AGIs $10k-25k, 0.3% for AGIs $25k-50k, 0.6% for AGIs $50k-75k, 1.0% for AGIs $75k-100k, 21.9% for AGIs over 100k)
Profit/loss from business: +$9,216 (reported on 15.6% of returns)
Here:
+$9,216
State:
+$11,247
(% of AGI for various income ranges: 4.6% for AGIs below $10k, 7.6% for AGIs $10k-25k, 3.0% for AGIs $25k-50k, 2.8% for AGIs $50k-75k, 2.5% for AGIs $75k-100k, 2.9% for AGIs over 100k)
IRA payment deduction: $2,770 (reported on 2.7% of returns)
80226:
$2,770
Colorado:
$2,947
(% of AGI for various income ranges: 0.4% for AGIs below $10k, 0.2% for AGIs $10k-25k, 0.2% for AGIs $25k-50k, 0.2% for AGIs $50k-75k, 0.2% for AGIs $75k-100k, 0.1% for AGIs over 100k)
Self-employed pension: $9,241 (reported on 0.8% of returns)
Here:
$9,241
Colorado:
$13,653
(% of AGI for various income ranges: 0.5% for AGIs below $10k, 0.1% for AGIs $25k-50k, 0.1% for AGIs $50k-75k, 0.2% for AGIs $75k-100k, 0.3% for AGIs over 100k)
Total itemized deductions: $19,494 (27% of AGI, reported on 37.7% of returns)
Here:
$19,494
State:
$20,560
Here:
26.5% of AGI
State:
21.4% of AGI
(% of AGI for various income ranges: 26.4% for AGIs below $10k, 12.6% for AGIs $10k-25k, 14.8% for AGIs $25k-50k, 17.1% for AGIs $50k-75k, 16.9% for AGIs $75k-100k, 18.8% for AGIs over 100k)
Charity contributions deductions: $3,138 (4% of AGI, reported on 32.1% of returns)
Here:
$3,138
State:
$3,518
Here:
4.1% of AGI
State:
3.4% of AGI
(% of AGI for various income ranges: 1.3% for AGIs below $10k, 1.2% for AGIs $10k-25k, 1.4% for AGIs $25k-50k, 2.1% for AGIs $50k-75k, 1.9% for AGIs $75k-100k, 3.8% for AGIs over 100k)
Total tax: $6,012 (reported on 76.7% of returns)
80226:
$6,012
State:
$9,173
(% of AGI for various income ranges: 3.6% for AGIs below $10k, 4.5% for AGIs $10k-25k, 7.4% for AGIs $25k-50k, 9.7% for AGIs $50k-75k, 11.1% for AGIs $75k-100k, 15.6% for AGIs over 100k)
Earned income credit: $1,582 (reported on 13.5% of returns)
Here:
$1,582
State:
$1,595
Percentage of individuals using paid preparers for their 2004 taxes: 54.0%
Here:
54%
State:
55%
(% for various income ranges: 49.5% for AGIs below $10k, 55.6% for AGIs $10k-25k, 53.4% for AGIs $25k-50k, 54.9% for AGIs $50k-75k, 53.9% for AGIs $75k-100k, 61.3% for AGIs over 100k)
Likely homosexual households (counted as self-reported same-sex unmarried-partner households)
Lesbian couples: 0.0% of all households
Gay men: 0.2% of all households
Household received Food Stamps/SNAP in the past 12 months: 1,020 Household did not receive Food Stamps/SNAP in the past 12 months: 13,062
Women who had a birth in the past 12 months: 420 (338 now married, 81 unmarried) Women who did not have a birth in the past 12 months: 7,506 (2,869 now married, 4,651 unmarried)
Housing units in zip code 80226 with a mortgage: 4,860 (566 second mortgage, 25 home equity loan, 487 both second mortgage and home equity loan) Houses without a mortgage: 29
Median monthly owner costs for units with a mortgage: $1,988 Median monthly owner costs for units without a mortgage: $595
Residents with income below the poverty level in 2022:
This zip code:
9.7%
Whole state:
9.4%
Residents with income below 50% of the poverty level in 2022:
This zip code:
5.0%
Whole state:
4.6%
Median number of rooms in houses and condos:
Here:
6.8
State:
6.8
Median number of rooms in apartments:
Here:
3.8
State:
4.0
Notable locations in this zip code not listed on our city pages
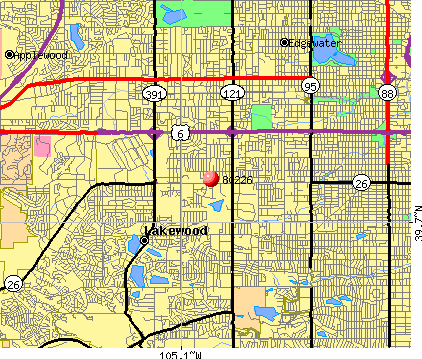
Notable locations in zip code 80226: Jefferson County Stadium (A), West Metro Fire Rescue Station 7 (B), Lakewood's Historical Belmar Village (C), National Training Center (D), Lakewood Cultural Center (E), Lakewood Police Department (F), Lakewood Civic Center (G), West Metro Fire Rescue Station 3 (H), Lakewood Municipal Court (I), United States Bureau of Reclamation Library (J), United States Bureau of Land Management Library (K), Clifton Fowler Library (L), Denver Federal Center (M), Jefferson County Public Library Belmar Branch (N). Display/hide their locations on the map
Churches in zip code 80226 include: Grace Covenant Church (A), Lakewood United Church of Christ (B), Landmark Missionary Baptist Church (C), Green Mountain Christian Church (D), Belmar Baptist Church (E), Victory Outreach Denver (F), Westwoods Community Church (G), Church on the Move (H), Alameda Hills Baptist Church (I). Display/hide their locations on the map
Parks in zip code 80226 include: Glennon Heights Park (1), Jefferson County Stadium (2), Sutherland Shire Park (3), Alemeda Park (4), Addenbrooke Park (5), Belmar Park (6), Glennon Dale Park (7), Lakewood Park (8), O'Kane Park (9). Display/hide their locations on the map
Tourist attractions (not listed on the city page) : Lakewood's Heritage Center-A 20th Century Museum (797 South Wadsworth Boulevard), Brunswick Zone-Green Mountain (Amusement & Theme Parks; 945 South Kipling Parkway).
3,104 married couples with children.
1,561 single-parent households (448 men, 1,113 women).
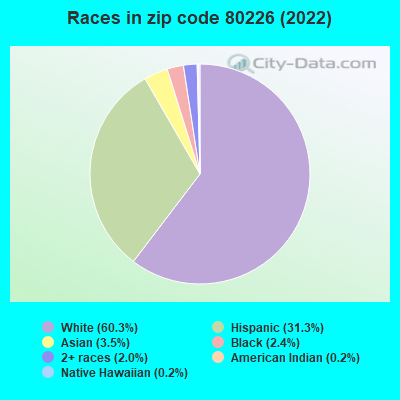
80.6% of residents of 80226 zip code speak English at home.
15.1% of residents speak Spanish at home (73% very well, 14% well, 12% not well, 2% not at all).
1.5% of residents speak other Indo-European language at home (91% very well, 9% well).
2.5% of residents speak Asian or Pacific Island language at home (54% very well, 30% well, 15% not well, 1% not at all).
0.2% of residents speak other language at home (88% very well, 12% well).
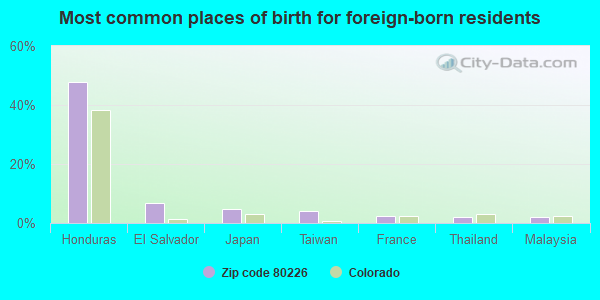
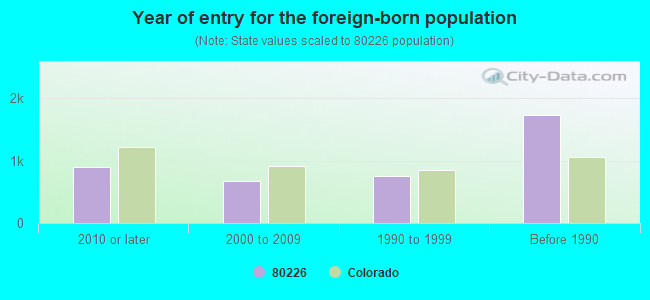
Foreign born population: 3,649 (11.2%) (52.0% of them are naturalized citizens)
Major facilities with environmental interests located in this zip code:
BELMAR ELEMENTARY SCHOOL (885 SOUTH GARRISON STREET in LAKEWOOD, CO)
(Geographic Names Information System) (National Center for Education Statistics) - STATE ID-0724 Organizations: JEFFERSON COUNTY R-1 (SCHOOL DISTRICT)
CREIGHTON MIDDLE SCHOOL (75 INDEPENDENCE STREET in LAKEWOOD, CO)
(Geographic Names Information System) (National Center for Education Statistics) - STATE ID-1976 Organizations: JEFFERSON COUNTY R-1 (SCHOOL DISTRICT)
GLENNON HEIGHTS ELEMENTARY SCHOOL (11025 WEST GLENNON DRIVE in LAKEWOOD, CO)
(Geographic Names Information System) (National Center for Education Statistics) - STATE ID-3450 Organizations: JEFFERSON COUNTY R-1 (SCHOOL DISTRICT)
ASP INCORPORATED (401 HARLAN STREET in LAKEWOOD, CO)
(Integrated Compliance Information System) - ICIS-08-1991-0151, FORMAL ENFORCEMENT ACTION COMPLIANCE ACTIVITY (Tracking inspections of insecticide, fungicide, and rodenticide, and toxic substances) Business SIC classification: BUSINESS SERVICES Alternative names: ASP INC/KEENSBURG ELEMENTARY SCHOOL
AMOCO GAS STA NO 12014 (7750 WEST JEWELL AVENUE in LAKEWOOD, CO)
AIR MINOR (AIRS/AFS) (Resource Conservation and Recovery Act (tracking hazardous waste)) Business SIC classification: GASOLINE SERVICE STATIONS Organizations: AM/CAP INC (CONTACT/OWNER)
Alternative names: AMOCO OIL 12014
AMOCO GAS STA NO 24501 (931 S KIPLING STREET in LAKEWOOD, CO)
AIR MINOR (AIRS/AFS) CRITERIA AND HAZARDOUS AIR POLLUTANT INVENTORY (Inventory of air pollution sources) Conditionally Exempt Small Quantity Generators, less than 100 kg/month of hazardous waste (Resource Conservation and Recovery Act (tracking hazardous waste)) - notification Business SIC classification: GASOLINE SERVICE STATIONS Organizations: GRICK ENTERPRISES (CONTACT/OWNER)
Alternative names: AMOCO GAS STATION NUMBER 24501, AMOCO OIL 24501
FURNITURE REFINISHING INC (6719 WEST MISSISSIPPI AVENUE in LAKEWOOD, CO)
AIR MINOR (AIRS/AFS) CRITERIA AND HAZARDOUS AIR POLLUTANT INVENTORY (Inventory of air pollution sources) Conditionally Exempt Small Quantity Generators, less than 100 kg/month of hazardous waste (Resource Conservation and Recovery Act (tracking hazardous waste)) - notification Business SIC and NAICS classification: REUPHOLSTERY AND FURNITURE REPAIR Organizations: NORMAN VAN HEUKELEM (CONTACT/OWNER)
JEFFERSON COUNTY DEPT OF HEALTH & ENV (260 S KIPLING ST in LAKEWOOD, CO)
AIR MONITORING SITE (Airborne pollution emission tracking) (Resource Conservation and Recovery Act (tracking hazardous waste))
CHIC CLNRS (145 SOUTH SHERIDAN in LAKEWOOD, CO)
AIR MINOR (AIRS/AFS) Conditionally Exempt Small Quantity Generators, less than 100 kg/month of hazardous waste (Resource Conservation and Recovery Act (tracking hazardous waste)) - notification Business SIC classification: DRYCLEANING PLANTS, EXCEPT RUG CLEANING Organizations: NORWOOD CLEANERS INC (CONTACT/OWNER)
Alternative names: PRIM CLEANERS
BC PRINTING (IN JEFFCO) (264 SOUTH PIERCE STREET in LAKEWOOD, CO)
AIR MINOR (AIRS/AFS) Conditionally Exempt Small Quantity Generators, less than 100 kg/month of hazardous waste (Resource Conservation and Recovery Act (tracking hazardous waste)) - notification Business SIC classification: COMMERCIAL PRINTING, LITHOGRAPHIC Organizations: BRIGETTE & BILL COLLETT (CONTACT/OWNER)
Alternative names: BC PRINTING INCORPORATED
AGFA/VILLA ITALIA UNIT H-22 (7200 WEST ALAMEDA UNIT H-22 in LAKEWOOD, CO)
(Resource Conservation and Recovery Act (tracking hazardous waste)) Organizations: EQUITABLE LIFE ASSURANCE (CONTACT/OWNER)
HARLAN INVESTMENT INC - 1ST AVE LAKEWOOD (6000 W 1ST AVE in LAKEWOOD, CO)
AIR MINOR (AIRS/AFS) CRITERIA AND HAZARDOUS AIR POLLUTANT INVENTORY (Inventory of air pollution sources) Business SIC classification: GASOLINE SERVICE STATIONS Alternative names: AB PETROLEUM INCORPORATED NUMBER 26
BRIDGESTONE FIRSTONE INC (7200 WEST ALEMEDA AVENUE in LAKEWOOD, CO)
(Resource Conservation and Recovery Act (tracking hazardous waste)) Organizations: EQUITABLE LIFE ASSURANCE SOCIER (CONTACT/OWNER)
Housing units lacking complete plumbing facilities: 0.4% Housing units lacking complete kitchen facilities: 1.6%
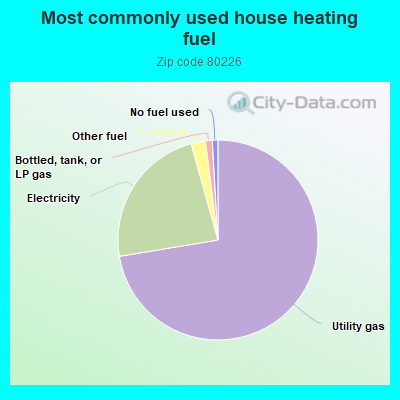
72.1%Utility gas
23.2%Electricity
2.3%Other fuel
1.1%Bottled, tank, or LP gas
0.9%No fuel used
Population in 1990: 13,675. Population change in the 1990s: +16,272 (+119.0%).
Place of birth for U.S.-born residents:
This state: 15,408
Northeast: 1,381
Midwest: 4,801
South: 3,655
West: 3,123
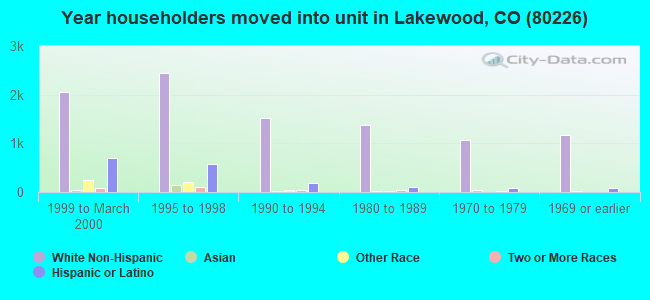
51% of the 80226 zip code residents lived in the same house 5 years ago. Out of people who lived in different houses, 40% lived in this county. Out of people who lived in different counties, 50% lived in Colorado.
84% of the 80226 zip code residents lived in the same house 1 year ago. Out of people who lived in different houses, 35% moved from this county. Out of people who lived in different houses, 45% moved from different county within same state. Out of people who lived in different houses, 16% moved from different state. Out of people who lived in different houses, 4% moved from abroad.
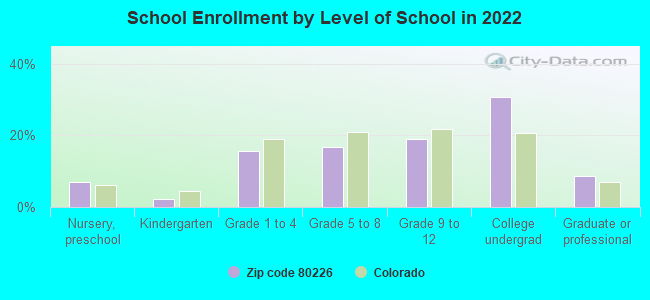
Private vs. public school enrollment:
Students in private schools in grades 1 to 8 (elementary and middle school): 60
Here:
2.7%
Colorado:
11.4%
Students in private schools in grades 9 to 12 (high school): 30
Here:
2.3%
Colorado:
8.5%
Students in private undergraduate colleges: 749
Here:
34.8%
Colorado:
14.0%
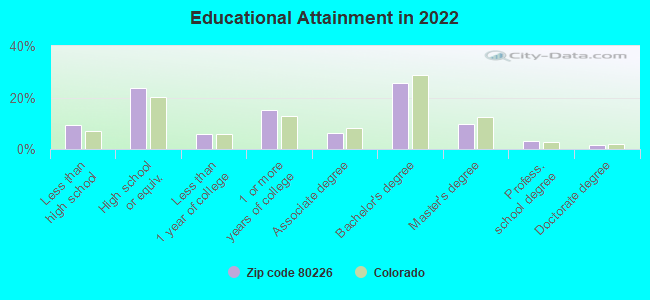
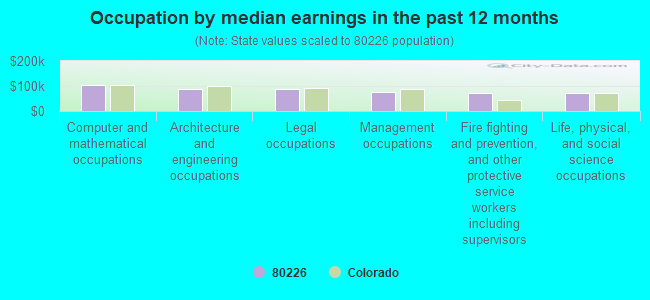
Occupation by median earnings in the past 12 months ($)
105,622Computer and mathematical occupations
88,324Architecture and engineering occupations
86,118Legal occupations
77,062Management occupations
70,947Fire fighting and prevention, and other protective service workers including supervisors
70,897Life, physical, and social science occupations
Companies with federal contracts located in this zip code:
JEFF KNIGHT (1075 S YUKON ST in LAKEWOOD, CO; small business) : $842,858 in 3 contractsfrom 2004 to 2005
$696,270 with Army for Tile, Brick, and Block. Taking place in CA. Signed on 2005-09-22. Completion date: 2006-01-23.
$84,565 with Army for Roofing and Siding Materials. Taking place in CA. Signed on 2005-03-01. Completion date: 2005-03-18.
$62,023 with Army for Miscellaneous Construction Materials. Taking place in CA. Signed on 2004-05-26. Completion date: 2004-06-11.
GALILEO SHIPYARDS, INC (10905 W OHIO DR in DENVER, CO; small business)
$23,333 with Department of Defense for Other Defense -- Advanced Development (R&D). Signed on 2003-08-14. Completion date: 2004-02-07.
LAKEWOOD, CITY OF (480 S ALLISON PARKWAY in DENVER, CO)
$2,572 with Army for Lease or Rental of Equipment -- Musical Instruments, Phonographs, and Home-Type Radios. Signed on 2004-11-05. Completion date: 2004-11-07.
Top industries in this zip code by the number of employees in 2005:
Administrative and Support and Waste Management and Remediation Services: Security Guards and Patrol Services (500-999 employees: 1 establishment, 250-499 employees: 1 establishment, 20-49 employees: 1 establishment)
2002 - 2018 National Fire Incident Reporting System (NFIRS) incidents
Based on the data from the years 2002 - 2018 the average number of fire incidents per year is 71. The highest number of reported fire incidents - 105 took place in 2018, and the least - 48 in 2007. The data has an increasing trend.
When looking into fire subcategories, the most reports belonged to: Structure Fires (41.0%), and Outside Fires (34.8%).
Fire incident types reported to NFIRS in Zip Code 80226


 Nearest zip codes: 80232, 80214, 80215, 80227, 80219, 80033.
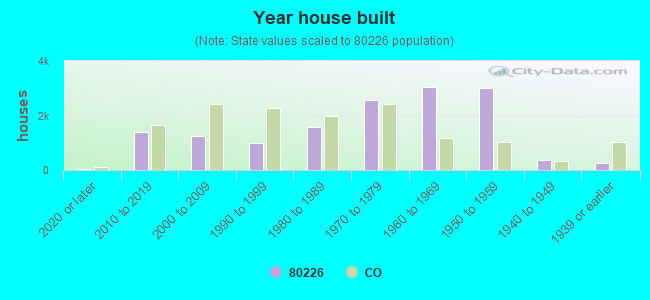


 Based on the data from the years 2002 - 2018 the average number of fire incidents per year is 71. The highest number of reported fire incidents - 105 took place in 2018, and the least - 48 in 2007. The data has an increasing trend.
 When looking into fire subcategories, the most reports belonged to: Structure Fires (41.0%), and Outside Fires (34.8%).