Estimated zip code population in 2022: 62,743 Zip code population in 2010: 52,861 Zip code population in 2000: 40,542
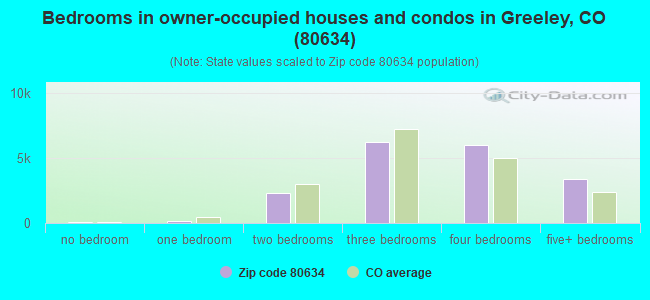
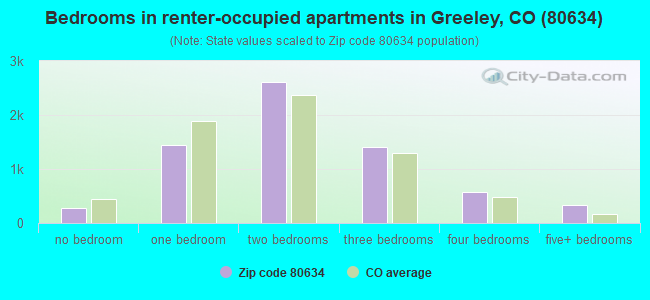
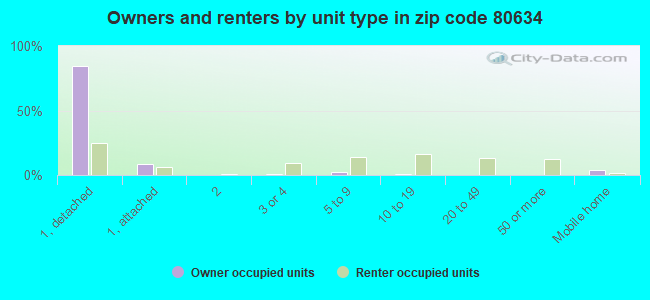
Houses and condos: 25,845 Renter-occupied apartments: 6,659
% of renters here:
27%
State:
34%
March 2022 cost of living index in zip code 80634: 102.5 (near average, U.S. average is 100)
Land area: 37.3 sq. mi. Water area: 0.1 sq. mi.
Population density: 1,683 people per square mile
(low).
OSM Map
General Map
Google Map
MSN Map
OSM Map
General Map
Google Map
MSN Map
OSM Map
General Map
Google Map
MSN Map
OSM Map
General Map
Google Map
MSN Map
Please wait while loading the map...
Real estate property taxes paid for housing units in 2022:
This zip code:
0.4% ($1,898)
Colorado:
0.5% ($2,422)
Median real estate property taxes paid for housing units with mortgages in 2022: $1,946 (0.4%) Median real estate property taxes paid for housing units with no mortgage in 2022: $1,813 (0.4%)
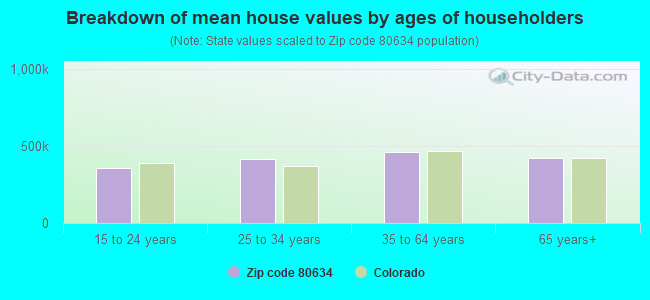
Estimated median house/condo value in 2022: $428,961
80634:
$428,961
Colorado:
$531,100
According to our research of Colorado and other state lists, there were 96 registered sex offenders living in 80634 zip code as of April 26, 2024. The ratio of all residents to sex offenders in zip code 80634 is 587 to 1. The ratio of registered sex offenders to all residents in this zip code is lower than the state average.
Median resident age:
This zip code:
38.9 years
Colorado median age:
37.7 years
Average household size:
This zip code:
2.5 people
Colorado:
2.4 people
Averages for the 2020 tax year for zip code 80634, filed in 2021:
Average Adjusted Gross Income (AGI) in 2020: $68,939 (Individual Income Tax Returns)
Here:
$68,939
State:
$89,260
Salary/wage: $55,951 (reported on 83.7% of returns)
Here:
$55,951
State:
$70,330
(% of AGI for various income ranges: 1281.3% for AGIs below $25k, 3766.7% for AGIs $25k-50k, 6692.2% for AGIs $50k-75k, 9809.7% for AGIs $75k-100k, 18467.5% for AGIs $100k-200k, 69725.5% for AGIs over 200k)
Taxable interest for individuals: $1,890 (reported on 26.5% of returns)
This zip code:
$1,890
Colorado:
$2,176
(% of AGI for various income ranges: 17.4% for AGIs below $25k, 18.2% for AGIs $25k-50k, 33.8% for AGIs $50k-75k, 49.3% for AGIs $75k-100k, 128.7% for AGIs $100k-200k, 2704.8% for AGIs over 200k)
Ordinary dividends: $4,988 (reported on 16.6% of returns)
Here:
$4,988
State:
$8,820
(% of AGI for various income ranges: 21.1% for AGIs below $25k, 27.3% for AGIs $25k-50k, 68.2% for AGIs $50k-75k, 101.1% for AGIs $75k-100k, 299.8% for AGIs $100k-200k, 3600.3% for AGIs over 200k)
Net capital gain/loss in AGI: +$18,067 (reported on 15.8% of returns)
Here:
+$18,067
State:
+$37,276
(% of AGI for various income ranges: 16.6% for AGIs below $25k, 22.3% for AGIs $25k-50k, 69.5% for AGIs $50k-75k, 142.8% for AGIs $75k-100k, 581.4% for AGIs $100k-200k, 23004.5% for AGIs over 200k)
Profit/loss from business: +$10,390 (reported on 15.8% of returns)
Here:
+$10,390
State:
+$15,295
(% of AGI for various income ranges: 89.8% for AGIs below $25k, 120.4% for AGIs $25k-50k, 205.7% for AGIs $50k-75k, 313.4% for AGIs $75k-100k, 497.7% for AGIs $100k-200k, 3646.6% for AGIs over 200k)
Taxable individual retirement arrangement distribution: $19,007 (reported on 9.4% of returns)
80634:
$19,007
Colorado:
$23,785
(% of AGI for various income ranges: 57.2% for AGIs below $25k, 92.7% for AGIs $25k-50k, 169.4% for AGIs $50k-75k, 333.5% for AGIs $75k-100k, 802.9% for AGIs $100k-200k, 4106.9% for AGIs over 200k)
Self-employed (Keogh) retirement plans: $17,650 (reported on 0.4% of returns)
80634:
$17,650
Colorado:
$23,633
(% of AGI for various income ranges: 5.5% for AGIs $50k-75k, 20.7% for AGIs $100k-200k, 476.2% for AGIs over 200k)
Total itemized deductions: $31,013 (reported on 9.3% of returns)
Here:
$31,013
State:
$35,141
(% of AGI for various income ranges: 48.2% for AGIs below $25k, 104.8% for AGIs $25k-50k, 373.3% for AGIs $50k-75k, 565.9% for AGIs $75k-100k, 1135.4% for AGIs $100k-200k, 8714.5% for AGIs over 200k)
Charity contributions: $10,786 (reported on 6.9% of returns)
Here:
$10,786
State:
$12,103
(% of AGI for various income ranges: 3.2% for AGIs below $25k, 10.8% for AGIs $25k-50k, 45.4% for AGIs $50k-75k, 91.9% for AGIs $75k-100k, 288.5% for AGIs $100k-200k, 3859.0% for AGIs over 200k)
Taxes paid: $6,435 (reported on 9.3% of returns)
80634:
$6,435
State:
$7,710
(% of AGI for various income ranges: 5.1% for AGIs below $25k, 15.2% for AGIs $25k-50k, 68.2% for AGIs $50k-75k, 128.1% for AGIs $75k-100k, 281.2% for AGIs $100k-200k, 1690.7% for AGIs over 200k)
Earned income credit: $2,224 (reported on 13.1% of returns)
Here:
$2,224
State:
$2,053
(% of AGI for various income ranges: 84.6% for AGIs below $25k, 60.3% for AGIs $25k-50k, 1.0% for AGIs $50k-75k)
Percentage of individuals using paid preparers for their 2020 taxes: 93.9%
Here:
94%
State:
93%
(% for various income ranges: 91.8% for AGIs below $25k, 95.0% for AGIs $25k-50k, 94.1% for AGIs $50k-75k, 94.2% for AGIs $75k-100k, 94.8% for AGIs $100k-200k, 95.7% for AGIs over 200k)
Averages for the 2012 tax year for zip code 80634, filed in 2013:
Average Adjusted Gross Income (AGI) in 2012: $62,200 (Individual Income Tax Returns)
Here:
$62,200
State:
$69,103
Salary/wage: $48,982 (reported on 85.0% of returns)
Here:
$48,982
State:
$54,794
(% of AGI for various income ranges: 78.7% for AGIs below $25k, 79.5% for AGIs $25k-50k, 75.5% for AGIs $50k-75k, 76.5% for AGIs $75k-100k, 72.6% for AGIs $100k-200k, 36.2% for AGIs over 200k)
Taxable interest for individuals: $2,279 (reported on 32.8% of returns)
This zip code:
$2,279
Colorado:
$1,971
(% of AGI for various income ranges: 1.3% for AGIs below $25k, 0.6% for AGIs $25k-50k, 0.7% for AGIs $50k-75k, 0.6% for AGIs $75k-100k, 0.7% for AGIs $100k-200k, 2.9% for AGIs over 200k)
Ordinary dividends: $4,600 (reported on 19.9% of returns)
Here:
$4,600
State:
$7,140
(% of AGI for various income ranges: 1.4% for AGIs below $25k, 0.9% for AGIs $25k-50k, 0.9% for AGIs $50k-75k, 1.0% for AGIs $75k-100k, 1.2% for AGIs $100k-200k, 2.9% for AGIs over 200k)
Net capital gain/loss in AGI: +$22,075 (reported on 16.9% of returns)
Here:
+$22,075
State:
+$23,009
(% of AGI for various income ranges: 0.3% for AGIs $25k-50k, 0.6% for AGIs $50k-75k, 0.5% for AGIs $75k-100k, 1.4% for AGIs $100k-200k, 24.3% for AGIs over 200k)
Profit/loss from business: +$12,480 (reported on 15.8% of returns)
Here:
+$12,480
State:
+$13,514
(% of AGI for various income ranges: 5.7% for AGIs below $25k, 3.1% for AGIs $25k-50k, 2.6% for AGIs $50k-75k, 2.0% for AGIs $75k-100k, 3.0% for AGIs $100k-200k, 3.8% for AGIs over 200k)
Taxable individual retirement arrangement distribution: $13,757 (reported on 11.3% of returns)
80634:
$13,757
Colorado:
$17,927
(% of AGI for various income ranges: 3.5% for AGIs below $25k, 2.7% for AGIs $25k-50k, 2.3% for AGIs $50k-75k, 2.8% for AGIs $75k-100k, 3.0% for AGIs $100k-200k, 1.3% for AGIs over 200k)
Self-employment retirement plans: $15,356 (reported on 0.7% of returns)
80634:
$15,356
Colorado:
$19,483
(% of AGI for various income ranges: 0.2% for AGIs $50k-75k, 0.2% for AGIs $100k-200k, 0.4% for AGIs over 200k)
Total itemized deductions: $21,397 (19% of AGI, reported on 35.6% of returns)
Here:
$21,397
State:
$24,621
Here:
19.1% of AGI
State:
18.5% of AGI
(% of AGI for various income ranges: 10.0% for AGIs below $25k, 10.1% for AGIs $25k-50k, 12.8% for AGIs $50k-75k, 13.8% for AGIs $75k-100k, 14.4% for AGIs $100k-200k, 10.4% for AGIs over 200k)
Charity contributions: $4,292 (reported on 29.6% of returns)
Here:
$4,292
State:
$4,449
(% of AGI for various income ranges: 0.9% for AGIs below $25k, 1.2% for AGIs $25k-50k, 1.9% for AGIs $50k-75k, 2.0% for AGIs $75k-100k, 2.6% for AGIs $100k-200k, 2.5% for AGIs over 200k)
Taxes paid: $5,997 (reported on 35.5% of returns)
80634:
$5,997
State:
$7,641
(% of AGI for various income ranges: 1.3% for AGIs below $25k, 1.6% for AGIs $25k-50k, 2.6% for AGIs $50k-75k, 3.3% for AGIs $75k-100k, 4.2% for AGIs $100k-200k, 5.0% for AGIs over 200k)
Earned income credit: $2,181 (reported on 15.9% of returns)
Here:
$2,181
State:
$2,095
(% of AGI for various income ranges: 5.6% for AGIs below $25k, 1.2% for AGIs $25k-50k)
Percentage of individuals using paid preparers for their 2012 taxes: 54.9%
Here:
55%
State:
49%
(% for various income ranges: 47.7% for AGIs below $25k, 53.3% for AGIs $25k-50k, 58.3% for AGIs $50k-75k, 58.2% for AGIs $75k-100k, 64.2% for AGIs $100k-200k, 85.1% for AGIs over 200k)
Averages for the 2004 tax year for zip code 80634, filed in 2005:
Average Adjusted Gross Income (AGI) in 2004: $54,141 (Individual Income Tax Returns)
Here:
$54,141
State:
$55,014
Salary/wage: $43,807 (reported on 85.5% of returns)
Here:
$43,807
State:
$46,010
(% of AGI for various income ranges: 123.1% for AGIs below $10k, 79.4% for AGIs $10k-25k, 81.1% for AGIs $25k-50k, 80.8% for AGIs $50k-75k, 81.2% for AGIs $75k-100k, 51.7% for AGIs over 100k)
Taxable interest for individuals: $2,462 (reported on 46.4% of returns)
This zip code:
$2,462
Colorado:
$2,127
(% of AGI for various income ranges: 8.3% for AGIs below $10k, 2.7% for AGIs $10k-25k, 1.7% for AGIs $25k-50k, 1.3% for AGIs $50k-75k, 1.3% for AGIs $75k-100k, 2.7% for AGIs over 100k)
Taxable dividends: $2,878 (reported on 26.8% of returns)
Here:
$2,878
State:
$3,782
(% of AGI for various income ranges: 4.6% for AGIs below $10k, 1.3% for AGIs $10k-25k, 0.9% for AGIs $25k-50k, 0.8% for AGIs $50k-75k, 0.8% for AGIs $75k-100k, 2.0% for AGIs over 100k)
Net capital gain/loss: +$19,980 (reported on 22.8% of returns)
Here:
+$19,980
State:
+$17,882
(% of AGI for various income ranges: 6.3% for AGIs below $10k, 0.3% for AGIs $10k-25k, 0.6% for AGIs $25k-50k, 1.0% for AGIs $50k-75k, 1.3% for AGIs $75k-100k, 18.8% for AGIs over 100k)
Profit/loss from business: +$11,955 (reported on 17.7% of returns)
Here:
+$11,955
State:
+$11,247
(% of AGI for various income ranges: 5.2% for AGIs below $10k, 4.2% for AGIs $10k-25k, 3.1% for AGIs $25k-50k, 3.2% for AGIs $50k-75k, 3.1% for AGIs $75k-100k, 4.8% for AGIs over 100k)
IRA payment deduction: $2,967 (reported on 2.6% of returns)
80634:
$2,967
Colorado:
$2,947
(% of AGI for various income ranges: 0.3% for AGIs below $10k, 0.2% for AGIs $10k-25k, 0.2% for AGIs $25k-50k, 0.2% for AGIs $50k-75k, 0.1% for AGIs $75k-100k, 0.1% for AGIs over 100k)
Self-employed pension: $13,370 (reported on 1.1% of returns)
Here:
$13,370
Colorado:
$13,653
(% of AGI for various income ranges: 0.1% for AGIs $25k-50k, 0.1% for AGIs $50k-75k, 0.3% for AGIs $75k-100k, 0.5% for AGIs over 100k)
Total itemized deductions: $19,055 (21% of AGI, reported on 44.7% of returns)
Here:
$19,055
State:
$20,560
Here:
21.3% of AGI
State:
21.4% of AGI
(% of AGI for various income ranges: 20.4% for AGIs below $10k, 13.0% for AGIs $10k-25k, 16.5% for AGIs $25k-50k, 18.7% for AGIs $50k-75k, 18.5% for AGIs $75k-100k, 13.5% for AGIs over 100k)
Charity contributions deductions: $4,205 (4% of AGI, reported on 38.6% of returns)
Here:
$4,205
State:
$3,518
Here:
4.4% of AGI
State:
3.4% of AGI
(% of AGI for various income ranges: 1.2% for AGIs below $10k, 1.3% for AGIs $10k-25k, 1.8% for AGIs $25k-50k, 2.4% for AGIs $50k-75k, 2.7% for AGIs $75k-100k, 4.2% for AGIs over 100k)
Total tax: $8,379 (reported on 77.9% of returns)
80634:
$8,379
State:
$9,173
(% of AGI for various income ranges: 3.9% for AGIs below $10k, 4.2% for AGIs $10k-25k, 6.6% for AGIs $25k-50k, 8.2% for AGIs $50k-75k, 10.0% for AGIs $75k-100k, 18.2% for AGIs over 100k)
Earned income credit: $1,658 (reported on 12.2% of returns)
Here:
$1,658
State:
$1,595
Percentage of individuals using paid preparers for their 2004 taxes: 60.6%
Here:
61%
State:
55%
(% for various income ranges: 50.1% for AGIs below $10k, 59.5% for AGIs $10k-25k, 62.2% for AGIs $25k-50k, 63.3% for AGIs $50k-75k, 62.2% for AGIs $75k-100k, 71.8% for AGIs over 100k)
Likely homosexual households (counted as self-reported same-sex unmarried-partner households)
Lesbian couples: 0.2% of all households
Gay men: 0.1% of all households
Household received Food Stamps/SNAP in the past 12 months: 2,162 Household did not receive Food Stamps/SNAP in the past 12 months: 22,641
Women who had a birth in the past 12 months: 917 (581 now married, 315 unmarried) Women who did not have a birth in the past 12 months: 13,338 (6,312 now married, 7,015 unmarried)
Housing units in zip code 80634 with a mortgage: 12,405 (1,227 second mortgage, 25 home equity loan, 1,096 both second mortgage and home equity loan) Houses without a mortgage: 217
Median monthly owner costs for units with a mortgage: $1,809 Median monthly owner costs for units without a mortgage: $555
Residents with income below the poverty level in 2022:
This zip code:
8.1%
Whole state:
9.4%
Residents with income below 50% of the poverty level in 2022:
This zip code:
4.5%
Whole state:
4.6%
Median number of rooms in houses and condos:
Here:
7.3
State:
6.8
Median number of rooms in apartments:
Here:
4.2
State:
4.0
Notable locations in this zip code not listed on our city pages
9,274 married couples with children.
2,895 single-parent households (832 men, 2,063 women).
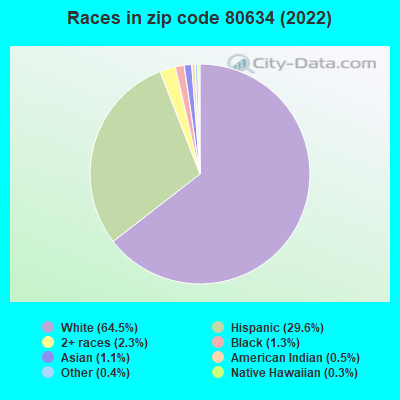
82.8% of residents of 80634 zip code speak English at home.
14.8% of residents speak Spanish at home (70% very well, 15% well, 13% not well, 3% not at all).
1.3% of residents speak other Indo-European language at home (96% very well, 4% well).
0.8% of residents speak Asian or Pacific Island language at home (73% very well, 25% well, 1% not well, 1% not at all).
0.4% of residents speak other language at home (62% very well, 26% well, 11% not at all).
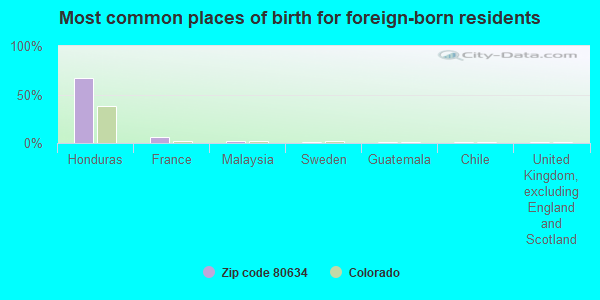
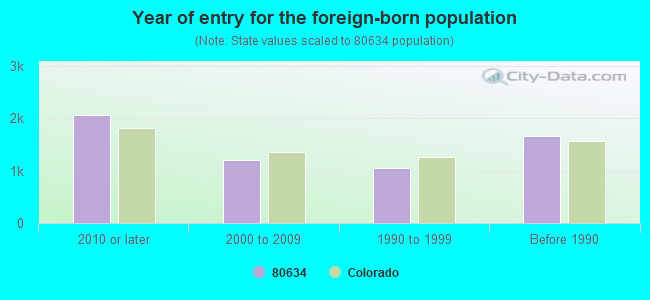
Foreign born population: 4,741 (7.6%) (46.5% of them are naturalized citizens)
Major facilities with environmental interests located in this zip code:
HEWLETT PACKARD COMPANY (700 71ST AVENUE in GREELEY, CO)
AIR MINOR (AIRS/AFS) CRITERIA AND HAZARDOUS AIR POLLUTANT INVENTORY (Inventory of air pollution sources) (Resource Conservation and Recovery Act (tracking hazardous waste)) TRI REPORTER (Tracking of toxic chemicals releasing facilities) Business SIC classification: COMPUTER STORAGE DEVICES; COMPUTER PERIPHERAL EQUIPMENT Organizations: HEWLET PACKARD (CONTACT/OWNER)
, HEWLETT-PACKARD COMPANY (CONTACT/OWNER)
Alternative names: HEWLETT-PACKARD/GREELEY DIVISION
BATAA OIL, INC. (5801 W 11TH STREET, STE 300 in GREELEY, CO)
ENFORCEMENT/COMPLIANCE ACTIVITY (Integrated Compliance Information System) - ICIS-08-2001-0004, FORMAL ENFORCEMENT ACTION (Integrated Compliance Information System) - ICIS-08-2001-0004, FORMAL ENFORCEMENT ACTION
HI TECH AUTO BODY (6310 W 10TH ST in GREELEY, CO)
STATE MASTER (Colorado database) - RCRAINFO-COD149346165, SQG (Resource Conservation and Recovery Act (tracking hazardous waste)) Organizations: STEVE PEIF (CONTACT/OWNER)
GHENT MOTOR COMPANY (2715 35TH AVE in GREELEY, CO)
STATE MASTER (Colorado database) - RCRAINFO-COD983775073, SQG Conditionally Exempt Small Quantity Generators, less than 100 kg/month of hazardous waste (Resource Conservation and Recovery Act (tracking hazardous waste)) Organizations: ROBERT D GHENT (CONTACT/OWNER)
, ROBERT K. GHENT (CONTACT/OWNER)
GARNSEY & WHEELER FORD (4901 29TH ST in GREELEY, CO)
STATE MASTER (Colorado database) - RCRAINFO-COR000015156, SQG Conditionally Exempt Small Quantity Generators, less than 100 kg/month of hazardous waste (Resource Conservation and Recovery Act (tracking hazardous waste)) Organizations: HERICK GARNSEY FAMILY PARTNERS (CONTACT/OWNER)
, HERRICK GARNSEY (CONTACT/OWNER)
Alternative names: GARNSEY & WHEELER COMPANY
ADELANTE ALTERNATIVE MIDDLE SCHOOL (2407 5TH AVENUE in GREELEY, CO)
(National Center for Education Statistics) - STATE ID-8892 Organizations: GREELEY 6 (SCHOOL DISTRICT)
FRONTIER CHARTER ACADEMY (2560 WEST 29TH STREET in GREELEY, CO)
(National Center for Education Statistics) - STATE ID-1875 Organizations: GREELEY 6 (SCHOOL DISTRICT)
BRENTWOOD MIDDLE SCHOOL (2600 24TH AVENUE COURT in GREELEY, CO)
(National Center for Education Statistics) - STATE ID-0988 Organizations: GREELEY 6 (SCHOOL DISTRICT)
CARSON TREATMENT CENTER (2350 3RD STREET ROAD in GREELEY, CO)
(National Center for Education Statistics) - STATE ID-1337 Organizations: GREELEY 6 (SCHOOL DISTRICT)
CHRISTA MC AULIFFE ELEMENTARY SCHOOL (600 51ST AVENUE in GREELEY, CO)
(National Center for Education Statistics) - STATE ID-5660 Organizations: GREELEY 6 (SCHOOL DISTRICT)
FRANKLIN MIDDLE SCHOOL (818 35TH AVENUE in GREELEY, CO)
(National Center for Education Statistics) - STATE ID-3162 Organizations: GREELEY 6 (SCHOOL DISTRICT)
AIMS COMMUNITY COLLEGE (5401 WEST 20TH STREET in GREELEY, CO)
AIR MINOR (AIRS/AFS) Conditionally Exempt Small Quantity Generators, less than 100 kg/month of hazardous waste (Resource Conservation and Recovery Act (tracking hazardous waste)) - notification Business SIC classification: TOP, BODY, AND UPHOLSTERY REPAIR SHOPS AND PAINT SHOPS Organizations: WELD COUNTY (CONTACT/OWNER)
Alternative names: ALMS COMMUNITY COLLEGE
AGLAND, INC. (2449 35TH AVENUE in GREELEY, CO)
AIR MINOR (AIRS/AFS) CRITERIA AND HAZARDOUS AIR POLLUTANT INVENTORY (Inventory of air pollution sources) Business SIC classification: GASOLINE SERVICE STATIONS
Housing units lacking complete plumbing facilities: 0.6% Housing units lacking complete kitchen facilities: 1.2%
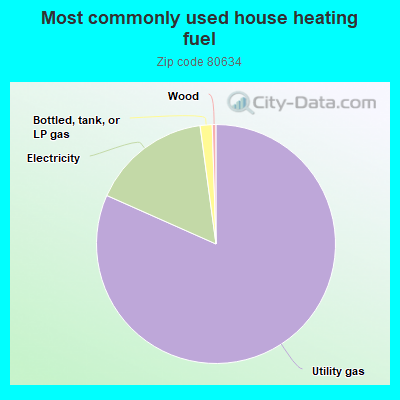
80.6%Utility gas
16.0%Electricity
1.6%Bottled, tank, or LP gas
0.5%Wood
Population in 1990: 14,100. Population change in the 1990s: +26,442 (+187.5%).
Place of birth for U.S.-born residents:
This state: 33,021
Northeast: 2,126
Midwest: 8,843
South: 5,615
West: 7,141
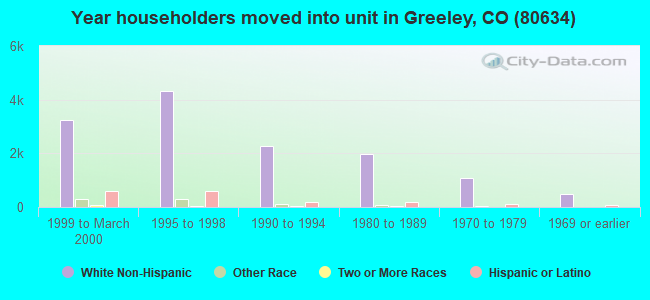
45% of the 80634 zip code residents lived in the same house 5 years ago. Out of people who lived in different houses, 61% lived in this county. Out of people who lived in different counties, 50% lived in Colorado.
89% of the 80634 zip code residents lived in the same house 1 year ago. Out of people who lived in different houses, 50% moved from this county. Out of people who lived in different houses, 26% moved from different county within same state. Out of people who lived in different houses, 22% moved from different state. Out of people who lived in different houses, 3% moved from abroad.
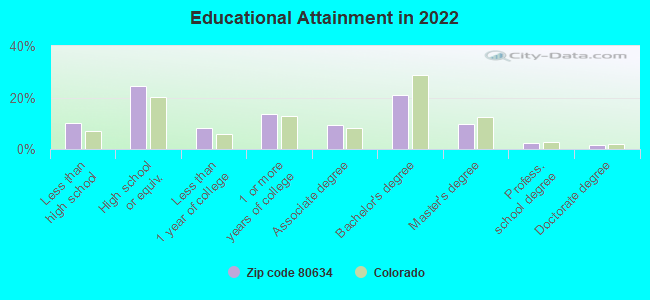
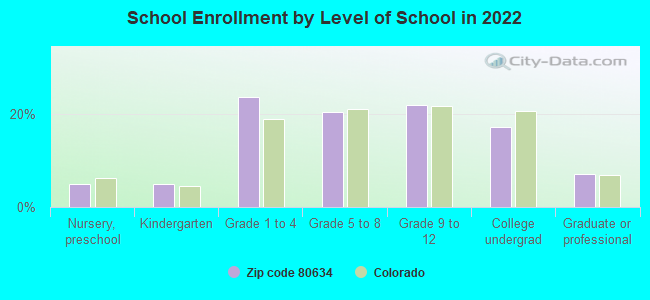
Private vs. public school enrollment:
Students in private schools in grades 1 to 8 (elementary and middle school): 676
Here:
10.8%
Colorado:
11.4%
Students in private schools in grades 9 to 12 (high school): 280
Here:
9.0%
Colorado:
8.5%
Students in private undergraduate colleges: 458
Here:
18.7%
Colorado:
14.0%
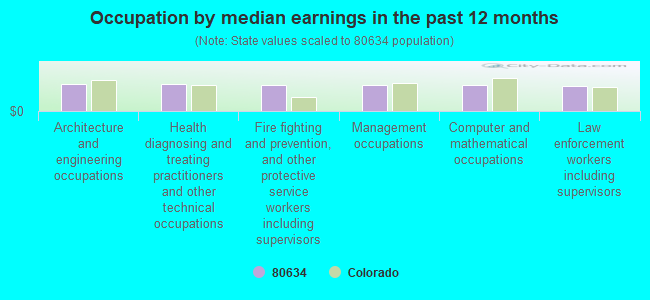
Occupation by median earnings in the past 12 months ($)
80,834Architecture and engineering occupations
80,581Health diagnosing and treating practitioners and other technical occupations
78,474Fire fighting and prevention, and other protective service workers including supervisors
77,241Management occupations
76,803Computer and mathematical occupations
74,391Law enforcement workers including supervisors
Companies with federal contracts located in this zip code (GREELEY, CO):
SWIFT & COMPANY (1770 PROMONTORY CIRCLE) : $84,062,567 in 92 contractsfrom 2001 to 2006
Contracts for Meat, Poultry, and Fish, Non-Food Items For Resale, Food Items For Resale by Defense Commissary Agency, Department of Defense, Agricultural Marketing Service, Bureau of Prisoners/Federal Prison System, and others Signed by year:2000: $0; 2001: $114,434; 2002: $315,157; 2003: $6,372,135; 2004: $23,922,493; 2005: $39,917,551; 2006: $13,420,797.
Biggest contracts:
$15,068,872 with Defense Commissary Agency for Meat, Poultry, and Fish. Signed on 2005-10-01. Completion date: 2005-11-30.
$4,485,914, same as above.Signed on 2004-10-01. Completion date: 2005-03-31.
$3,648,130, same as above.Signed on 2003-10-01. Completion date: 2004-02-29.
$3,289,357, same as above.Signed on 2004-10-01. Completion date: 2005-02-28.
MATTOX, COLLIE (3184 51ST AVE; small business) : $65,741 in 24 contractsfrom 2000 to 2006
Contracts for Recreation Site Maintenance Services (non-construction) by Army, U.S. Army Corps of Engineers - civil program financing only Signed by year:2000: $3,744; 2001: $5,022; 2002: $0; 2003: $4,345; 2004: $18,910; 2005: $24,680; 2006: $9,040.
Biggest contracts:
$9,040 with Army for Recreation Site Maintenance Services (non-construction). Signed on 2006-03-03. Completion date: 2006-10-01.
$6,105 with U.S. Army Corps of Engineers - civil program financing only for Recreation Site Maintenance Services (non-construction). Signed on 2005-02-25. Completion date: 2005-09-30.
$6,105 with Army for Recreation Site Maintenance Services (non-construction). Signed on 2005-02-25. Completion date: 2005-09-30.
$6,105, same as above.Signed on 2004-02-25. Completion date: 2004-09-30.
EZID LLC (4412 W 4TH ST RD; small business) : $30,584 in 3 contractsfrom 2004 to 2006
$16,524 with Army for Miscellaneous Electrical and Electronic Components. Taking place in KS. Signed on 2005-03-31. Completion date: 2005-04-22.
$9,998 with U.S. Fish and Wildlife Service for Physical Sciences -- Basic Research (R&D). Taking place in AR. Signed on 2004-09-21. Completion date: 2004-10-22.
$4,062 with Geological Survey for Electrical and Electronic Properties Measuring and Testing Instruments. Signed on 2006-02-10. Completion date: 2006-03-01.
CORAGGIOS ITALIAN RESTAURANT (920 54TH AVE #200; small business)
$21,616 with Army for Food Services. Signed on 2005-09-09. Completion date: 2006-08-31.
G H JOHNSON & ASSOCIATES, INC (3027 69TH AVENUE PLACE; small business)
$17,024 with Army for Batteries, Nonrechargeable. Signed on 2003-01-25. Completion date: 2003-01-31.
Top industries in this zip code by the number of employees in 2005:
2002 - 2018 National Fire Incident Reporting System (NFIRS) incidents
According to the data from the years 2002 - 2018 the average number of fires per year is 97. The highest number of reported fire incidents - 142 took place in 2011, and the least - 6 in 2014. The data has a decreasing trend.
When looking into fire subcategories, the most reports belonged to: Outside Fires (43.5%), and Structure Fires (31.8%).
Fire incident types reported to NFIRS in Zip Code 80634

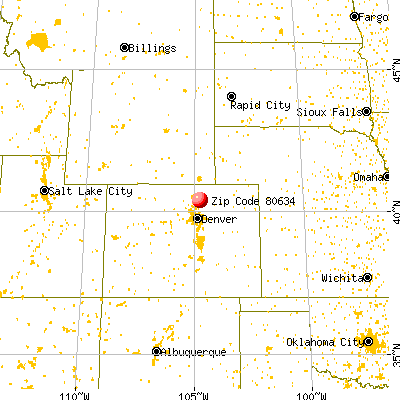


 Nearest zip codes: 80620, 80543, 80623, 80631, 80546, 80550.
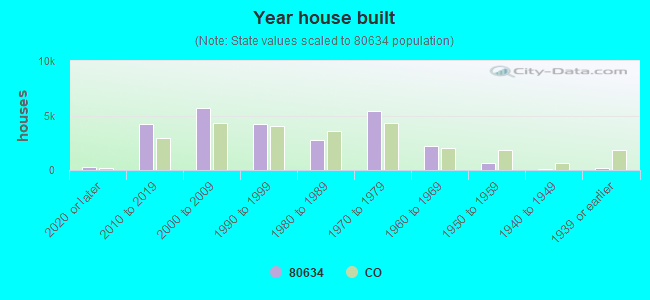


 According to the data from the years 2002 - 2018 the average number of fires per year is 97. The highest number of reported fire incidents - 142 took place in 2011, and the least - 6 in 2014. The data has a decreasing trend.
 When looking into fire subcategories, the most reports belonged to: Outside Fires (43.5%), and Structure Fires (31.8%).