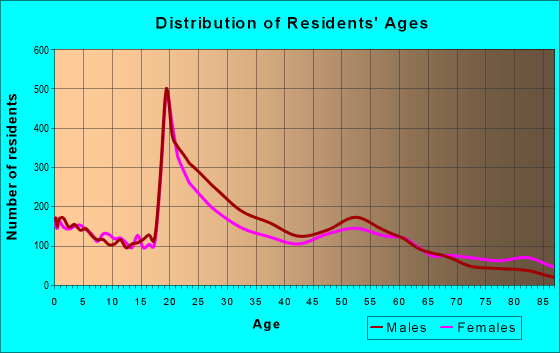
Estimated zip code population in 2022: 24,285 Zip code population in 2010: 23,465 Zip code population in 2000: 20,743
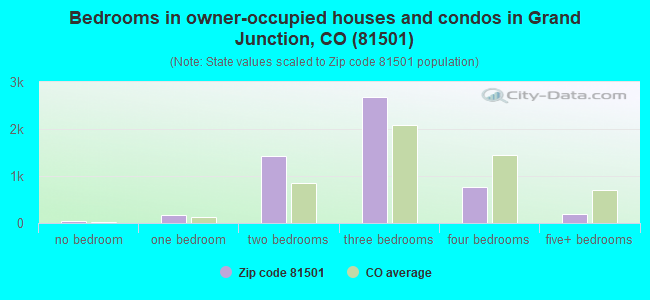
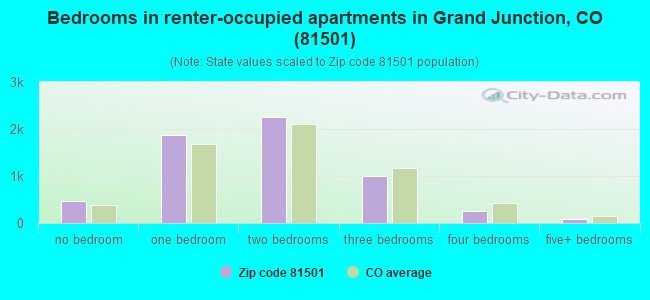
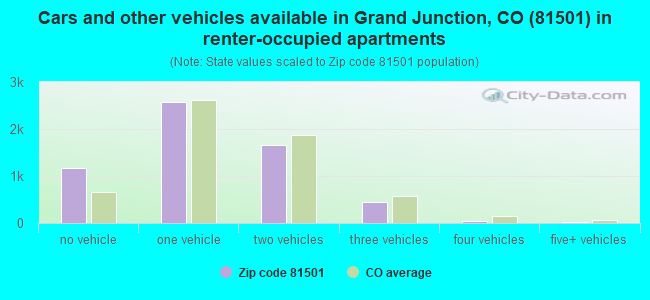
Houses and condos: 11,769 Renter-occupied apartments: 5,929
% of renters here:
53%
State:
34%
March 2022 cost of living index in zip code 81501: 94.7 (less than average, U.S. average is 100)
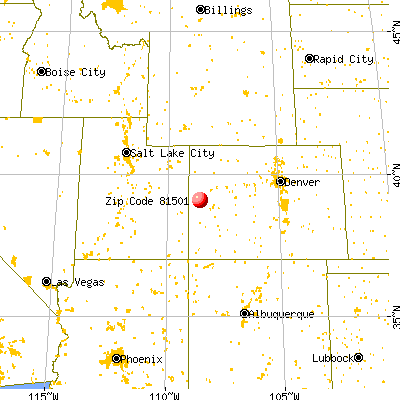
Land area: 7.9 sq. mi. Water area: 0.2 sq. mi.
Population density: 3,056 people per square mile
(average).
OSM Map
General Map
Google Map
MSN Map
OSM Map
General Map
Google Map
MSN Map
OSM Map
General Map
Google Map
MSN Map
OSM Map
General Map
Google Map
MSN Map
Please wait while loading the map...
Real estate property taxes paid for housing units in 2022:
This zip code:
0.4% ($1,129)
Colorado:
0.5% ($2,422)
Median real estate property taxes paid for housing units with mortgages in 2022: $1,206 (0.4%) Median real estate property taxes paid for housing units with no mortgage in 2022: $1,019 (0.4%)
Averages for the 2020 tax year for zip code 81501, filed in 2021:
Average Adjusted Gross Income (AGI) in 2020: $42,894 (Individual Income Tax Returns)
Here:
$42,894
State:
$89,260
Salary/wage: $37,054 (reported on 84.7% of returns)
Here:
$37,054
State:
$70,330
(% of AGI for various income ranges: 1237.7% for AGIs below $25k, 3737.5% for AGIs $25k-50k, 6610.9% for AGIs $50k-75k, 10333.0% for AGIs $75k-100k, 18497.5% for AGIs $100k-200k, 67656.7% for AGIs over 200k)
Taxable interest for individuals: $937 (reported on 18.5% of returns)
This zip code:
$937
Colorado:
$2,176
(% of AGI for various income ranges: 8.7% for AGIs below $25k, 13.5% for AGIs $25k-50k, 40.7% for AGIs $50k-75k, 23.2% for AGIs $75k-100k, 106.8% for AGIs $100k-200k, 1066.7% for AGIs over 200k)
Ordinary dividends: $3,450 (reported on 11.9% of returns)
Here:
$3,450
State:
$8,820
(% of AGI for various income ranges: 16.0% for AGIs below $25k, 22.4% for AGIs $25k-50k, 68.4% for AGIs $50k-75k, 142.2% for AGIs $75k-100k, 321.8% for AGIs $100k-200k, 2743.3% for AGIs over 200k)
Net capital gain/loss in AGI: +$16,241 (reported on 11.6% of returns)
Here:
+$16,241
State:
+$37,276
(% of AGI for various income ranges: 7.2% for AGIs below $25k, 17.1% for AGIs $25k-50k, 141.3% for AGIs $50k-75k, 143.2% for AGIs $75k-100k, 1233.2% for AGIs $100k-200k, 40320.0% for AGIs over 200k)
Profit/loss from business: +$10,224 (reported on 12.6% of returns)
Here:
+$10,224
State:
+$15,295
(% of AGI for various income ranges: 90.1% for AGIs below $25k, 126.2% for AGIs $25k-50k, 215.9% for AGIs $50k-75k, 384.0% for AGIs $75k-100k, 646.1% for AGIs $100k-200k, 4386.7% for AGIs over 200k)
Taxable individual retirement arrangement distribution: $15,188 (reported on 6.7% of returns)
81501:
$15,188
Colorado:
$23,785
(% of AGI for various income ranges: 46.5% for AGIs below $25k, 71.3% for AGIs $25k-50k, 176.4% for AGIs $50k-75k, 274.5% for AGIs $75k-100k, 834.6% for AGIs $100k-200k, 5230.0% for AGIs over 200k)
Total itemized deductions: $26,006 (reported on 3.5% of returns)
Here:
$26,006
State:
$35,141
(% of AGI for various income ranges: 20.4% for AGIs below $25k, 55.1% for AGIs $25k-50k, 164.9% for AGIs $50k-75k, 325.0% for AGIs $75k-100k, 694.3% for AGIs $100k-200k, 7190.0% for AGIs over 200k)
Charity contributions: $9,723 (reported on 2.3% of returns)
Here:
$9,723
State:
$12,103
(% of AGI for various income ranges: 7.9% for AGIs $25k-50k, 26.8% for AGIs $50k-75k, 44.8% for AGIs $75k-100k, 170.7% for AGIs $100k-200k, 3490.0% for AGIs over 200k)
Taxes paid: $5,136 (reported on 3.4% of returns)
81501:
$5,136
State:
$7,710
(% of AGI for various income ranges: 1.7% for AGIs below $25k, 6.2% for AGIs $25k-50k, 28.1% for AGIs $50k-75k, 77.5% for AGIs $75k-100k, 171.1% for AGIs $100k-200k, 1503.3% for AGIs over 200k)
Earned income credit: $1,921 (reported on 18.4% of returns)
Here:
$1,921
State:
$2,053
(% of AGI for various income ranges: 71.2% for AGIs below $25k, 51.8% for AGIs $25k-50k, 1.7% for AGIs $50k-75k)
Percentage of individuals using paid preparers for their 2020 taxes: 93.6%
Here:
94%
State:
93%
(% for various income ranges: 92.1% for AGIs below $25k, 94.6% for AGIs $25k-50k, 94.4% for AGIs $50k-75k, 95.2% for AGIs $75k-100k, 96.4% for AGIs $100k-200k, 92.3% for AGIs over 200k)
Averages for the 2012 tax year for zip code 81501, filed in 2013:
Average Adjusted Gross Income (AGI) in 2012: $36,624 (Individual Income Tax Returns)
Here:
$36,624
State:
$69,103
Salary/wage: $32,127 (reported on 86.3% of returns)
Here:
$32,127
State:
$54,794
(% of AGI for various income ranges: 81.6% for AGIs below $25k, 82.9% for AGIs $25k-50k, 78.1% for AGIs $50k-75k, 77.8% for AGIs $75k-100k, 70.5% for AGIs $100k-200k, 39.9% for AGIs over 200k)
Taxable interest for individuals: $1,118 (reported on 20.1% of returns)
This zip code:
$1,118
Colorado:
$1,971
(% of AGI for various income ranges: 0.6% for AGIs below $25k, 0.4% for AGIs $25k-50k, 0.6% for AGIs $50k-75k, 0.5% for AGIs $75k-100k, 0.5% for AGIs $100k-200k, 1.9% for AGIs over 200k)
Ordinary dividends: $5,790 (reported on 12.4% of returns)
Here:
$5,790
State:
$7,140
(% of AGI for various income ranges: 1.0% for AGIs below $25k, 0.7% for AGIs $25k-50k, 1.1% for AGIs $50k-75k, 0.8% for AGIs $75k-100k, 1.6% for AGIs $100k-200k, 12.8% for AGIs over 200k)
Net capital gain/loss in AGI: +$4,168 (reported on 10.3% of returns)
Here:
+$4,168
State:
+$23,009
(% of AGI for various income ranges: 0.4% for AGIs $25k-50k, 0.8% for AGIs $50k-75k, 0.9% for AGIs $75k-100k, 1.5% for AGIs $100k-200k, 7.2% for AGIs over 200k)
Profit/loss from business: +$10,514 (reported on 12.2% of returns)
Here:
+$10,514
State:
+$13,514
(% of AGI for various income ranges: 5.2% for AGIs below $25k, 3.2% for AGIs $25k-50k, 2.7% for AGIs $50k-75k, 1.9% for AGIs $75k-100k, 5.4% for AGIs $100k-200k, 2.7% for AGIs over 200k)
Taxable individual retirement arrangement distribution: $11,859 (reported on 7.5% of returns)
81501:
$11,859
Colorado:
$17,927
(% of AGI for various income ranges: 1.8% for AGIs below $25k, 1.8% for AGIs $25k-50k, 2.2% for AGIs $50k-75k, 2.8% for AGIs $75k-100k, 5.7% for AGIs $100k-200k)
Total itemized deductions: $16,557 (23% of AGI, reported on 20.9% of returns)
Here:
$16,557
State:
$24,621
Here:
22.7% of AGI
State:
18.5% of AGI
(% of AGI for various income ranges: 5.9% for AGIs below $25k, 7.9% for AGIs $25k-50k, 11.2% for AGIs $50k-75k, 11.3% for AGIs $75k-100k, 12.2% for AGIs $100k-200k, 9.4% for AGIs over 200k)
Charity contributions: $3,236 (reported on 13.7% of returns)
Here:
$3,236
State:
$4,449
(% of AGI for various income ranges: 0.4% for AGIs below $25k, 0.7% for AGIs $25k-50k, 1.3% for AGIs $50k-75k, 1.7% for AGIs $75k-100k, 1.8% for AGIs $100k-200k, 2.5% for AGIs over 200k)
Taxes paid: $3,774 (reported on 20.6% of returns)
81501:
$3,774
State:
$7,641
(% of AGI for various income ranges: 0.6% for AGIs below $25k, 1.3% for AGIs $25k-50k, 2.1% for AGIs $50k-75k, 2.7% for AGIs $75k-100k, 3.8% for AGIs $100k-200k, 4.0% for AGIs over 200k)
Earned income credit: $1,859 (reported on 21.6% of returns)
Here:
$1,859
State:
$2,095
(% of AGI for various income ranges: 5.1% for AGIs below $25k, 0.9% for AGIs $25k-50k)
Percentage of individuals using paid preparers for their 2012 taxes: 44.2%
Here:
44%
State:
49%
(% for various income ranges: 39.1% for AGIs below $25k, 43.6% for AGIs $25k-50k, 52.3% for AGIs $50k-75k, 56.6% for AGIs $75k-100k, 60.0% for AGIs $100k-200k, 85.7% for AGIs over 200k)
Averages for the 2004 tax year for zip code 81501, filed in 2005:
Average Adjusted Gross Income (AGI) in 2004: $28,876 (Individual Income Tax Returns)
Here:
$28,876
State:
$55,014
Salary/wage: $25,804 (reported on 84.0% of returns)
Here:
$25,804
State:
$46,010
(% of AGI for various income ranges: 105.4% for AGIs below $10k, 78.8% for AGIs $10k-25k, 81.1% for AGIs $25k-50k, 80.1% for AGIs $50k-75k, 71.6% for AGIs $75k-100k, 46.2% for AGIs over 100k)
Taxable interest for individuals: $1,677 (reported on 30.4% of returns)
This zip code:
$1,677
Colorado:
$2,127
(% of AGI for various income ranges: 4.9% for AGIs below $10k, 2.0% for AGIs $10k-25k, 1.3% for AGIs $25k-50k, 1.0% for AGIs $50k-75k, 2.0% for AGIs $75k-100k, 2.5% for AGIs over 100k)
Taxable dividends: $2,271 (reported on 16.6% of returns)
Here:
$2,271
State:
$3,782
(% of AGI for various income ranges: 2.6% for AGIs below $10k, 1.2% for AGIs $10k-25k, 0.9% for AGIs $25k-50k, 0.8% for AGIs $50k-75k, 1.7% for AGIs $75k-100k, 2.2% for AGIs over 100k)
Net capital gain/loss: +$5,770 (reported on 14.1% of returns)
Here:
+$5,770
State:
+$17,882
(% of AGI for various income ranges: -1.0% for AGIs below $10k, 0.4% for AGIs $10k-25k, 0.9% for AGIs $25k-50k, 1.6% for AGIs $50k-75k, 2.9% for AGIs $75k-100k, 12.3% for AGIs over 100k)
Profit/loss from business: +$8,052 (reported on 14.5% of returns)
Here:
+$8,052
State:
+$11,247
(% of AGI for various income ranges: 2.6% for AGIs below $10k, 4.8% for AGIs $10k-25k, 3.2% for AGIs $25k-50k, 2.3% for AGIs $50k-75k, 3.2% for AGIs $75k-100k, 8.0% for AGIs over 100k)
IRA payment deduction: $2,322 (reported on 2.2% of returns)
81501:
$2,322
Colorado:
$2,947
(% of AGI for various income ranges: 0.2% for AGIs $10k-25k, 0.3% for AGIs $25k-50k, 0.2% for AGIs $50k-75k, 0.4% for AGIs $75k-100k)
Self-employed pension: $9,906 (reported on 0.4% of returns)
Here:
$9,906
Colorado:
$13,653
Total itemized deductions: $14,331 (25% of AGI, reported on 22.7% of returns)
Here:
$14,331
State:
$20,560
Here:
25.3% of AGI
State:
21.4% of AGI
(% of AGI for various income ranges: 7.6% for AGIs below $10k, 7.4% for AGIs $10k-25k, 11.2% for AGIs $25k-50k, 13.2% for AGIs $50k-75k, 15.7% for AGIs $75k-100k, 11.7% for AGIs over 100k)
Charity contributions deductions: $2,393 (4% of AGI, reported on 17.5% of returns)
Here:
$2,393
State:
$3,518
Here:
4.0% of AGI
State:
3.4% of AGI
(% of AGI for various income ranges: 0.5% for AGIs below $10k, 0.8% for AGIs $10k-25k, 1.0% for AGIs $25k-50k, 1.6% for AGIs $50k-75k, 2.3% for AGIs $75k-100k, 2.7% for AGIs over 100k)
Total tax: $3,779 (reported on 69.6% of returns)
81501:
$3,779
State:
$9,173
(% of AGI for various income ranges: 2.3% for AGIs below $10k, 4.3% for AGIs $10k-25k, 6.9% for AGIs $25k-50k, 9.1% for AGIs $50k-75k, 11.6% for AGIs $75k-100k, 19.7% for AGIs over 100k)
Earned income credit: $1,522 (reported on 21.3% of returns)
Here:
$1,522
State:
$1,595
Percentage of individuals using paid preparers for their 2004 taxes: 55.6%
Here:
56%
State:
55%
(% for various income ranges: 49.7% for AGIs below $10k, 56.0% for AGIs $10k-25k, 56.2% for AGIs $25k-50k, 60.2% for AGIs $50k-75k, 59.8% for AGIs $75k-100k, 83.7% for AGIs over 100k)
Likely homosexual households (counted as self-reported same-sex unmarried-partner households)
Lesbian couples: 0.1% of all households
Gay men: 0.4% of all households
Household received Food Stamps/SNAP in the past 12 months: 1,960 Household did not receive Food Stamps/SNAP in the past 12 months: 9,357
Women who had a birth in the past 12 months: 220 (111 now married, 100 unmarried) Women who did not have a birth in the past 12 months: 5,827 (1,574 now married, 4,282 unmarried)
Housing units in zip code 81501 with a mortgage: 3,460 (321 second mortgage, 16 home equity loan, 166 both second mortgage and home equity loan) Median monthly owner costs for units with a mortgage: $1,399 Median monthly owner costs for units without a mortgage: $401
Residents with income below the poverty level in 2022:
This zip code:
19.4%
Whole state:
9.4%
Residents with income below 50% of the poverty level in 2022:
This zip code:
9.2%
Whole state:
4.6%
Median number of rooms in houses and condos:
Here:
5.3
State:
6.8
Median number of rooms in apartments:
Here:
3.8
State:
4.0
Notable locations in this zip code not listed on our city pages
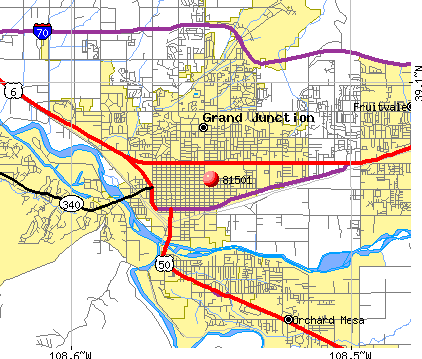
Notable locations in zip code 81501: Grand Speedway (A), Teller Arms Center (B), Eastgate Center (C), Saint Mary's Care Flight (D), Grand Junction Fire Department Station 1 (E). Display/hide their locations on the map
Tourist attractions (not listed on the city page) : Grand Junction Visitor & Convention Bureau (Horizon Drive & I 70), Grand Junction Visitor & Convention-Bureau - Visitor Center (Grand Avenue).
1,903 married couples with children.
1,122 single-parent households (390 men, 732 women).
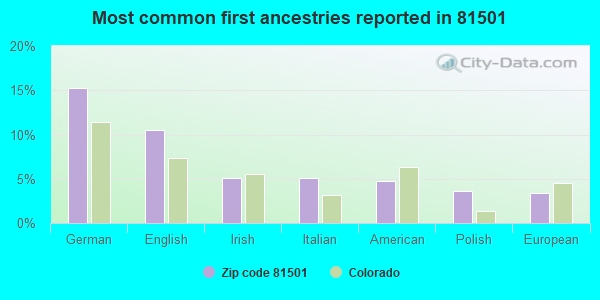
92.9% of residents of 81501 zip code speak English at home.
5.4% of residents speak Spanish at home (59% very well, 24% well, 17% not well).
1.6% of residents speak other Indo-European language at home (93% very well, 5% well, 3% not well).
0.4% of residents speak Asian or Pacific Island language at home (95% very well, 3% well, 2% not at all).
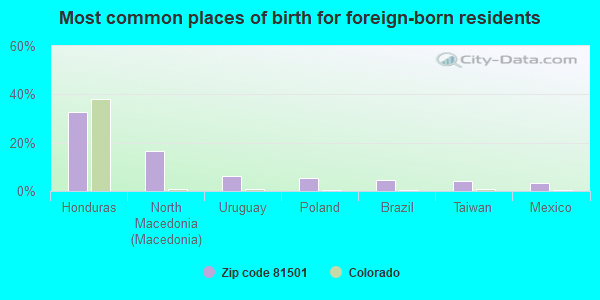
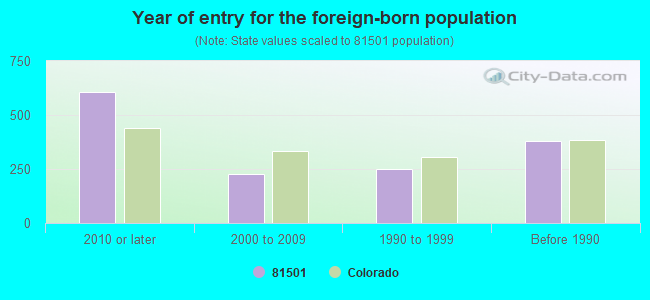
Foreign born population: 1,214 (5.0%) (41.3% of them are naturalized citizens)
Major facilities with environmental interests located in this zip code:
CR BROWN OIL CO GO FER FOODS 18 ST (1750 NORTH AVE in GRAND JUNCTION, CO)
AIR MINOR (AIRS/AFS) ENFORCEMENT/COMPLIANCE ACTIVITY (Integrated Compliance Information System) - ICIS-08-1998-0070, FORMAL ENFORCEMENT ACTION (Integrated Compliance Information System) - ICIS-08-1998-0070, FORMAL ENFORCEMENT ACTION CRITERIA AND HAZARDOUS AIR POLLUTANT INVENTORY (Inventory of air pollution sources) Business SIC classification: GROCERIES, GENERAL LINE; GASOLINE SERVICE STATIONS
BOOKCLIFF GAS & GROCERY (2896 NORTH AVE in GRAND JUNCTION, CO)
AIR MINOR (AIRS/AFS) ENFORCEMENT/COMPLIANCE ACTIVITY (Integrated Compliance Information System) - ICIS-08-1998-0084, FORMAL ENFORCEMENT ACTION (Integrated Compliance Information System) - ICIS-08-1998-0084, FORMAL ENFORCEMENT ACTION CRITERIA AND HAZARDOUS AIR POLLUTANT INVENTORY (Inventory of air pollution sources) Business SIC classification: GROCERY STORES; GASOLINE SERVICE STATIONS
CACTUS COATINGS INCORPORATED (1031 S 15TH ST in GRAND JUNCTION, CO)
AIR MINOR (AIRS/AFS) STATE MASTER (Colorado database) - RCRAINFO-COD983777897, SQG CRITERIA AND HAZARDOUS AIR POLLUTANT INVENTORY (Inventory of air pollution sources) (Resource Conservation and Recovery Act (tracking hazardous waste)) Business SIC classification: TOP, BODY, AND UPHOLSTERY REPAIR SHOPS AND PAINT SHOPS Business NAICS classification: COMMERCIAL SCREEN PRINTING.; AUTOMOTIVE BODY, PAINT, AND INTERIOR REPAIR AND MAINTENANCE.
CAPCO INCORPORATED (1328 WINTERS AVENUE in GRAND JUNCTION, CO)
AIR MINOR (AIRS/AFS) STATE MASTER (Colorado database) - RCRAINFO-COD056838428, SQG ENFORCEMENT/COMPLIANCE ACTIVITY (Integrated Compliance Information System) COMPLIANCE ACTIVITY (Tracking inspections of insecticide, fungicide, and rodenticide, and toxic substances) Small Quantity Generators, between 100 kg and 1000 kg of hazardous waste/month (Resource Conservation and Recovery Act (tracking hazardous waste)) - notification TRI REPORTER (Tracking of toxic chemicals releasing facilities) Business SIC classification: METAL HEAT TREATING; SCREW MACHINE PRODUCTS; METAL STAMPINGS; ELECTROPLATING, PLATING, POLISHING, ANODIZING, AND COLORING; ORDNANCE AND ACCESSORIES; FABRICATED METAL PRODUCTS; ELECTRON TUBES Business NAICS classification: OTHER ORDNANCE AND ACCESSORIES MANUFACTURING.; ALL OTHER MISCELLANEOUS FABRICATED METAL PRODUCT MANUFACTURING. Organizations: CLARENCE E WOOD (CONTACT/OWNER)
ABC INDUSTRIES (610 SOUTH 12TH STREET in GRAND JUNCTION, CO)
AIR MAJOR (AIRS/AFS) STATE MASTER (Colorado database) - APCDSSP-CO0770128, AIR MAJOR, RCRAINFO-COD095738381, SQG CRITERIA AND HAZARDOUS AIR POLLUTANT INVENTORY (Inventory of air pollution sources) Small Quantity Generators, between 100 kg and 1000 kg of hazardous waste/month (Resource Conservation and Recovery Act (tracking hazardous waste)) - notification TRI REPORTER (Tracking of toxic chemicals releasing facilities) Business SIC classification: RUBBER AND PLASTICS HOSE AND BELTING; LAMINATED PLASTICS PLATE, SHEET, AND PROFILE SHAPES; PLASTICS PRODUCTS; INDUSTRIAL AND COMMERCIAL FANS AND BLOWERS AND AIR PURIFICATION EQUIPMENT Business NAICS classification: PLASTICS PIPE AND PIPE FITTING MANUFACTURING. Organizations: ABC INDUSTRIES INC (CONTACT/OPERATOR)
, PEABODY ABC CORP (CONTACT/OWNER)
Alternative names: ABC INDUSTRIES INC (WAS PEABODY ABC)
GRAND JUNCTION CITY OF PERSIGO WWTF (2145 RIVER ROAD 4.5 MILES WEST OF GRAND JUNCTION in GRAND JUNCTION, CO)
AIR MINOR (AIRS/AFS) ENFORCEMENT/COMPLIANCE ACTIVITY (Integrated Compliance Information System) CRITERIA AND HAZARDOUS AIR POLLUTANT INVENTORY (Inventory of air pollution sources) National Pollutant Discharge Elimination System MAJOR (Tracking pollutant discharge elimination systems) - permit - ICIS-, ENFORCEMENT/COMPLIANCE ACTIVITY Business SIC classification: SEWERAGE SYSTEMS Alternative names: GRAND JUNCTION MESA CO PERSIGO WWTP, MESA CO./GRAND JUNCTION, CITY, PERSIGO WASTEWATER TREATMENT PLANT
KC ASPHALT LLC - GRAND JUNCTION CO (202 FOURTH AVE in GRAND JUNCTION, CO)
AIR MINOR (AIRS/AFS) OIL CONTROL (Facility Response Plan for oil discharge) CRITERIA AND HAZARDOUS AIR POLLUTANT INVENTORY (Inventory of air pollution sources) Conditionally Exempt Small Quantity Generators, less than 100 kg/month of hazardous waste (Resource Conservation and Recovery Act (tracking hazardous waste)) TRI REPORTER (Tracking of toxic chemicals releasing facilities) Business SIC classification: ASPHALT PAVING MIXTURES AND BLOCKS Organizations: SEMMATERIALS, L.P. (CONTACT/GENERAL)
, KOCH MATERIALS COMPANY (CONTACT/OWNER)
, KOCH PERFORMANCE ASPHAULT CO (CONTACT/OWNER)
Alternative names: KOCH MATERIALS COMPANY, KOCH PERFORMANCE ASPHALT COMPANY, KOCH PERFORMANCE ASPHALT CO. GRAND JUNCTION CO., KOCH PERFORMANCE ASPHALT CO. GRAND JUNCTION CO., SEMMATERIALS, GRAND JUNCTION PLANT
AMETEK (475 28 1/2 RD in GRAND JUNCTION, CO)
STATE MASTER (Colorado database) - RCRAINFO-COR000200188, SQG (Resource Conservation and Recovery Act (tracking hazardous waste)) TRI REPORTER (Tracking of toxic chemicals releasing facilities) Business SIC classification: TOTALIZING FLUID METERS AND COUNTING DEVICES Organizations: HILLTOP COMMUNITY RESOURCES (CONTACT/OWNER)
Alternative names: AMETEK / DIXSON
INNOVATIVE TEXTILES INC (2105 E MAIN ST in GRAND JUNCTION, CO)
STATE MASTER (Colorado database) - RCRAINFO-CO0000103846, SQG (Resource Conservation and Recovery Act (tracking hazardous waste)) Business NAICS classification: ROPE, CORDAGE, AND TWINE MILLS. Organizations: INNOVATIVE TEXTILES INC (CONTACT/OPERATOR)
, KONRAD KRAULAND (CONTACT/OWNER)
GARDEN VILLAGE PHYSICIANS (2404 TELLER AVE in GRAND JUNCTION, CO)
STATE MASTER (Colorado database) - RCRAINFO-COD983768847, SQG (Resource Conservation and Recovery Act (tracking hazardous waste)) Organizations: J. DALE UTT D.O. (CONTACT/OWNER)
GRAND JUNCTION CONCRETE PIPE CO (2868 I-70 BUSINESS LOOP in GRAND JUNCTION, CO)
AIR MINOR (AIRS/AFS) CRITERIA AND HAZARDOUS AIR POLLUTANT INVENTORY (Inventory of air pollution sources) Business SIC classification: CONSTRUCTION SAND AND GRAVEL; CONCRETE PRODUCTS, EXCEPT BLOCK AND BRICK; READY-MIXED CONCRETE Alternative names: GRAND JUNCTION CONCRETE PIPE / READY MIX
GRAND JUNCTION RAIL TERMINAL (2230 RAILROAD AVE in GRAND JUNCTION, CO)
STATE MASTER (Colorado database) - RCRAINFO-COR000205591, SQG Small Quantity Generators, between 100 kg and 1000 kg of hazardous waste/month (Resource Conservation and Recovery Act (tracking hazardous waste)) Organizations: CONOCOPHILLIPS COMPANY (CONTACT/OWNER)
CUSTOM CHROME (819 KIMBALL AVE in GRAND JUNCTION, CO)
Housing units lacking complete plumbing facilities: 1.2% Housing units lacking complete kitchen facilities: 3.4%
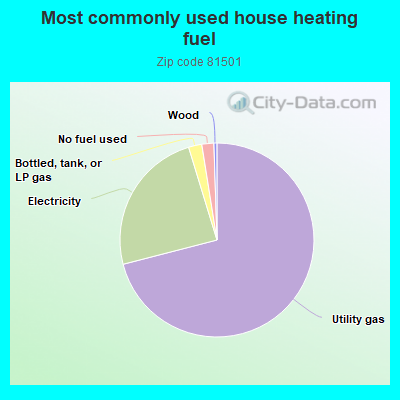
70.7%Utility gas
24.2%Electricity
2.2%Bottled, tank, or LP gas
2.0%No fuel used
0.5%Wood
Population in 1990: 19,665. Population change in the 1990s: +1,078 (+5.5%).
Place of birth for U.S.-born residents:
This state: 11,809
Northeast: 954
Midwest: 3,093
South: 2,162
West: 4,793
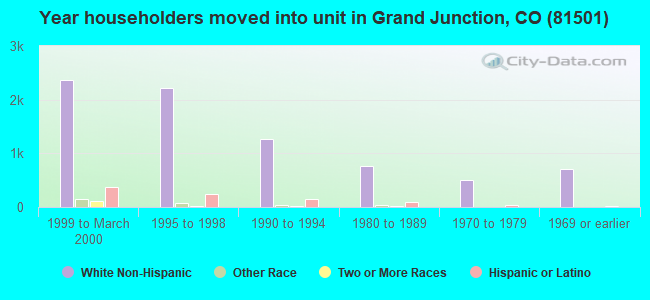
40% of the 81501 zip code residents lived in the same house 5 years ago. Out of people who lived in different houses, 52% lived in this county. Out of people who lived in different counties, 50% lived in Colorado.
77% of the 81501 zip code residents lived in the same house 1 year ago. Out of people who lived in different houses, 49% moved from this county. Out of people who lived in different houses, 22% moved from different county within same state. Out of people who lived in different houses, 23% moved from different state. Out of people who lived in different houses, 2% moved from abroad.
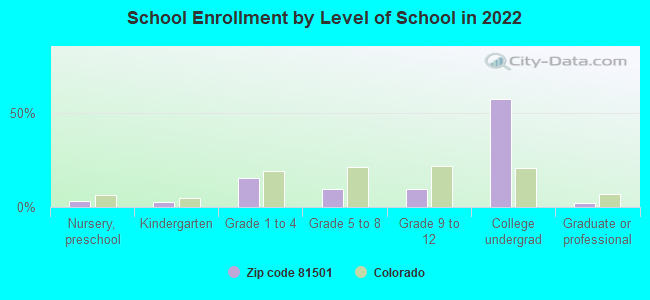
Private vs. public school enrollment:
Students in private schools in grades 1 to 8 (elementary and middle school): 406
Here:
26.1%
Colorado:
11.4%
Students in private schools in grades 9 to 12 (high school): 60
Here:
10.3%
Colorado:
8.5%
Students in private undergraduate colleges: 264
Here:
7.5%
Colorado:
14.0%
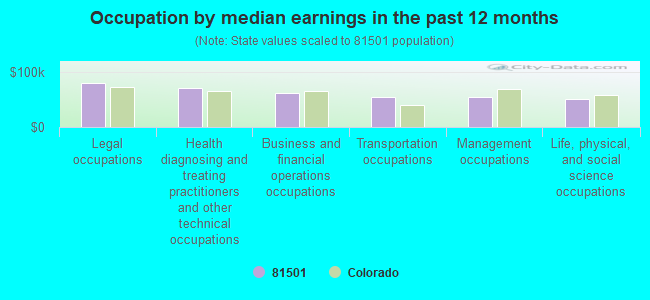
Occupation by median earnings in the past 12 months ($)
79,520Legal occupations
70,923Health diagnosing and treating practitioners and other technical occupations
60,707Business and financial operations occupations
55,117Transportation occupations
53,610Management occupations
49,851Life, physical, and social science occupations
Companies with federal contracts located in this zip code (GRAND JUNCTION, CO):
CAPCO INC (1328 WINTERS AVE; small business) : $133,592,712 in 104 contractsfrom 1999 to 2006
Contracts for Bombs, Guns, through 30 mm, Cartridge and Propellant Actuated Devices and Components, Miscellaneous Weapons, and moreby Army, Air Force, Navy, Defense Logistics Agency, and others Signed by year:2000: $5,850,304; 2001: $27,667,571; 2002: $12,926,541; 2003: $18,333,062; 2004: $20,844,745; 2005: $39,484,975; 2006: $8,228,909.
Biggest contracts:
$27,198,356 with Army for Bombs. Signed on 2005-01-12. Completion date: 2007-06-30.
$22,740,041 with Army for Guns, through 30 mm. Signed on 2001-04-30. Completion date: 2004-05-05.
$12,379,487 with Army for Bombs. Signed on 2003-07-23. Completion date: 2004-06-14.
$7,252,061 with Air Force for Cartridge and Propellant Actuated Devices and Components. Signed on 2004-01-13. Completion date: 2005-12-30.
SAVE MORE RESOURCES, INC (634 MAIN ST STE 100; small business) : $309,282 in 8 contractsfrom 2004 to 2006
Contracts for ADP Support Equipment, Other ADP and Telecommunications Services (includes data storage on tapes, compact disks, etc.), ADP Software, Miscellaneous Items, and moreby Federal Technology Service, Army Signed by year:2000: $0; 2001: $0; 2002: $0; 2003: $0; 2004: $194,740; 2005: $92,102; 2006: $22,440.
Biggest contracts:
$153,000 with Federal Technology Service for ADP Support Equipment. Taking place in VA. Signed on 2004-03-12. Completion date: 2004-04-09.
$42,722 with Army for Other ADP and Telecommunications Services (includes data storage on tapes, compact disks, etc.). Signed on 2005-05-19. Completion date: 2006-03-30.
$37,800 with Army for ADP Software. Signed on 2005-01-24. Completion date: 2005-03-10.
$30,865 with Army for Miscellaneous Items. Taking place in WY. Signed on 2004-09-22. Completion date: 2004-10-22.
MUNRO SYSTEMS INC (955 3RD AVE; small business)
$69,349 with Bureau of Reclamation for Water Turbines and Water Wheels; and Components. Taking place in UT. Signed on 2003-07-15. Completion date: 2003-09-15.
WESTERN HOSPITALITY LLC (225 MAIN ST; small business) : $39,877 in 4 contractsfrom 2003 to 2005
$20,976 with Army for Construction of Structures and Facilities -- Family Housing Facilities. Signed on 2003-12-17. Completion date: 2004-02-13.
$11,730, same as above.Signed on 2003-12-05. Completion date: 2004-02-13.
$5,964, same as above.Signed on 2005-03-17. Completion date: 2005-03-21.
$1,207, same as above.Signed on 2005-03-22. Completion date: 2005-03-21.
WAGNER EQUIPMENT CO (No data from D and B; small business) 3 employees, $0 revenue. : $24,000 in 2 contractsin 2002
$21,000 with Bureau of Land Management for Range Seeding Services (ground equipment). Signed on 2002-09-15. Completion date: 2002-11-15.
$3,000, same as above.Signed on 2002-09-15. Completion date: 2002-11-15.
DMT CULINARY ADVENTURES (104 ORCHARD AVE STE A1; small business) : $7,341 in 2 contractsfrom 2005 to 2006
$4,576 with Army for Dairy Foods and Eggs. Signed on 2006-06-09. Completion date: 2006-06-23.
$2,765 with Army for Food Services. Signed on 2005-03-17. Completion date: 2005-03-21.
GRAND JUNCTION NEWSPAPERS INC (734 S 7TH ST; small business)
$5,421 with Navy for Newspapers and Periodicals. Signed on 2004-12-16. Completion date: 2005-10-30.
COLORADO WEST HEALTHCARE SYSTE (2021 N 12TH ST; small business)
$1,131 with Army for Medical/Psychiatric Consultation Services. Signed on 2005-08-25. Completion date: 2005-05-05.
NEFF SERVICES, INC (334 WALNUT AVENUE; small business) : $0 in 3 contractsin 2004
$7,728 with Army for Custodial Janitorial Services. Signed on 2004-02-29. Completion date: 2005-03-31.
$0, same as above.Signed on 2004-02-29. Completion date: 2005-03-31.
-$7,728, same as above.Signed on 2004-09-01. Completion date: 2005-03-31.
Top industries in this zip code by the number of employees in 2005:
Health Care and Social Assistance: General Medical and Surgical Hospitals (over 1000 employees: 1 establishment, 250-499 employees: 2 establishments)
Health Care and Social Assistance: Offices of Physicians (except Mental Health Specialists) (100-249: 1, 50-99: 2, 20-49: 9, 10-19: 9, 5-9: 14, 1-4: 33)
Professional, Scientific, and Technical Services: Other Computer Related Services (500-999: 1, 100-249: 1)
Administrative and Support and Waste Management and Remediation Services: Temporary Help Services (250-499: 1, 100-249: 2, 50-99: 2, 20-49: 1, 1-4: 1)
2002 - 2018 National Fire Incident Reporting System (NFIRS) incidents
According to the data from the years 2002 - 2018 the average number of fire incidents per year is 98. The highest number of reported fires - 146 took place in 2003, and the least - 66 in 2015. The data has a decreasing trend.
When looking into fire subcategories, the most reports belonged to: Structure Fires (39.8%), and Outside Fires (38.0%).
Fire incident types reported to NFIRS in Zip Code 81501


 Nearest zip codes: 81506, 81504, 81520, 81503, 81507, 81505.
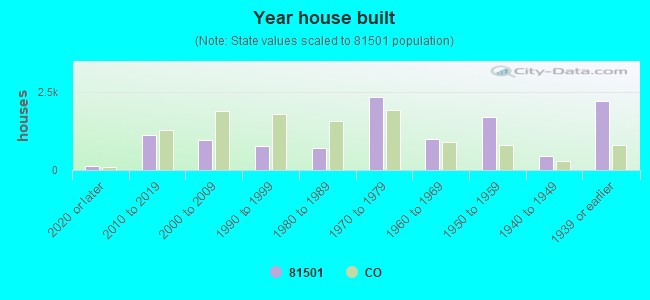


 According to the data from the years 2002 - 2018 the average number of fire incidents per year is 98. The highest number of reported fires - 146 took place in 2003, and the least - 66 in 2015. The data has a decreasing trend.
 When looking into fire subcategories, the most reports belonged to: Structure Fires (39.8%), and Outside Fires (38.0%).