Estimated zip code population in 2022: 16,345 Zip code population in 2010: 15,250 Zip code population in 2000: 23,407
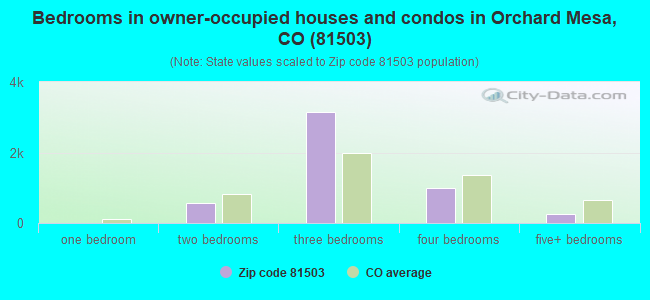
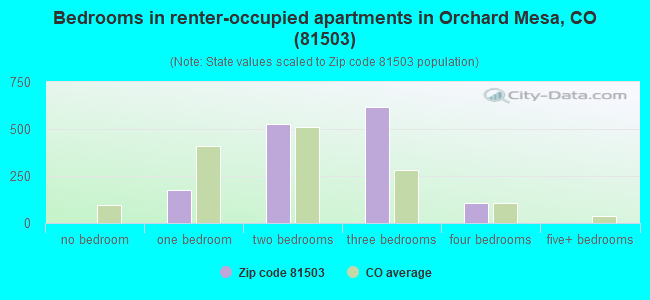
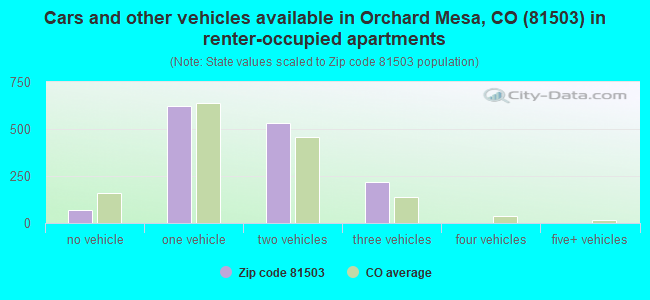
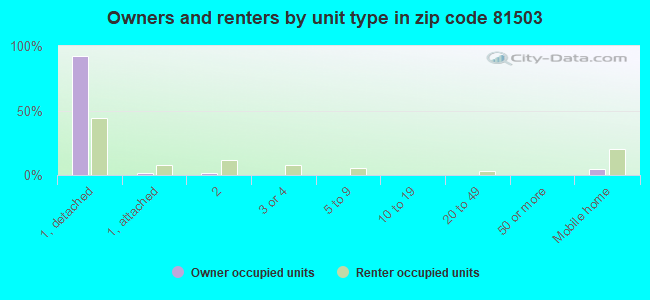
Houses and condos: 6,781 Renter-occupied apartments: 1,442
% of renters here:
22%
State:
34%
March 2022 cost of living index in zip code 81503: 93.5 (less than average, U.S. average is 100)
Land area: 35.1 sq. mi. Water area: 0.4 sq. mi.
Population density: 466 people per square mile
(low).
OSM Map
General Map
Google Map
MSN Map
OSM Map
General Map
Google Map
MSN Map
OSM Map
General Map
Google Map
MSN Map
OSM Map
General Map
Google Map
MSN Map
Please wait while loading the map...
Real estate property taxes paid for housing units in 2022:
This zip code:
0.4% ($1,330)
Colorado:
0.5% ($2,422)
Median real estate property taxes paid for housing units with mortgages in 2022: $1,382 (0.4%) Median real estate property taxes paid for housing units with no mortgage in 2022: $1,207 (0.4%)
Business Search- 14 Million verified businesses
Males: 8,015
(49.0%)
Females: 8,330
(51.0%)
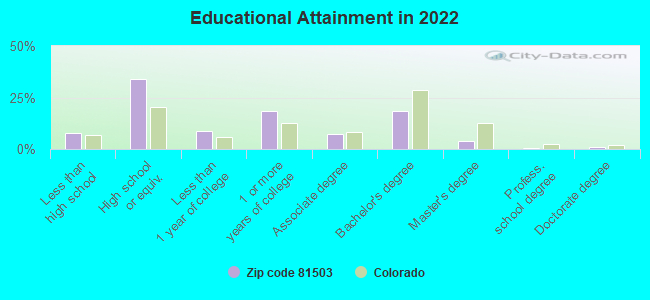
For population 25 years and over in 81503:
High school or higher: 90.3%
Bachelor's degree or higher: 23.6%
Graduate or professional degree: 5.6%
Unemployed: 5.3%
Mean travel time to work (commute): 21.1 minutes
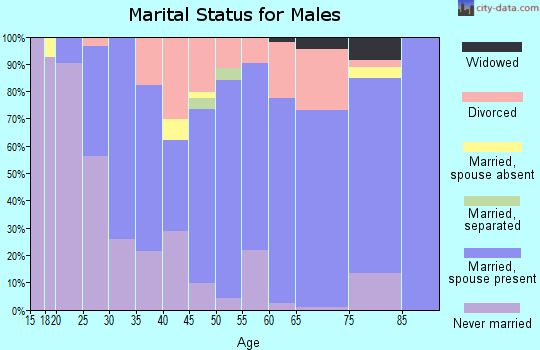
For population 15 years and over in 81503:
Never married: 25.1%
Now married: 58.5%
Separated: 1.1%
Widowed: 4.9%
Divorced: 10.4%
Zip code 81503 compared to state average:
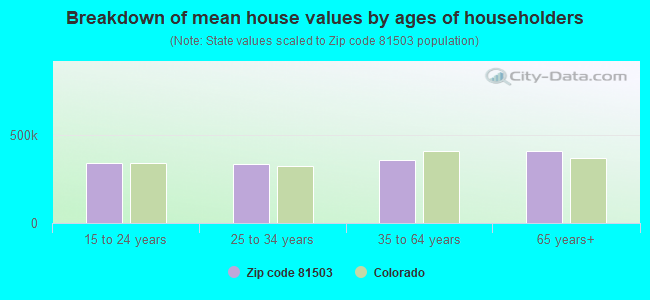
Median house value below state average.
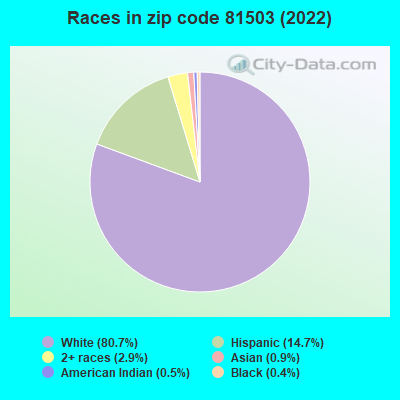
Black race population percentage significantly below state average.
Foreign-born population percentage significantly below state average.
Length of stay since moving in significantly above state average.
Percentage of population with a bachelor's degree or higher below state average.
Averages for the 2020 tax year for zip code 81503, filed in 2021:
Average Adjusted Gross Income (AGI) in 2020: $53,888 (Individual Income Tax Returns)
Here:
$53,888
State:
$89,260
Salary/wage: $46,042 (reported on 80.4% of returns)
Here:
$46,042
State:
$70,330
(% of AGI for various income ranges: 1207.6% for AGIs below $25k, 3491.8% for AGIs $25k-50k, 6141.0% for AGIs $50k-75k, 9603.9% for AGIs $75k-100k, 17001.7% for AGIs $100k-200k, 58367.5% for AGIs over 200k)
Taxable interest for individuals: $1,024 (reported on 25.4% of returns)
This zip code:
$1,024
Colorado:
$2,176
(% of AGI for various income ranges: 17.8% for AGIs below $25k, 17.0% for AGIs $25k-50k, 28.2% for AGIs $50k-75k, 49.8% for AGIs $75k-100k, 85.9% for AGIs $100k-200k, 1225.0% for AGIs over 200k)
Ordinary dividends: $3,832 (reported on 14.9% of returns)
Here:
$3,832
State:
$8,820
(% of AGI for various income ranges: 23.9% for AGIs below $25k, 34.9% for AGIs $25k-50k, 73.3% for AGIs $50k-75k, 153.1% for AGIs $75k-100k, 271.7% for AGIs $100k-200k, 1772.5% for AGIs over 200k)
Net capital gain/loss in AGI: +$11,656 (reported on 14.1% of returns)
Here:
+$11,656
State:
+$37,276
(% of AGI for various income ranges: 5.1% for AGIs below $25k, 34.4% for AGIs $25k-50k, 98.1% for AGIs $50k-75k, 190.4% for AGIs $75k-100k, 792.6% for AGIs $100k-200k, 16227.5% for AGIs over 200k)
Profit/loss from business: +$11,495 (reported on 13.6% of returns)
Here:
+$11,495
State:
+$15,295
(% of AGI for various income ranges: 117.6% for AGIs below $25k, 119.8% for AGIs $25k-50k, 295.2% for AGIs $50k-75k, 315.5% for AGIs $75k-100k, 475.2% for AGIs $100k-200k, 3797.5% for AGIs over 200k)
Taxable individual retirement arrangement distribution: $17,239 (reported on 9.7% of returns)
81503:
$17,239
Colorado:
$23,785
(% of AGI for various income ranges: 68.0% for AGIs below $25k, 101.4% for AGIs $25k-50k, 227.4% for AGIs $50k-75k, 412.7% for AGIs $75k-100k, 1025.4% for AGIs $100k-200k, 2755.0% for AGIs over 200k)
Total itemized deductions: $25,579 (reported on 5.1% of returns)
Here:
$25,579
State:
$35,141
(% of AGI for various income ranges: 30.6% for AGIs below $25k, 70.7% for AGIs $25k-50k, 211.7% for AGIs $50k-75k, 336.1% for AGIs $75k-100k, 630.7% for AGIs $100k-200k, 4645.0% for AGIs over 200k)
Charity contributions: $9,535 (reported on 3.4% of returns)
Here:
$9,535
State:
$12,103
(% of AGI for various income ranges: 11.7% for AGIs $25k-50k, 23.3% for AGIs $50k-75k, 73.9% for AGIs $75k-100k, 184.3% for AGIs $100k-200k, 2170.0% for AGIs over 200k)
Taxes paid: $5,538 (reported on 5.1% of returns)
81503:
$5,538
State:
$7,710
(% of AGI for various income ranges: 3.5% for AGIs below $25k, 10.7% for AGIs $25k-50k, 43.8% for AGIs $50k-75k, 73.1% for AGIs $75k-100k, 158.3% for AGIs $100k-200k, 1137.5% for AGIs over 200k)
Earned income credit: $2,225 (reported on 16.3% of returns)
Here:
$2,225
State:
$2,053
(% of AGI for various income ranges: 90.3% for AGIs below $25k, 64.7% for AGIs $25k-50k, 1.5% for AGIs $50k-75k)
Percentage of individuals using paid preparers for their 2020 taxes: 93.5%
Here:
93%
State:
93%
(% for various income ranges: 92.4% for AGIs below $25k, 93.6% for AGIs $25k-50k, 95.0% for AGIs $50k-75k, 93.5% for AGIs $75k-100k, 94.1% for AGIs $100k-200k, 93.3% for AGIs over 200k)
Averages for the 2012 tax year for zip code 81503, filed in 2013:
Average Adjusted Gross Income (AGI) in 2012: $48,526 (Individual Income Tax Returns)
Here:
$48,526
State:
$69,103
Salary/wage: $41,346 (reported on 84.1% of returns)
Here:
$41,346
State:
$54,794
(% of AGI for various income ranges: 74.6% for AGIs below $25k, 78.3% for AGIs $25k-50k, 77.7% for AGIs $50k-75k, 79.7% for AGIs $75k-100k, 78.2% for AGIs $100k-200k, 19.7% for AGIs over 200k)
Taxable interest for individuals: $1,083 (reported on 25.8% of returns)
This zip code:
$1,083
Colorado:
$1,971
(% of AGI for various income ranges: 1.1% for AGIs below $25k, 0.6% for AGIs $25k-50k, 0.3% for AGIs $50k-75k, 0.5% for AGIs $75k-100k, 0.9% for AGIs $100k-200k, 0.2% for AGIs over 200k)
Ordinary dividends: $2,758 (reported on 14.4% of returns)
Here:
$2,758
State:
$7,140
(% of AGI for various income ranges: 1.2% for AGIs below $25k, 0.7% for AGIs $25k-50k, 0.7% for AGIs $50k-75k, 0.8% for AGIs $75k-100k, 0.7% for AGIs $100k-200k, 1.3% for AGIs over 200k)
Net capital gain/loss in AGI: +$4,526 (reported on 10.6% of returns)
Here:
+$4,526
State:
+$23,009
(% of AGI for various income ranges: 0.4% for AGIs $25k-50k, 0.5% for AGIs $50k-75k, 0.5% for AGIs $75k-100k, 1.0% for AGIs $100k-200k, 4.7% for AGIs over 200k)
Profit/loss from business: +$9,583 (reported on 14.4% of returns)
Here:
+$9,583
State:
+$13,514
(% of AGI for various income ranges: 5.9% for AGIs below $25k, 3.0% for AGIs $25k-50k, 2.9% for AGIs $50k-75k, 1.7% for AGIs $75k-100k, 3.5% for AGIs $100k-200k)
Taxable individual retirement arrangement distribution: $12,698 (reported on 9.7% of returns)
81503:
$12,698
Colorado:
$17,927
(% of AGI for various income ranges: 3.3% for AGIs below $25k, 2.5% for AGIs $25k-50k, 2.2% for AGIs $50k-75k, 1.8% for AGIs $75k-100k, 4.3% for AGIs $100k-200k)
Total itemized deductions: $18,031 (21% of AGI, reported on 30.6% of returns)
Here:
$18,031
State:
$24,621
Here:
21.1% of AGI
State:
18.5% of AGI
(% of AGI for various income ranges: 8.6% for AGIs below $25k, 9.9% for AGIs $25k-50k, 11.9% for AGIs $50k-75k, 13.3% for AGIs $75k-100k, 13.7% for AGIs $100k-200k, 7.6% for AGIs over 200k)
Charity contributions: $3,039 (reported on 20.5% of returns)
Here:
$3,039
State:
$4,449
(% of AGI for various income ranges: 0.6% for AGIs below $25k, 0.8% for AGIs $25k-50k, 1.4% for AGIs $50k-75k, 1.7% for AGIs $75k-100k, 1.7% for AGIs $100k-200k, 1.1% for AGIs over 200k)
Taxes paid: $4,246 (reported on 30.2% of returns)
81503:
$4,246
State:
$7,641
(% of AGI for various income ranges: 1.0% for AGIs below $25k, 1.7% for AGIs $25k-50k, 2.5% for AGIs $50k-75k, 3.1% for AGIs $75k-100k, 3.9% for AGIs $100k-200k, 2.7% for AGIs over 200k)
Earned income credit: $2,144 (reported on 18.9% of returns)
Here:
$2,144
State:
$2,095
(% of AGI for various income ranges: 6.1% for AGIs below $25k, 1.1% for AGIs $25k-50k)
Percentage of individuals using paid preparers for their 2012 taxes: 46.7%
Here:
47%
State:
49%
(% for various income ranges: 39.8% for AGIs below $25k, 46.0% for AGIs $25k-50k, 47.6% for AGIs $50k-75k, 55.9% for AGIs $75k-100k, 62.7% for AGIs $100k-200k, 85.7% for AGIs over 200k)
Averages for the 2004 tax year for zip code 81503, filed in 2005:
Average Adjusted Gross Income (AGI) in 2004: $51,824 (Individual Income Tax Returns)
Here:
$51,824
State:
$55,014
Salary/wage: $41,635 (reported on 80.2% of returns)
Here:
$41,635
State:
$46,010
(% of AGI for various income ranges: 147.6% for AGIs below $10k, 70.2% for AGIs $10k-25k, 73.2% for AGIs $25k-50k, 70.1% for AGIs $50k-75k, 71.3% for AGIs $75k-100k, 52.4% for AGIs over 100k)
Taxable interest for individuals: $2,198 (reported on 49.8% of returns)
This zip code:
$2,198
Colorado:
$2,127
(% of AGI for various income ranges: 12.5% for AGIs below $10k, 3.3% for AGIs $10k-25k, 2.1% for AGIs $25k-50k, 1.6% for AGIs $50k-75k, 1.4% for AGIs $75k-100k, 2.2% for AGIs over 100k)
Taxable dividends: $3,954 (reported on 30.5% of returns)
Here:
$3,954
State:
$3,782
(% of AGI for various income ranges: 11.6% for AGIs below $10k, 2.5% for AGIs $10k-25k, 1.5% for AGIs $25k-50k, 1.5% for AGIs $50k-75k, 1.7% for AGIs $75k-100k, 3.0% for AGIs over 100k)
Net capital gain/loss: +$10,710 (reported on 26.8% of returns)
Here:
+$10,710
State:
+$17,882
(% of AGI for various income ranges: -4.4% for AGIs below $10k, 1.3% for AGIs $10k-25k, 1.3% for AGIs $25k-50k, 1.8% for AGIs $50k-75k, 2.7% for AGIs $75k-100k, 11.2% for AGIs over 100k)
Profit/loss from business: +$11,923 (reported on 19.4% of returns)
Here:
+$11,923
State:
+$11,247
(% of AGI for various income ranges: 5.1% for AGIs below $10k, 5.6% for AGIs $10k-25k, 4.0% for AGIs $25k-50k, 3.7% for AGIs $50k-75k, 3.1% for AGIs $75k-100k, 5.3% for AGIs over 100k)
IRA payment deduction: $3,182 (reported on 3.7% of returns)
81503:
$3,182
Colorado:
$2,947
(% of AGI for various income ranges: 0.6% for AGIs below $10k, 0.3% for AGIs $10k-25k, 0.4% for AGIs $25k-50k, 0.3% for AGIs $50k-75k, 0.2% for AGIs $75k-100k, 0.2% for AGIs over 100k)
Self-employed pension: $14,533 (reported on 1.0% of returns)
Here:
$14,533
Colorado:
$13,653
(% of AGI for various income ranges: 0.1% for AGIs $25k-50k, 0.1% for AGIs $50k-75k, 0.1% for AGIs $75k-100k, 0.6% for AGIs over 100k)
Total itemized deductions: $18,325 (21% of AGI, reported on 41.6% of returns)
Here:
$18,325
State:
$20,560
Here:
21.4% of AGI
State:
21.4% of AGI
(% of AGI for various income ranges: 25.9% for AGIs below $10k, 13.7% for AGIs $10k-25k, 15.7% for AGIs $25k-50k, 16.4% for AGIs $50k-75k, 16.6% for AGIs $75k-100k, 12.7% for AGIs over 100k)
Charity contributions deductions: $3,476 (4% of AGI, reported on 34.9% of returns)
Here:
$3,476
State:
$3,518
Here:
3.8% of AGI
State:
3.4% of AGI
(% of AGI for various income ranges: 1.4% for AGIs below $10k, 1.3% for AGIs $10k-25k, 1.6% for AGIs $25k-50k, 2.3% for AGIs $50k-75k, 2.5% for AGIs $75k-100k, 2.8% for AGIs over 100k)
Total tax: $8,300 (reported on 77.3% of returns)
81503:
$8,300
State:
$9,173
(% of AGI for various income ranges: 4.2% for AGIs below $10k, 4.1% for AGIs $10k-25k, 6.6% for AGIs $25k-50k, 8.5% for AGIs $50k-75k, 10.1% for AGIs $75k-100k, 19.1% for AGIs over 100k)
Earned income credit: $1,596 (reported on 12.3% of returns)
Here:
$1,596
State:
$1,595
Percentage of individuals using paid preparers for their 2004 taxes: 59.6%
Here:
60%
State:
55%
(% for various income ranges: 50.8% for AGIs below $10k, 58.2% for AGIs $10k-25k, 60.4% for AGIs $25k-50k, 60.8% for AGIs $50k-75k, 61.2% for AGIs $75k-100k, 73.6% for AGIs over 100k)
Likely homosexual households (counted as self-reported same-sex unmarried-partner households)
Lesbian couples: 0.0% of all households
Gay men: 0.0% of all households
Household received Food Stamps/SNAP in the past 12 months: 671 Household did not receive Food Stamps/SNAP in the past 12 months: 5,780
Women who had a birth in the past 12 months: 350 (258 now married, 89 unmarried) Women who did not have a birth in the past 12 months: 3,159 (1,626 now married, 1,525 unmarried)
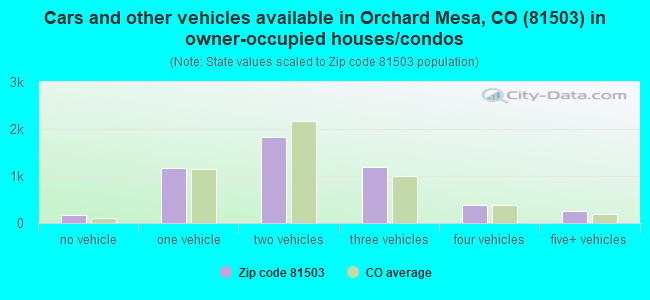
Housing units in zip code 81503 with a mortgage: 3,534 (338 second mortgage, 175 both second mortgage and home equity loan) Houses without a mortgage: 79
Median monthly owner costs for units with a mortgage: $1,419 Median monthly owner costs for units without a mortgage: $374
Residents with income below the poverty level in 2022:
This zip code:
10.7%
Whole state:
9.4%
Residents with income below 50% of the poverty level in 2022:
This zip code:
6.3%
Whole state:
4.6%
Median number of rooms in houses and condos:
Here:
6.0
State:
6.8
Median number of rooms in apartments:
Here:
4.9
State:
4.0
Notable locations in this zip code not listed on our city pages
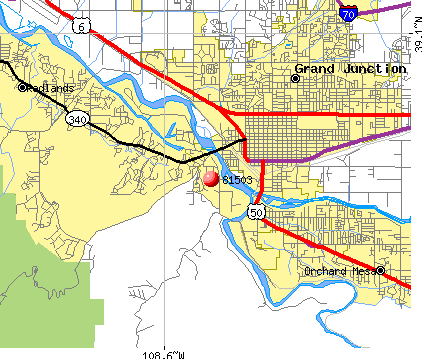
Notable locations in zip code 81503: Uranium Downs (A), Orchard Mesa Rifle Range (B), Central Orchard Mesa Fire Department (C), Grand Junction Fire Department Station 4 (D). Display/hide their locations on the map
2,082 married couples with children.
916 single-parent households (164 men, 752 women).
96.1% of residents of 81503 zip code speak English at home.
3.5% of residents speak Spanish at home (54% very well, 21% well, 18% not well, 8% not at all).
0.4% of residents speak other Indo-European language at home (45% very well, 55% not well).
0.3% of residents speak Asian or Pacific Island language at home (68% very well, 30% well, 2% not well).
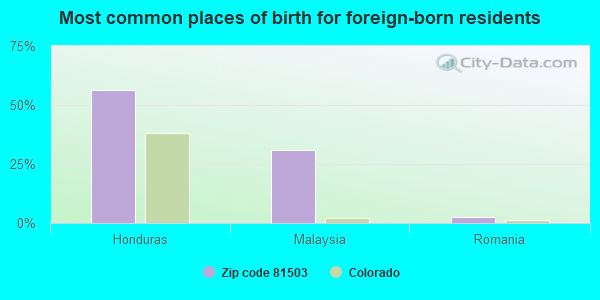
Foreign born population: 435 (2.7%) (23.2% of them are naturalized citizens)
This zip code:
2.7%
Whole state:
9.5%
56%Honduras
31%Malaysia
2%Romania
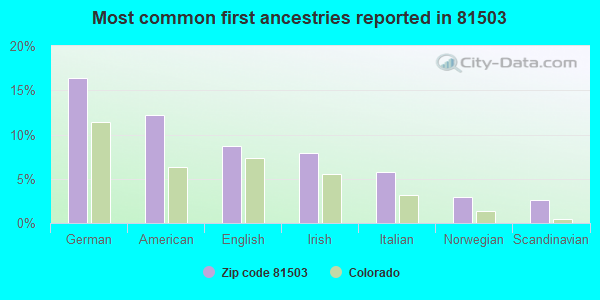
16%German
12%American
9%English
8%Irish
6%Italian
3%Norwegian
3%Scandinavian
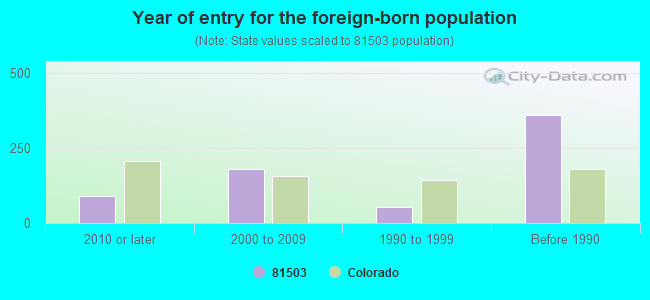
Year of entry for the foreign-born population
912010 or later
1802000 to 2009
521990 to 1999
359Before 1990
Major facilities with environmental interests located in this zip code:
AMETEK DIXSON (287 27 ROAD in GRAND JUNCTION, CO)
STATE MASTER (Colorado database) - RCRAINFO-COD007065543, SQG COMPLIANCE ACTIVITY (Tracking inspections of insecticide, fungicide, and rodenticide, and toxic substances) CRITERIA AND HAZARDOUS AIR POLLUTANT INVENTORY (Inventory of air pollution sources) Small Quantity Generators, between 100 kg and 1000 kg of hazardous waste/month (Resource Conservation and Recovery Act (tracking hazardous waste)) - notification TRI REPORTER (Tracking of toxic chemicals releasing facilities) Business SIC classification: TOTALIZING FLUID METERS AND COUNTING DEVICES Business NAICS classification: TOTALIZING FLUID METER AND COUNTING DEVICE MANUFACTURING. Organizations: DIXSON INC (CONTACT/OPERATOR)
Alternative names: AMETEK DIXSON DIVISION, DIXSON INC, DIXSON INC (AMETEK)
BROADWAY ELEMENTARY SCHOOL (2248 BROADWAY in GRAND JUNCTION, CO)
(National Center for Education Statistics) - STATE ID-1046 Organizations: MESA COUNTY VALLEY 51 (SCHOOL DISTRICT)
BROADWAY FRIENDLY BIBLE CHURCH (100 VISTA GRANDE DRIVE in GRAND JUNCTION, CO)
(Integrated Compliance Information System) - ICIS-08-1989-0213, FORMAL ENFORCEMENT ACTION COMPLIANCE ACTIVITY (Tracking inspections of insecticide, fungicide, and rodenticide, and toxic substances)
CHEM-NUCLEAR GEOTECH INC (2597 B 3/4 ROAD in GRAND JUNCTION, CO)
(Integrated Compliance Information System) - ICIS-08-1993-0221, FORMAL ENFORCEMENT ACTION Business SIC classification: REFUSE SYSTEMS
ALBERTSON'S EXPRESS #897 (2520 BROADWAY in GRAND JUNCTION, CO)
AIR MINOR (AIRS/AFS) CRITERIA AND HAZARDOUS AIR POLLUTANT INVENTORY (Inventory of air pollution sources) Business SIC classification: GROCERY STORES; GASOLINE SERVICE STATIONS Alternative names: ALBERTSONS, INC. - EXPRESS #897
CANYON CONVENIENCE INC 1 (455 N AVE in GRAND JUNCTION, CO)
AIR MINOR (AIRS/AFS) CRITERIA AND HAZARDOUS AIR POLLUTANT INVENTORY (Inventory of air pollution sources) Business SIC classification: GROCERY STORES; GASOLINE SERVICE STATIONS
GRAND JUNCTION, CITY OF (810 W GRANT in GRAND JUNCTION, CO)
(Resource Conservation and Recovery Act (tracking hazardous waste)) Organizations: CITY OF GRAND JUNCTION (CONTACT/OWNER)
BAKER OIL CO (840 US HWY 50 in GRAND JUNCTION, CO)
AIR MINOR (AIRS/AFS) Business SIC classification: GASOLINE SERVICE STATIONS
BIG & LITTLE TRACTOR REPAIR (427 SHERMAN DR in GRAND JUNCTION, CO)
(Resource Conservation and Recovery Act (tracking hazardous waste))
BROWNING FERRIS IND OF CO (2724 US HWY 50 in GRAND JUNCTION, CO)
AIR MINOR (AIRS/AFS) Business SIC classification: LOCAL TRUCKING WITHOUT STORAGE
BLM GRAND JUNCTION DISTRICT (3890 HIGHWAY 50 in GRAND JUNCTION, CO) . Federal Facility. BUREAU OF LAND MANAGEMENT
Conditionally Exempt Small Quantity Generators, less than 100 kg/month of hazardous waste (Resource Conservation and Recovery Act (tracking hazardous waste)) - notification Organizations: US DEPT OF INTERIOR BLM (CONTACT/OWNER)
FRUIT BASKET (253 32 1/2 ROAD in GRAND JUNCTION, CO)
ENFORCEMENT/COMPLIANCE ACTIVITY (Integrated Compliance Information System) COMPLIANCE ACTIVITY (Tracking inspections of insecticide, fungicide, and rodenticide, and toxic substances)
HOISINGTON'S PLANTS AND POTS (270 29 1/2 ROAD in GRAND JUNCTION, CO)
COMPLIANCE ACTIVITY (Tracking inspections of insecticide, fungicide, and rodenticide, and toxic substances)
Housing units lacking complete plumbing facilities: 0.7% Housing units lacking complete kitchen facilities: 0.7%
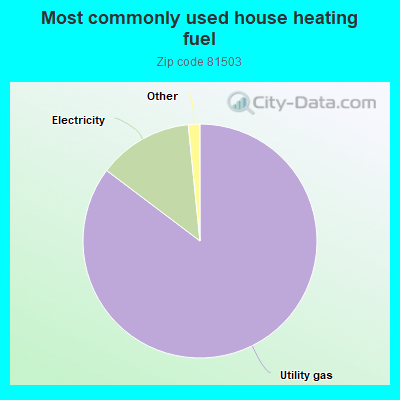
85.3%Utility gas
13.1%Electricity
0.6%Solar energy
0.6%Wood
Population in 1990: 20,467. Population change in the 1990s: +2,940 (+14.4%).
Place of birth for U.S.-born residents:
This state: 8,771
Northeast: 872
Midwest: 1,682
South: 1,317
West: 2,977
50% of the 81503 zip code residents lived in the same house 5 years ago. Out of people who lived in different houses, 52% lived in this county. Out of people who lived in different counties, 50% lived in Colorado.
89% of the 81503 zip code residents lived in the same house 1 year ago. Out of people who lived in different houses, 75% moved from this county. Out of people who lived in different houses, 12% moved from different county within same state. Out of people who lived in different houses, 10% moved from different state.
Private vs. public school enrollment:
Students in private schools in grades 1 to 8 (elementary and middle school): 341
Here:
22.1%
Colorado:
11.4%
Students in private schools in grades 9 to 12 (high school): 33
Here:
5.0%
Colorado:
8.5%
Students in private undergraduate colleges: 30
Here:
6.1%
Colorado:
14.0%
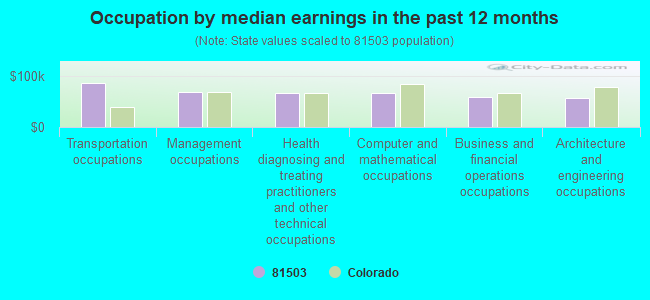
Occupation by median earnings in the past 12 months ($)
85,945Transportation occupations
68,835Management occupations
66,664Health diagnosing and treating practitioners and other technical occupations
65,588Computer and mathematical occupations
58,443Business and financial operations occupations
56,627Architecture and engineering occupations
Companies with federal contracts located in this zip code (GRAND JUNCTION, CO):
AMETEK / DIXSON (287 27 ROAD) : $606,002 in 10 contractsfrom 2001 to 2005
Contracts for Combination and Miscellaneous Instruments, Liquid and Gas Flow, Liquid Level, and Mechanical Motion Measuring Instruments, Pressure, Temperature, and Humidity Measuring and Controlling Instruments by Navy, Defense Logistics Agency Signed by year:2000: $0; 2001: $148,000; 2002: $264,750; 2003: $55,000; 2004: $116,100; 2005: $22,152; 2006: $0.
Biggest contracts:
$165,000 with Navy for Combination and Miscellaneous Instruments. Signed on 2002-03-11. Completion date: 2002-09-12.
$110,000, same as above.Signed on 2004-05-27. Completion date: 2004-10-12.
$99,750 with Defense Logistics Agency for Liquid and Gas Flow, Liquid Level, and Mechanical Motion Measuring Instruments. Signed on 2002-04-16. Completion date: 2002-07-17.
$93,000, same as above.Signed on 2001-03-09. Completion date: 2001-07-15.
$100,000 with Navy for Aircraft Landing Equipment. Signed on 2000-05-04. Completion date: 2000-09-25.
$81,200, same as above.Signed on 2000-03-02. Completion date: 2000-09-05.
ALCO OFFICE CLEANING INC (266 1/2 EAST PARKVIEW DRIV; small business) : $21,111 in 5 contractsfrom 2004 to 2006
Contracts for Custodial Janitorial Services by Army Signed by year:2000: $0; 2001: $0; 2002: $0; 2003: $0; 2004: $5,273; 2005: $7,816; 2006: $8,022.
Biggest contracts:
$8,022 with Army for Custodial Janitorial Services. Signed on 2006-03-29. Completion date: 2005-03-31.
$7,816, same as above.Signed on 2005-03-12. Completion date: 2005-03-31.
$4,420, same as above.Signed on 2004-09-08. Completion date: 2005-03-31.
$853, same as above.Signed on 2004-11-01. Completion date: 2005-03-31.
JNK PRODUCTS, LLC (239 27 1/4 RD STE 5; small business) : $8,300 in 2 contractsfrom 2004 to 2005
$5,400 with Air Force for Floor Coverings. Taking place in AK. Signed on 2005-08-11. Completion date: 2005-07-17.
$2,900 with Navy for Floor Coverings. Signed on 2004-09-29. Completion date: 2004-11-08.
TRIMILLENNIUM CORPORATION (651 20-1/2 ROAD; small business) : $4,316 in 2 contractsin 2004
$4,322 with Army for Antennas, Waveguides, and Related Equipment. Signed on 2004-03-22. Completion date: 2004-04-16.
-$6, same as above.Signed on 2004-08-23. Completion date: 2004-04-16.
Top industries in this zip code by the number of employees in 2005:
Administrative and Support and Waste Management and Remediation Services: All Other Travel Arrangement and Reservation Services (250-499 employees: 1 establishment)
2002 - 2018 National Fire Incident Reporting System (NFIRS) incidents
Based on the data from the years 2002 - 2018 the average number of fire incidents per year is 66. The highest number of fire incidents - 99 took place in 2005, and the least - 22 in 2016. The data has a dropping trend.
When looking into fire subcategories, the most reports belonged to: Outside Fires (47.1%), and Structure Fires (37.5%).
Fire incident types reported to NFIRS in Zip Code 81503

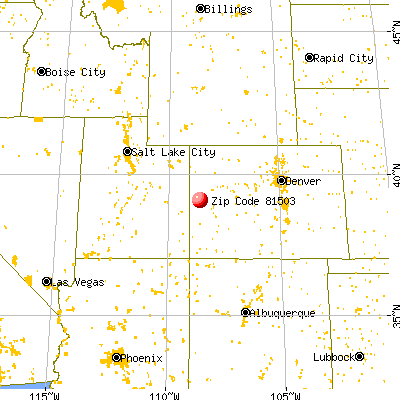


 Nearest zip codes: 81504, 81520, 81526, 81501, 81506, 81507.


 Based on the data from the years 2002 - 2018 the average number of fire incidents per year is 66. The highest number of fire incidents - 99 took place in 2005, and the least - 22 in 2016. The data has a dropping trend.
 When looking into fire subcategories, the most reports belonged to: Outside Fires (47.1%), and Structure Fires (37.5%).