Estimated zip code population in 2022: 50,199 Zip code population in 2010: 38,168 Zip code population in 2000: 33,277
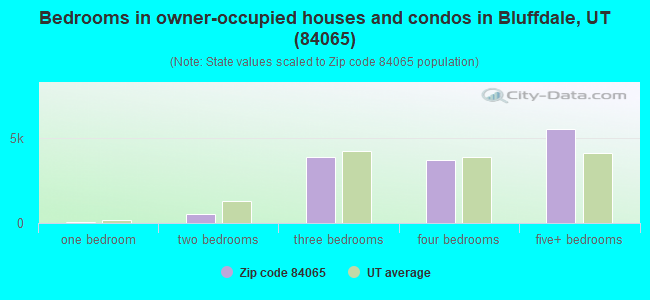
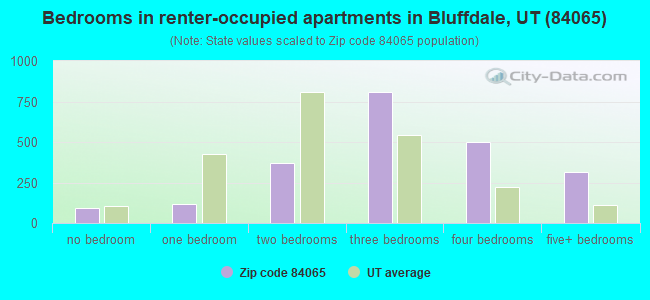
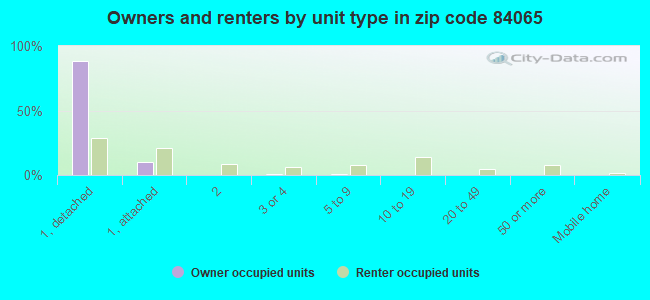
Houses and condos: 15,854 Renter-occupied apartments: 2,186
% of renters here:
14%
State:
29%
March 2022 cost of living index in zip code 84065: 93.6 (less than average, U.S. average is 100)
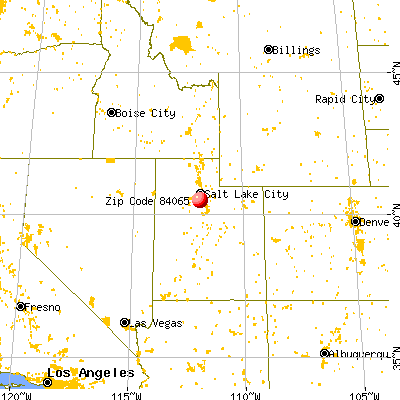
Land area: 20.9 sq. mi. Water area: 0.0 sq. mi.
Population density: 2,407 people per square mile
(low).
OSM Map
General Map
Google Map
MSN Map
OSM Map
General Map
Google Map
MSN Map
OSM Map
General Map
Google Map
MSN Map
OSM Map
General Map
Google Map
MSN Map
Please wait while loading the map...
Real estate property taxes paid for housing units in 2022:
This zip code:
0.5% ($3,184)
Utah:
0.5% ($2,376)
Median real estate property taxes paid for housing units with mortgages in 2022: $3,180 (0.5%) Median real estate property taxes paid for housing units with no mortgage in 2022: $3,205 (0.5%)
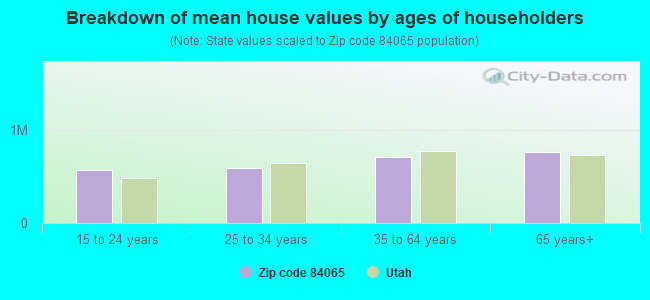
Estimated median house/condo value in 2022: $648,800
84065:
$648,800
Utah:
$499,500
According to our research of Utah and other state lists, there were 54 registered sex offenders living in 84065 zip code as of April 27, 2024. The ratio of all residents to sex offenders in zip code 84065 is 773 to 1. The ratio of registered sex offenders to all residents in this zip code is lower than the state average.
Median resident age:
This zip code:
35.4 years
Utah median age:
32.1 years
Average household size:
This zip code:
3.2 people
Utah:
3.0 people
Averages for the 2020 tax year for zip code 84065, filed in 2021:
Average Adjusted Gross Income (AGI) in 2020: $94,545 (Individual Income Tax Returns)
Here:
$94,545
State:
$81,660
Salary/wage: $76,975 (reported on 89.0% of returns)
Here:
$76,975
State:
$63,027
(% of AGI for various income ranges: 1265.9% for AGIs below $25k, 3949.4% for AGIs $25k-50k, 7034.2% for AGIs $50k-75k, 10353.9% for AGIs $75k-100k, 20494.6% for AGIs $100k-200k, 70296.3% for AGIs over 200k)
Taxable interest for individuals: $1,560 (reported on 32.8% of returns)
This zip code:
$1,560
Utah:
$2,255
(% of AGI for various income ranges: 11.9% for AGIs below $25k, 19.2% for AGIs $25k-50k, 34.1% for AGIs $50k-75k, 58.5% for AGIs $75k-100k, 74.9% for AGIs $100k-200k, 1033.2% for AGIs over 200k)
Ordinary dividends: $3,359 (reported on 17.7% of returns)
Here:
$3,359
State:
$7,362
(% of AGI for various income ranges: 12.0% for AGIs below $25k, 22.0% for AGIs $25k-50k, 34.9% for AGIs $50k-75k, 60.4% for AGIs $75k-100k, 95.7% for AGIs $100k-200k, 1208.1% for AGIs over 200k)
Net capital gain/loss in AGI: +$29,433 (reported on 19.0% of returns)
Here:
+$29,433
State:
+$43,433
(% of AGI for various income ranges: 8.0% for AGIs below $25k, 47.0% for AGIs $25k-50k, 69.6% for AGIs $50k-75k, 129.8% for AGIs $75k-100k, 447.9% for AGIs $100k-200k, 17104.8% for AGIs over 200k)
Profit/loss from business: +$9,579 (reported on 17.8% of returns)
Here:
+$9,579
State:
+$9,957
(% of AGI for various income ranges: 88.1% for AGIs below $25k, 170.1% for AGIs $25k-50k, 173.9% for AGIs $50k-75k, 213.2% for AGIs $75k-100k, 306.5% for AGIs $100k-200k, 2017.9% for AGIs over 200k)
Taxable individual retirement arrangement distribution: $18,871 (reported on 6.0% of returns)
84065:
$18,871
Utah:
$21,167
(% of AGI for various income ranges: 34.8% for AGIs below $25k, 66.9% for AGIs $25k-50k, 109.6% for AGIs $50k-75k, 248.8% for AGIs $75k-100k, 373.9% for AGIs $100k-200k, 740.0% for AGIs over 200k)
Self-employed (Keogh) retirement plans: $25,371 (reported on 0.3% of returns)
84065:
$25,371
Utah:
$29,069
(% of AGI for various income ranges: 15.9% for AGIs $100k-200k, 214.2% for AGIs over 200k)
Total itemized deductions: $37,668 (reported on 22.0% of returns)
Here:
$37,668
State:
$41,056
(% of AGI for various income ranges: 44.5% for AGIs below $25k, 163.8% for AGIs $25k-50k, 541.0% for AGIs $50k-75k, 1033.9% for AGIs $75k-100k, 2638.2% for AGIs $100k-200k, 11830.8% for AGIs over 200k)
Charity contributions: $17,899 (reported on 19.7% of returns)
Here:
$17,899
State:
$22,261
(% of AGI for various income ranges: 6.0% for AGIs below $25k, 34.3% for AGIs $25k-50k, 113.0% for AGIs $50k-75k, 280.8% for AGIs $75k-100k, 970.6% for AGIs $100k-200k, 6865.2% for AGIs over 200k)
Taxes paid: $8,461 (reported on 22.0% of returns)
84065:
$8,461
State:
$7,985
(% of AGI for various income ranges: 7.0% for AGIs below $25k, 33.6% for AGIs $25k-50k, 127.1% for AGIs $50k-75k, 267.3% for AGIs $75k-100k, 716.4% for AGIs $100k-200k, 2004.8% for AGIs over 200k)
Earned income credit: $2,155 (reported on 8.7% of returns)
Here:
$2,155
State:
$2,169
(% of AGI for various income ranges: 51.8% for AGIs below $25k, 58.1% for AGIs $25k-50k, 1.9% for AGIs $50k-75k)
Percentage of individuals using paid preparers for their 2020 taxes: 94.4%
Here:
94%
State:
94%
(% for various income ranges: 92.1% for AGIs below $25k, 94.8% for AGIs $25k-50k, 95.3% for AGIs $50k-75k, 95.9% for AGIs $75k-100k, 94.8% for AGIs $100k-200k, 95.6% for AGIs over 200k)
Averages for the 2012 tax year for zip code 84065, filed in 2013:
Average Adjusted Gross Income (AGI) in 2012: $67,015 (Individual Income Tax Returns)
Here:
$67,015
State:
$60,327
Salary/wage: $57,060 (reported on 90.6% of returns)
Here:
$57,060
State:
$48,762
(% of AGI for various income ranges: 83.9% for AGIs below $25k, 82.2% for AGIs $25k-50k, 83.7% for AGIs $50k-75k, 85.1% for AGIs $75k-100k, 83.7% for AGIs $100k-200k, 50.9% for AGIs over 200k)
Taxable interest for individuals: $1,116 (reported on 39.3% of returns)
This zip code:
$1,116
Utah:
$1,534
(% of AGI for various income ranges: 0.6% for AGIs below $25k, 0.5% for AGIs $25k-50k, 0.4% for AGIs $50k-75k, 0.3% for AGIs $75k-100k, 0.5% for AGIs $100k-200k, 1.5% for AGIs over 200k)
Ordinary dividends: $3,137 (reported on 14.7% of returns)
Here:
$3,137
State:
$5,711
(% of AGI for various income ranges: 0.7% for AGIs below $25k, 0.5% for AGIs $25k-50k, 0.3% for AGIs $50k-75k, 0.3% for AGIs $75k-100k, 0.4% for AGIs $100k-200k, 1.8% for AGIs over 200k)
Net capital gain/loss in AGI: +$16,345 (reported on 13.6% of returns)
Here:
+$16,345
State:
+$23,734
(% of AGI for various income ranges: 0.3% for AGIs $25k-50k, 0.2% for AGIs $50k-75k, 0.5% for AGIs $75k-100k, 0.8% for AGIs $100k-200k, 14.5% for AGIs over 200k)
Profit/loss from business: +$7,952 (reported on 16.9% of returns)
Here:
+$7,952
State:
+$8,845
(% of AGI for various income ranges: 5.2% for AGIs below $25k, 3.3% for AGIs $25k-50k, 1.7% for AGIs $50k-75k, 1.7% for AGIs $75k-100k, 1.7% for AGIs $100k-200k, 1.4% for AGIs over 200k)
Taxable individual retirement arrangement distribution: $13,929 (reported on 6.4% of returns)
84065:
$13,929
Utah:
$15,565
(% of AGI for various income ranges: 1.8% for AGIs below $25k, 1.8% for AGIs $25k-50k, 1.5% for AGIs $50k-75k, 1.2% for AGIs $75k-100k, 1.5% for AGIs $100k-200k, 0.7% for AGIs over 200k)
Self-employment retirement plans: $20,267 (reported on 0.2% of returns)
84065:
$20,267
Utah:
$22,655
Total itemized deductions: $25,922 (24% of AGI, reported on 48.7% of returns)
Here:
$25,922
State:
$25,197
Here:
23.8% of AGI
State:
22.4% of AGI
(% of AGI for various income ranges: 10.2% for AGIs below $25k, 15.6% for AGIs $25k-50k, 21.1% for AGIs $50k-75k, 22.4% for AGIs $75k-100k, 21.1% for AGIs $100k-200k, 14.6% for AGIs over 200k)
Charity contributions: $7,988 (reported on 43.8% of returns)
Here:
$7,988
State:
$8,502
(% of AGI for various income ranges: 1.6% for AGIs below $25k, 3.0% for AGIs $25k-50k, 4.9% for AGIs $50k-75k, 5.8% for AGIs $75k-100k, 6.1% for AGIs $100k-200k, 5.7% for AGIs over 200k)
Taxes paid: $7,313 (reported on 48.5% of returns)
84065:
$7,313
State:
$7,001
(% of AGI for various income ranges: 1.7% for AGIs below $25k, 3.2% for AGIs $25k-50k, 5.2% for AGIs $50k-75k, 5.9% for AGIs $75k-100k, 6.2% for AGIs $100k-200k, 5.4% for AGIs over 200k)
Earned income credit: $2,298 (reported on 12.5% of returns)
Here:
$2,298
State:
$2,259
(% of AGI for various income ranges: 5.1% for AGIs below $25k, 1.4% for AGIs $25k-50k)
Percentage of individuals using paid preparers for their 2012 taxes: 50.2%
Here:
50%
State:
51%
(% for various income ranges: 44.0% for AGIs below $25k, 49.8% for AGIs $25k-50k, 51.9% for AGIs $50k-75k, 52.0% for AGIs $75k-100k, 55.2% for AGIs $100k-200k, 74.0% for AGIs over 200k)
Averages for the 2004 tax year for zip code 84065, filed in 2005:
Average Adjusted Gross Income (AGI) in 2004: $49,802 (Individual Income Tax Returns)
Here:
$49,802
State:
$45,498
Salary/wage: $46,093 (reported on 92.2% of returns)
Here:
$46,093
State:
$38,975
(% of AGI for various income ranges: 180.7% for AGIs below $10k, 83.8% for AGIs $10k-25k, 87.1% for AGIs $25k-50k, 89.9% for AGIs $50k-75k, 89.4% for AGIs $75k-100k, 73.6% for AGIs over 100k)
Taxable interest for individuals: $789 (reported on 50.7% of returns)
This zip code:
$789
Utah:
$1,445
(% of AGI for various income ranges: 5.2% for AGIs below $10k, 1.2% for AGIs $10k-25k, 0.6% for AGIs $25k-50k, 0.5% for AGIs $50k-75k, 0.6% for AGIs $75k-100k, 1.2% for AGIs over 100k)
Taxable dividends: $1,368 (reported on 16.1% of returns)
Here:
$1,368
State:
$3,152
(% of AGI for various income ranges: 2.2% for AGIs below $10k, 0.5% for AGIs $10k-25k, 0.2% for AGIs $25k-50k, 0.2% for AGIs $50k-75k, 0.3% for AGIs $75k-100k, 0.9% for AGIs over 100k)
Net capital gain/loss: +$8,577 (reported on 15.1% of returns)
Here:
+$8,577
State:
+$14,059
(% of AGI for various income ranges: 0.1% for AGIs below $10k, 0.4% for AGIs $10k-25k, 0.3% for AGIs $25k-50k, 0.6% for AGIs $50k-75k, 0.8% for AGIs $75k-100k, 8.1% for AGIs over 100k)
Profit/loss from business: +$6,138 (reported on 19.7% of returns)
Here:
+$6,138
State:
+$6,903
(% of AGI for various income ranges: 7.9% for AGIs below $10k, 5.6% for AGIs $10k-25k, 3.3% for AGIs $25k-50k, 1.4% for AGIs $50k-75k, 1.6% for AGIs $75k-100k, 2.7% for AGIs over 100k)
IRA payment deduction: $2,727 (reported on 2.0% of returns)
84065:
$2,727
Utah:
$2,970
(% of AGI for various income ranges: 0.1% for AGIs $10k-25k, 0.1% for AGIs $25k-50k, 0.1% for AGIs $50k-75k, 0.1% for AGIs $75k-100k, 0.1% for AGIs over 100k)
Self-employed pension: $10,297 (reported on 0.2% of returns)
Here:
$10,297
Utah:
$14,916
Total itemized deductions: $20,350 (28% of AGI, reported on 56.5% of returns)
Here:
$20,350
State:
$20,312
Here:
27.9% of AGI
State:
24.9% of AGI
(% of AGI for various income ranges: 20.5% for AGIs below $10k, 13.9% for AGIs $10k-25k, 25.1% for AGIs $25k-50k, 26.3% for AGIs $50k-75k, 24.4% for AGIs $75k-100k, 19.6% for AGIs over 100k)
Charity contributions deductions: $5,000 (7% of AGI, reported on 52.2% of returns)
Here:
$5,000
State:
$6,250
Here:
6.7% of AGI
State:
7.4% of AGI
(% of AGI for various income ranges: 1.8% for AGIs below $10k, 2.3% for AGIs $10k-25k, 4.6% for AGIs $25k-50k, 5.5% for AGIs $50k-75k, 5.7% for AGIs $75k-100k, 5.8% for AGIs over 100k)
Total tax: $5,199 (reported on 75.7% of returns)
84065:
$5,199
State:
$6,523
(% of AGI for various income ranges: 4.5% for AGIs below $10k, 4.5% for AGIs $10k-25k, 4.5% for AGIs $25k-50k, 5.4% for AGIs $50k-75k, 7.2% for AGIs $75k-100k, 13.9% for AGIs over 100k)
Earned income credit: $1,718 (reported on 9.2% of returns)
Here:
$1,718
State:
$1,703
Percentage of individuals using paid preparers for their 2004 taxes: 51.5%
Here:
52%
State:
53%
(% for various income ranges: 39.2% for AGIs below $10k, 49.2% for AGIs $10k-25k, 55.2% for AGIs $25k-50k, 54.5% for AGIs $50k-75k, 53.6% for AGIs $75k-100k, 59.5% for AGIs over 100k)
Household received Food Stamps/SNAP in the past 12 months: 310 Household did not receive Food Stamps/SNAP in the past 12 months: 15,441
Women who had a birth in the past 12 months: 600 (592 now married, 16 unmarried) Women who did not have a birth in the past 12 months: 11,529 (6,628 now married, 4,867 unmarried)
Housing units in zip code 84065 with a mortgage: 10,009 (1,727 second mortgage, 26 home equity loan, 1,605 both second mortgage and home equity loan) Houses without a mortgage: 234
Median monthly owner costs for units with a mortgage: $2,242 Median monthly owner costs for units without a mortgage: $627
Residents with income below the poverty level in 2022:
This zip code:
3.1%
Whole state:
8.2%
Residents with income below 50% of the poverty level in 2022:
This zip code:
1.7%
Whole state:
4.3%
Median number of rooms in houses and condos:
Here:
8.4
State:
7.6
Median number of rooms in apartments:
Here:
5.7
State:
4.3
Notable locations in this zip code not listed on our city pages
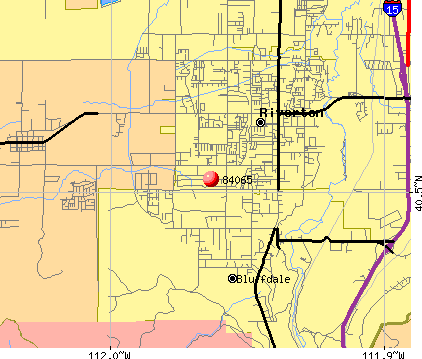
Notable locations in zip code 84065: Riverton Plaza (A), Mount (B), Unified Fire Authority Station 120 (C), Riverton Community Center (D), Bluffdale Fire Department (E). Display/hide their locations on the map
Cemeteries: Wasatch Lawn Memorial Park South (1), Utah Veterans Memorial Park (2), Bluffdale City Cemetery (3), Riverton City Cemetery (4). Display/hide their locations on the map
12,408 married couples with children.
1,346 single-parent households (430 men, 916 women).
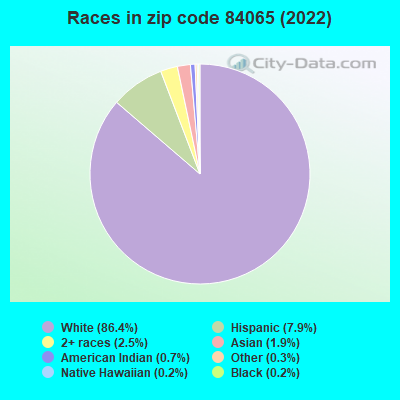
91.3% of residents of 84065 zip code speak English at home.
5.0% of residents speak Spanish at home (74% very well, 9% well, 7% not well, 11% not at all).
1.7% of residents speak other Indo-European language at home (90% very well, 8% well, 2% not well).
1.5% of residents speak Asian or Pacific Island language at home (83% very well, 13% well, 4% not well).
0.1% of residents speak other language at home (100% very well).
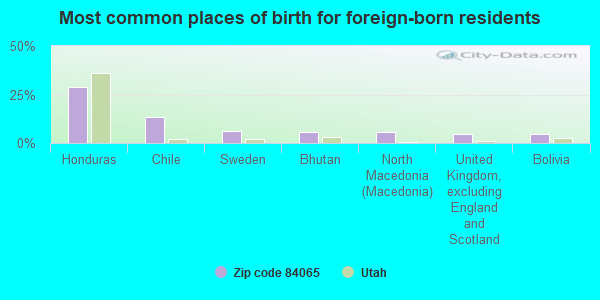
Foreign born population: 2,275 (4.5%) (46.0% of them are naturalized citizens)
This zip code:
4.5%
Whole state:
8.6%
29%Honduras
13%Chile
6%Sweden
6%Bhutan
6%North Macedonia (Macedonia)
5%United Kingdom, excluding England and Scotland
5%Bolivia
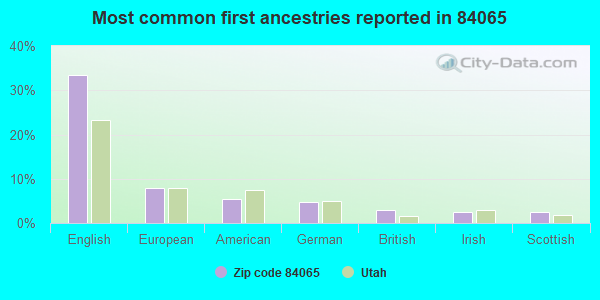
33%English
8%European
5%American
5%German
3%British
3%Irish
3%Scottish
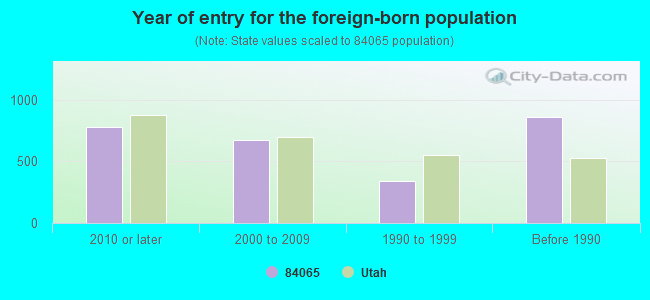
Year of entry for the foreign-born population
7772010 or later
6692000 to 2009
3431990 to 1999
855Before 1990
Major facilities with environmental interests located in this zip code:
BULLFROG INTERNATIONAL LC (668 WEST 14600 SOUTH in BLUFFDALE, UT)
ENFORCEMENT/COMPLIANCE ACTIVITY (Integrated Compliance Information System) - ICIS-08-2005-0028, FORMAL ENFORCEMENT ACTION (Integrated Compliance Information System) - ICIS-08-2005-0028, FORMAL ENFORCEMENT ACTION TRI REPORTER (Tracking of toxic chemicals releasing facilities) Business SIC classification: PLASTICS PRODUCTS
AT&T RIVERTON (2000 WEST 12600 SOUTH in RIVERTON, UT)
STATE MASTER (Utah compliance and permitting operations) - POST CLOSURE CARE DA-18, POST CLOSURE CARE SITE, UST DATABASE-4, UNDERGROUND STORAGE TANK PROGRAM (Resource Conservation and Recovery Act (tracking hazardous waste)) Organizations: AMERICAN TELEPHONE AND TELEGRAPH (CONTACT/OWNER)
Alternative names: AT&T RIVERTON #L51067
BLUFFDALE ELEM SCH (14323 S 2700 W in BLUFFDALE, UT)
(National Center for Education Statistics) - STATE ID-14 109 Organizations: JORDAN SCHOOL DISTRICT (SCHOOL DISTRICT)
JEAN MASSIEU SCHOOL (12830 S REDWOOD RD in RIVERTON, UT)
(National Center for Education Statistics) - STATE ID-85 100 Organizations: JEAN MASSIEU SCH AGENCY (SCHOOL DISTRICT)
HERRIMAN ELEM SCH (13170 S 6000 W in HERRIMAN, UT)
(National Center for Education Statistics) - STATE ID-14 136 Organizations: JORDAN SCHOOL DISTRICT (SCHOOL DISTRICT)
CAMP WILLIAMS (RFD #1 in RIVERTON, UT)
(Integrated Compliance Information System) - ICIS-08-1992-0310, FORMAL ENFORCEMENT ACTION
BLUFFDALE WATER SYS (14212 S 3600 W in BLUFFDALE, UT)
(Integrated Compliance Information System) - ICIS-08-1992-0302, FORMAL ENFORCEMENT ACTION
CANYONVIEW PARK SUBDIVISION (4300 W 12600 S in RIVERTON, UT)
National Pollutant Discharge Elimination System NON-MAJOR (Tracking pollutant discharge elimination systems) - permit Business SIC classification: GENERAL CONTRACTORS-SINGLE-FAMILY HOUSES
1300 WEST STREET EXPANSION (9400 S TO 10400 S in SOUTH JORDAN, UT)
National Pollutant Discharge Elimination System NON-MAJOR (Tracking pollutant discharge elimination systems) - permit Business SIC classification: NONCLASSIFIABLE ESTABLISHMENTS
FLUID SPILLED OVER ROAD & HWY (LOCATION NOT A FACILITY in HERRIMAN, UT)
National Pollutant Discharge Elimination System NON-MAJOR (Tracking pollutant discharge elimination systems) - permit Business SIC classification: NONCLASSIFIABLE ESTABLISHMENTS
ALTARA ELEMENTARY SCHOOL (840 EAST 11000 SOUTH in SALT LAKE CITY, UT)
AIR MINOR (AIRS/AFS) Business SIC classification: ELEMENTARY AND SECONDARY SCHOOLS
HARPER CONTRACTING/FUTURE MONROC (POINT OF THE MOUNTAIN PIT in BLUFFDALE, UT)
AIR MINOR (AIRS/AFS) Business SIC classification: CONSTRUCTION SAND AND GRAVEL
HOME DEPOT USA, INC. HD #8566 (3852 WEST 13400 SOUTH in RIVERTON, UT)
Conditionally Exempt Small Quantity Generators, less than 100 kg/month of hazardous waste (Resource Conservation and Recovery Act (tracking hazardous waste))
Housing units lacking complete plumbing facilities: 0.0% Housing units lacking complete kitchen facilities: 0.1%
92.0%Utility gas
7.2%Electricity
0.6%Bottled, tank, or LP gas
Population in 1990: 28,444. Population change in the 1990s: +4,833 (+17.0%).
Place of birth for U.S.-born residents:
This state: 34,748
Northeast: 859
Midwest: 2,117
South: 1,794
West: 7,848
50% of the 84065 zip code residents lived in the same house 5 years ago. Out of people who lived in different houses, 74% lived in this county. Out of people who lived in different counties, 50% lived in Utah.
89% of the 84065 zip code residents lived in the same house 1 year ago. Out of people who lived in different houses, 55% moved from this county. Out of people who lived in different houses, 20% moved from different county within same state. Out of people who lived in different houses, 22% moved from different state. Out of people who lived in different houses, 3% moved from abroad.
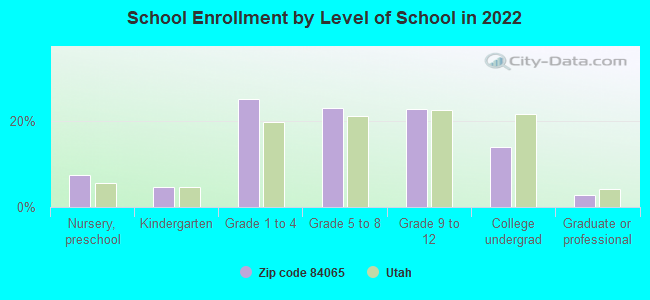
Private vs. public school enrollment:
Students in private schools in grades 1 to 8 (elementary and middle school): 951
Here:
13.1%
Utah:
7.2%
Students in private schools in grades 9 to 12 (high school): 28
Here:
0.8%
Utah:
5.3%
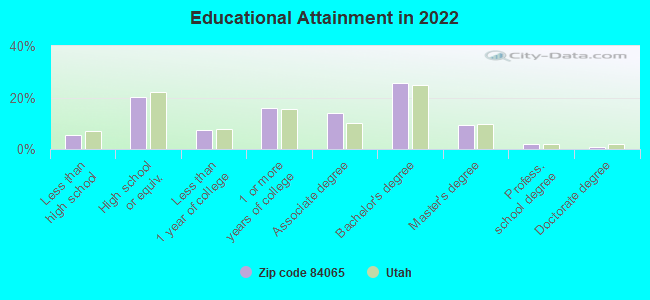
Students in private undergraduate colleges: 316
Here:
14.8%
Utah:
26.7%
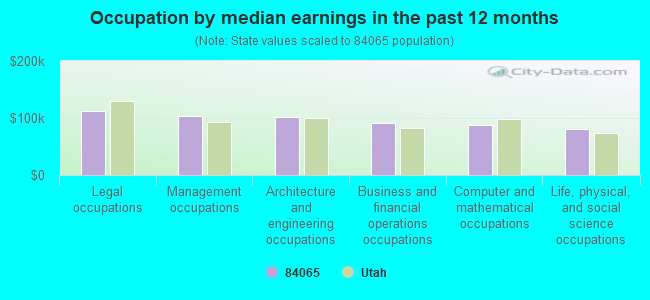
Occupation by median earnings in the past 12 months ($)
112,731Legal occupations
104,202Management occupations
100,976Architecture and engineering occupations
91,258Business and financial operations occupations
87,810Computer and mathematical occupations
81,398Life, physical, and social science occupations
Companies with federal contracts located in this zip code:
NITTANY SCIENTIFIC INC (1733 W 12600 S STE 420 in RIVERTON, UT; small business) : $2,380,574 in 33 contractsfrom 1999 to 2005
Contracts for Other Defense -- Management and Support (R&D), Antennas, Waveguides, and Related Equipment, Communications Security Equipment and Components, Other Defense -- Operational Systems Development (R&D), and moreby Navy Signed by year:2000: $30,000; 2001: $361,878; 2002: $24,876; 2003: $304,320; 2004: $889,100; 2005: $700,400; 2006: $0.
Biggest contracts:
$211,878 with Navy for Other Defense -- Management and Support (R&D). Signed on 2001-08-06. Completion date: 2003-03-30.
$177,200 with Navy for Antennas, Waveguides, and Related Equipment. Taking place in TX. Signed on 2005-01-19. Completion date: 2005-07-29.
$177,200 with Navy for Antennas, Waveguides, and Related Equipment. Signed on 2005-05-02. Completion date: 2005-11-02.
$168,000, same as above.Signed on 2004-07-21. Completion date: 2004-09-15.
K O H MECHANICAL CONTRACTORS, (1273 W 12400 S in RIVERTON, UT) : $958,923 in 3 contractsfrom 2002 to 2003
$916,000 with Air Force for Maintenance, Repair or Alteration of Real Property -- Other Conservation and Development Facilities. Signed on 2002-12-20. Completion date: 2003-07-15.
$30,482, same as above.Signed on 2003-08-13. Completion date: 2003-09-15.
$12,441 with Air Force for Maintenance, Repair or Alteration of Real Property -- Other Conservation and Development Facilities. Taking place in NV. Signed on 2003-04-16. Completion date: 2003-08-14.
TTI ARMORY (14884 HERITAGECREST WAY in RIVERTON, UT; small business) : $209,043 in 3 contractsin 2004
$99,483 with Navy for Ammunition, over 125 mm. Signed on 2004-07-20. Completion date: 2004-09-13.
$96,000 with Navy for Cartridge and Propellant Actuated Devices and Components. Signed on 2004-10-27. Completion date: 2005-06-15.
$13,560 with Federal Emergency Management Agency for Ammunition, over 30 mm up to 75 mm. Signed on 2004-09-22. Completion date: 2004-10-18.
LAYTON ROOFING COMPANY, INC (14745 HERITAGECREST WAY in BLUFFDALE, UT; small business) : $79,016 in 5 contractsfrom 2002 to 2003
Contracts for Maintenance, Repair or Alteration of Real Property -- Maintenance Buildings, Maintenance, Repair or Alteration of Real Property -- Other Administrative Facilities and Service Buildings, Facilities Operations Support Services by Army Signed by year:2000: $0; 2001: $0; 2002: $50,046; 2003: $28,970; 2004: $0; 2005: $0; 2006: $0.
Biggest contracts:
$28,970 with Army for Maintenance, Repair or Alteration of Real Property -- Maintenance Buildings. Signed on 2003-05-06. Completion date: 2003-06-19.
$21,780 with Army for Maintenance, Repair or Alteration of Real Property -- Other Administrative Facilities and Service Buildings. Signed on 2002-08-27. Completion date: 2002-09-27.
$13,850, same as above.Signed on 2002-08-27. Completion date: 2002-09-27.
$13,580 with Army for Facilities Operations Support Services. Signed on 2002-07-25. Completion date: 2002-09-30.
OQUIRRHBERG KENNELS (7185 WEST 13830 SOUTH in HERRIMAN, UT; small business) : $67,612 in 9 contractsfrom 2002 to 2006
Contracts for Quality Control Services -- Live Animals, Surveillance Services, Miscellaneous Materials Handling Equipment by Army Signed by year:2000: $0; 2001: $0; 2002: $14,400; 2003: $3,000; 2004: $38,800; 2005: $21,200; 2006: -$9,788.
Biggest contracts:
$21,600 with Army for Quality Control Services -- Live Animals. Signed on 2005-12-15. Completion date: 2007-01-31.
$21,600, same as above.Signed on 2004-12-13. Completion date: 2006-01-31.
$16,000, same as above.Signed on 2004-01-29. Completion date: 2005-01-30.
$14,400 with Army for Surveillance Services. Signed on 2002-01-17. Completion date: 2002-12-31.
TOWN AND COUNTRY CLEANING (17800 SOUTH CAMP WILLIAMS in RIVERTON, UT; small business)
$36,000 with Army for Patent and Trademark Services. Signed on 2004-05-10. Completion date: 2005-05-09.
RIVERBEND DENTAL (12684 S REDWOOD ROAD in RIVERTON, UT; small business) : $10,812 in 2 contractsin 2003
$6,812 with Army for Dentistry Services. Signed on 2003-04-14. Completion date: 2003-02-07.
$4,000 with Army for Anesthesiology Services. Signed on 2003-03-12. Completion date: 2003-03-13.
Top industries in this zip code by the number of employees in 2005:
Management of Companies and Enterprises: Corporate, Subsidiary, and Regional Managing Offices (250-499 employees: 1 establishment)
2002 - 2018 National Fire Incident Reporting System (NFIRS) incidents
Based on the data from the years 2002 - 2018 the average number of fire incidents per year is 80. The highest number of reported fire incidents - 168 took place in 2006, and the least - 40 in 2010. The data has an increasing trend.
When looking into fire subcategories, the most reports belonged to: Outside Fires (43.9%), and Structure Fires (36.3%).
Fire incident types reported to NFIRS in Zip Code 84065


 Nearest zip codes: 84095, 84020, 84070, 84088, 84094, 84043.


 Based on the data from the years 2002 - 2018 the average number of fire incidents per year is 80. The highest number of reported fire incidents - 168 took place in 2006, and the least - 40 in 2010. The data has an increasing trend.
 When looking into fire subcategories, the most reports belonged to: Outside Fires (43.9%), and Structure Fires (36.3%).