Estimated zip code population in 2022: 19,748 Zip code population in 2010: 15,822 Zip code population in 2000: 12,393
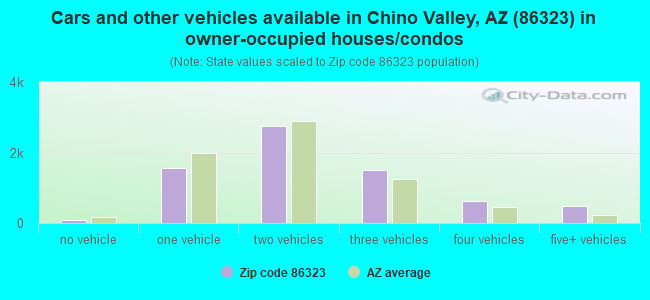
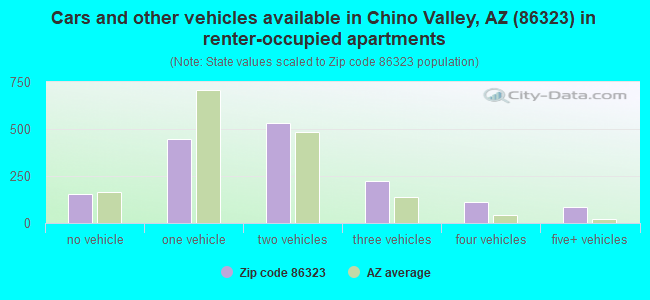
Houses and condos: 9,057 Renter-occupied apartments: 1,527
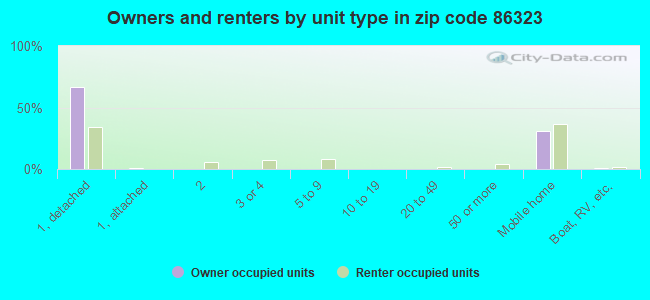
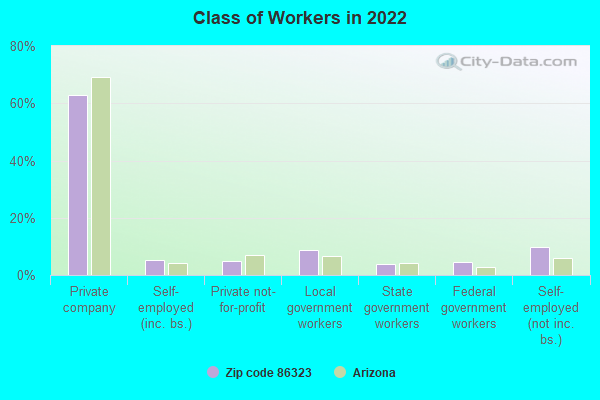
% of renters here:
18%
State:
33%
March 2022 cost of living index in zip code 86323: 94.2 (less than average, U.S. average is 100)
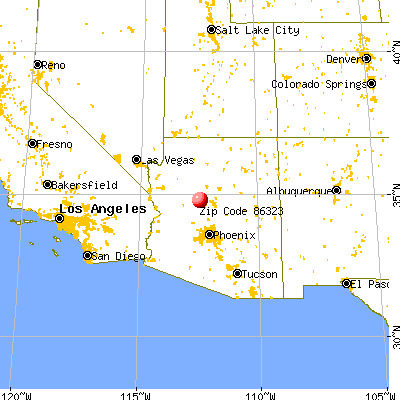
Land area: 141.7 sq. mi. Water area: 0.0 sq. mi.
Population density: 139 people per square mile
(very low).
OSM Map
General Map
Google Map
MSN Map
OSM Map
General Map
Google Map
MSN Map
OSM Map
General Map
Google Map
MSN Map
OSM Map
General Map
Google Map
MSN Map
Please wait while loading the map...
Real estate property taxes paid for housing units in 2022:
This zip code:
0.4% ($1,387)
Arizona:
0.4% ($1,786)
Median real estate property taxes paid for housing units with mortgages in 2022: $1,392 (0.3%) Median real estate property taxes paid for housing units with no mortgage in 2022: $1,383 (0.4%)
Averages for the 2020 tax year for zip code 86323, filed in 2021:
Average Adjusted Gross Income (AGI) in 2020: $54,108 (Individual Income Tax Returns)
Here:
$54,108
State:
$73,499
Salary/wage: $46,047 (reported on 71.1% of returns)
Here:
$46,047
State:
$59,499
(% of AGI for various income ranges: 1107.1% for AGIs below $25k, 3417.9% for AGIs $25k-50k, 6080.8% for AGIs $50k-75k, 9067.6% for AGIs $75k-100k, 17108.0% for AGIs $100k-200k, 60452.5% for AGIs over 200k)
Taxable interest for individuals: $1,644 (reported on 25.3% of returns)
This zip code:
$1,644
Arizona:
$2,325
(% of AGI for various income ranges: 28.8% for AGIs below $25k, 29.4% for AGIs $25k-50k, 40.0% for AGIs $50k-75k, 68.7% for AGIs $75k-100k, 211.2% for AGIs $100k-200k, 2187.5% for AGIs over 200k)
Ordinary dividends: $3,533 (reported on 14.8% of returns)
Here:
$3,533
State:
$8,711
(% of AGI for various income ranges: 31.6% for AGIs below $25k, 41.3% for AGIs $25k-50k, 98.3% for AGIs $50k-75k, 107.6% for AGIs $75k-100k, 270.4% for AGIs $100k-200k, 1332.5% for AGIs over 200k)
Net capital gain/loss in AGI: +$11,541 (reported on 15.9% of returns)
Here:
+$11,541
State:
+$31,332
(% of AGI for various income ranges: 4.8% for AGIs below $25k, 35.6% for AGIs $25k-50k, 83.9% for AGIs $50k-75k, 215.2% for AGIs $75k-100k, 1050.4% for AGIs $100k-200k, 22042.5% for AGIs over 200k)
Profit/loss from business: +$11,439 (reported on 16.2% of returns)
Here:
+$11,439
State:
+$13,214
(% of AGI for various income ranges: 164.6% for AGIs below $25k, 142.0% for AGIs $25k-50k, 297.1% for AGIs $50k-75k, 505.0% for AGIs $75k-100k, 494.3% for AGIs $100k-200k, 7595.0% for AGIs over 200k)
Taxable individual retirement arrangement distribution: $16,710 (reported on 12.2% of returns)
86323:
$16,710
Arizona:
$23,364
(% of AGI for various income ranges: 89.3% for AGIs below $25k, 132.6% for AGIs $25k-50k, 363.8% for AGIs $50k-75k, 481.1% for AGIs $75k-100k, 1279.2% for AGIs $100k-200k, 4975.0% for AGIs over 200k)
Total itemized deductions: $30,010 (reported on 6.6% of returns)
Here:
$30,010
State:
$36,308
(% of AGI for various income ranges: 56.8% for AGIs below $25k, 130.4% for AGIs $25k-50k, 275.0% for AGIs $50k-75k, 543.0% for AGIs $75k-100k, 1162.5% for AGIs $100k-200k, 8412.5% for AGIs over 200k)
Charity contributions: $7,841 (reported on 5.3% of returns)
Here:
$7,841
State:
$11,955
(% of AGI for various income ranges: 4.8% for AGIs below $25k, 18.1% for AGIs $25k-50k, 50.3% for AGIs $50k-75k, 68.5% for AGIs $75k-100k, 266.5% for AGIs $100k-200k, 3065.0% for AGIs over 200k)
Taxes paid: $5,382 (reported on 6.6% of returns)
86323:
$5,382
State:
$6,820
(% of AGI for various income ranges: 7.2% for AGIs below $25k, 17.6% for AGIs $25k-50k, 44.3% for AGIs $50k-75k, 93.5% for AGIs $75k-100k, 249.4% for AGIs $100k-200k, 1577.5% for AGIs over 200k)
Earned income credit: $2,229 (reported on 16.0% of returns)
Here:
$2,229
State:
$2,383
(% of AGI for various income ranges: 89.8% for AGIs below $25k, 74.3% for AGIs $25k-50k, 1.8% for AGIs $50k-75k)
Percentage of individuals using paid preparers for their 2020 taxes: 93.5%
Here:
93%
State:
93%
(% for various income ranges: 92.4% for AGIs below $25k, 94.7% for AGIs $25k-50k, 93.5% for AGIs $50k-75k, 93.5% for AGIs $75k-100k, 93.5% for AGIs $100k-200k, 94.4% for AGIs over 200k)
Averages for the 2012 tax year for zip code 86323, filed in 2013:
Average Adjusted Gross Income (AGI) in 2012: $41,408 (Individual Income Tax Returns)
Here:
$41,408
State:
$57,644
Salary/wage: $35,839 (reported on 75.2% of returns)
Here:
$35,839
State:
$47,932
(% of AGI for various income ranges: 65.6% for AGIs below $25k, 70.0% for AGIs $25k-50k, 67.7% for AGIs $50k-75k, 63.0% for AGIs $75k-100k, 64.2% for AGIs $100k-200k, 41.4% for AGIs over 200k)
Taxable interest for individuals: $1,317 (reported on 29.2% of returns)
This zip code:
$1,317
Arizona:
$2,064
(% of AGI for various income ranges: 1.8% for AGIs below $25k, 1.0% for AGIs $25k-50k, 0.7% for AGIs $50k-75k, 0.5% for AGIs $75k-100k, 0.8% for AGIs $100k-200k, 0.6% for AGIs over 200k)
Ordinary dividends: $2,689 (reported on 14.7% of returns)
Here:
$2,689
State:
$7,268
(% of AGI for various income ranges: 1.4% for AGIs below $25k, 1.1% for AGIs $25k-50k, 0.9% for AGIs $50k-75k, 0.6% for AGIs $75k-100k, 0.9% for AGIs $100k-200k, 0.7% for AGIs over 200k)
Net capital gain/loss in AGI: +$3,003 (reported on 12.9% of returns)
Here:
+$3,003
State:
+$15,530
(% of AGI for various income ranges: 0.4% for AGIs $25k-50k, 0.4% for AGIs $50k-75k, 0.8% for AGIs $75k-100k, 1.8% for AGIs $100k-200k, 5.2% for AGIs over 200k)
Profit/loss from business: +$8,585 (reported on 15.9% of returns)
Here:
+$8,585
State:
+$12,323
(% of AGI for various income ranges: 8.1% for AGIs below $25k, 2.9% for AGIs $25k-50k, 2.1% for AGIs $50k-75k, 3.0% for AGIs $75k-100k, 2.9% for AGIs $100k-200k)
Taxable individual retirement arrangement distribution: $14,835 (reported on 12.3% of returns)
86323:
$14,835
Arizona:
$18,280
(% of AGI for various income ranges: 3.8% for AGIs below $25k, 2.7% for AGIs $25k-50k, 3.6% for AGIs $50k-75k, 4.9% for AGIs $75k-100k, 8.3% for AGIs $100k-200k)
Total itemized deductions: $19,684 (29% of AGI, reported on 30.1% of returns)
Here:
$19,684
State:
$23,651
Here:
28.9% of AGI
State:
20.6% of AGI
(% of AGI for various income ranges: 13.4% for AGIs below $25k, 13.2% for AGIs $25k-50k, 13.7% for AGIs $50k-75k, 16.2% for AGIs $75k-100k, 14.7% for AGIs $100k-200k, 16.6% for AGIs over 200k)
Charity contributions: $2,665 (reported on 23.8% of returns)
Here:
$2,665
State:
$4,114
(% of AGI for various income ranges: 0.8% for AGIs below $25k, 1.3% for AGIs $25k-50k, 1.3% for AGIs $50k-75k, 1.9% for AGIs $75k-100k, 2.0% for AGIs $100k-200k, 2.3% for AGIs over 200k)
Taxes paid: $4,364 (reported on 30.1% of returns)
86323:
$4,364
State:
$6,509
(% of AGI for various income ranges: 2.4% for AGIs below $25k, 2.6% for AGIs $25k-50k, 3.1% for AGIs $50k-75k, 3.5% for AGIs $75k-100k, 4.0% for AGIs $100k-200k, 3.8% for AGIs over 200k)
Earned income credit: $2,184 (reported on 20.5% of returns)
Here:
$2,184
State:
$2,432
(% of AGI for various income ranges: 5.9% for AGIs below $25k, 1.2% for AGIs $25k-50k)
Percentage of individuals using paid preparers for their 2012 taxes: 52.4%
Here:
52%
State:
52%
(% for various income ranges: 46.0% for AGIs below $25k, 53.3% for AGIs $25k-50k, 57.0% for AGIs $50k-75k, 61.4% for AGIs $75k-100k, 66.7% for AGIs $100k-200k, 80.0% for AGIs over 200k)
Averages for the 2004 tax year for zip code 86323, filed in 2005:
Average Adjusted Gross Income (AGI) in 2004: $37,682 (Individual Income Tax Returns)
Here:
$37,682
State:
$50,097
Salary/wage: $31,787 (reported on 80.4% of returns)
Here:
$31,787
State:
$42,146
(% of AGI for various income ranges: 161.6% for AGIs below $10k, 72.6% for AGIs $10k-25k, 75.7% for AGIs $25k-50k, 73.6% for AGIs $50k-75k, 67.5% for AGIs $75k-100k, 42.7% for AGIs over 100k)
Taxable interest for individuals: $1,573 (reported on 42.8% of returns)
This zip code:
$1,573
Arizona:
$2,374
(% of AGI for various income ranges: 11.2% for AGIs below $10k, 2.1% for AGIs $10k-25k, 1.4% for AGIs $25k-50k, 1.3% for AGIs $50k-75k, 1.5% for AGIs $75k-100k, 2.3% for AGIs over 100k)
Taxable dividends: $2,173 (reported on 17.5% of returns)
Here:
$2,173
State:
$3,888
(% of AGI for various income ranges: 5.6% for AGIs below $10k, 1.3% for AGIs $10k-25k, 0.6% for AGIs $25k-50k, 0.9% for AGIs $50k-75k, 1.0% for AGIs $75k-100k, 1.3% for AGIs over 100k)
Net capital gain/loss: +$13,890 (reported on 18.1% of returns)
Here:
+$13,890
State:
+$17,569
(% of AGI for various income ranges: -2.5% for AGIs below $10k, 0.6% for AGIs $10k-25k, 1.2% for AGIs $25k-50k, 1.9% for AGIs $50k-75k, 4.5% for AGIs $75k-100k, 25.1% for AGIs over 100k)
Profit/loss from business: +$6,586 (reported on 18.1% of returns)
Here:
+$6,586
State:
+$11,088
(% of AGI for various income ranges: -11.5% for AGIs below $10k, 6.1% for AGIs $10k-25k, 3.0% for AGIs $25k-50k, 2.5% for AGIs $50k-75k, 2.2% for AGIs $75k-100k, 3.8% for AGIs over 100k)
IRA payment deduction: $3,000 (reported on 2.5% of returns)
86323:
$3,000
Arizona:
$3,023
(% of AGI for various income ranges: 0.2% for AGIs $10k-25k, 0.3% for AGIs $25k-50k, 0.2% for AGIs $50k-75k, 0.2% for AGIs $75k-100k, 0.2% for AGIs over 100k)
Self-employed pension: $16,529 (reported on 0.3% of returns)
Here:
$16,529
Arizona:
$15,785
Total itemized deductions: $15,912 (27% of AGI, reported on 37.5% of returns)
Here:
$15,912
State:
$19,781
Here:
26.7% of AGI
State:
21.8% of AGI
(% of AGI for various income ranges: 32.9% for AGIs below $10k, 15.4% for AGIs $10k-25k, 15.9% for AGIs $25k-50k, 17.3% for AGIs $50k-75k, 18.1% for AGIs $75k-100k, 11.7% for AGIs over 100k)
Charity contributions deductions: $2,249 (4% of AGI, reported on 30.9% of returns)
Here:
$2,249
State:
$3,389
Here:
3.6% of AGI
State:
3.5% of AGI
(% of AGI for various income ranges: 1.5% for AGIs below $10k, 1.3% for AGIs $10k-25k, 1.4% for AGIs $25k-50k, 2.0% for AGIs $50k-75k, 2.3% for AGIs $75k-100k, 2.3% for AGIs over 100k)
Total tax: $4,634 (reported on 72.2% of returns)
86323:
$4,634
State:
$8,323
(% of AGI for various income ranges: 5.7% for AGIs below $10k, 3.9% for AGIs $10k-25k, 5.7% for AGIs $25k-50k, 8.2% for AGIs $50k-75k, 10.0% for AGIs $75k-100k, 16.3% for AGIs over 100k)
Earned income credit: $1,625 (reported on 17.9% of returns)
Here:
$1,625
State:
$1,786
Percentage of individuals using paid preparers for their 2004 taxes: 65.5%
Here:
66%
State:
60%
(% for various income ranges: 58.3% for AGIs below $10k, 65.1% for AGIs $10k-25k, 67.3% for AGIs $25k-50k, 66.6% for AGIs $50k-75k, 70.0% for AGIs $75k-100k, 77.2% for AGIs over 100k)
Household received Food Stamps/SNAP in the past 12 months: 735 Household did not receive Food Stamps/SNAP in the past 12 months: 7,726
Women who had a birth in the past 12 months: 211 (52 now married, 152 unmarried) Women who did not have a birth in the past 12 months: 3,393 (1,561 now married, 1,824 unmarried)
Housing units in zip code 86323 with a mortgage: 4,013 (186 second mortgage, 43 home equity loan, 133 both second mortgage and home equity loan) Houses without a mortgage: 55
Median monthly owner costs for units with a mortgage: $1,425 Median monthly owner costs for units without a mortgage: $397
Residents with income below the poverty level in 2022:
This zip code:
7.0%
Whole state:
12.5%
Residents with income below 50% of the poverty level in 2022:
This zip code:
3.5%
Whole state:
6.0%
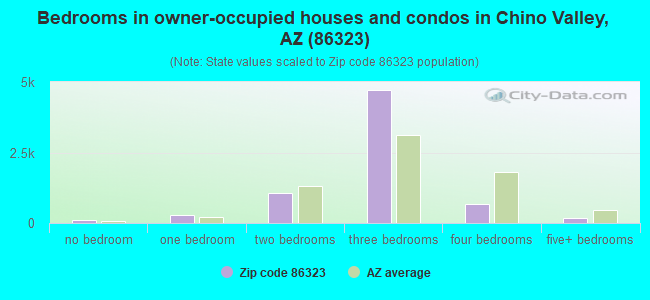
Median number of rooms in houses and condos:
Here:
5.8
State:
6.0
Median number of rooms in apartments:
Here:
5.0
State:
4.1
Notable locations in this zip code not listed on our city pages
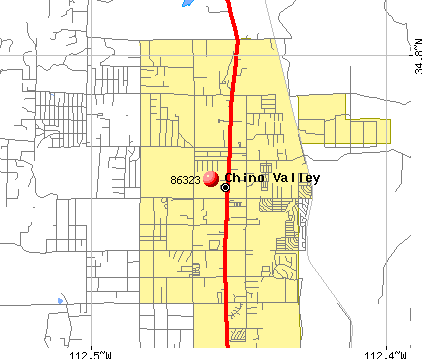
Notable locations in zip code 86323: Del Rio Ranch (A), Chino Valley District Ranger Office (B), Arizona Highway Maintenance Chino Valley Yard (C), Copper Railroad Station (D), Del Rio Railroad Station (E), Chino Valley Public Library (F), Chino Valley Fire District Station 62 (G), Chino Valley Fire District Station 61 (H), Chino Valley Police Department (I). Display/hide their locations on the map
Churches in zip code 86323 include: Grace Baptist Church (A), First Southern Baptist Church of Chino Valley (B), Chino Valley Word of Life Assembly of God (C), Chino Valley United Methodist Church (D), Chino Valley Community Church (E), Bible Baptist Church (F), Kingdom Hall of Jehovahs Witnesses (G), Saint Catherine Laboure Catholic (H), Hope Evangelical Lutheran Church (I). Display/hide their locations on the map
Reservoirs: Boundary Tank (A), Bull Tank (B), Sheep Camp Tank (C), Horse Camp Tanks (D), Gold Basin Tank (E), Munds Tank Number Two (F), Duck Tank (G), Harolds Tank (H). Display/hide their locations on the map
1,540 married couples with children.
790 single-parent households (356 men, 434 women).
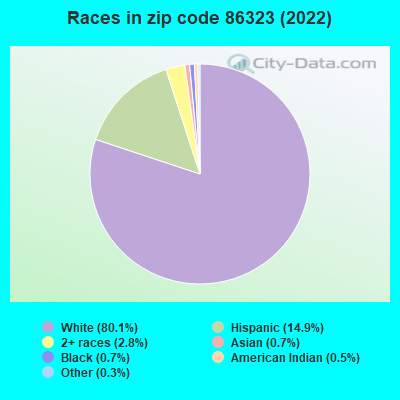
93.4% of residents of 86323 zip code speak English at home.
5.8% of residents speak Spanish at home (76% very well, 19% well, 4% not well, 1% not at all).
0.6% of residents speak other Indo-European language at home (100% very well).
0.5% of residents speak Asian or Pacific Island language at home (66% very well, 16% well, 18% not at all).
0.2% of residents speak other language at home (71% very well, 29% well).
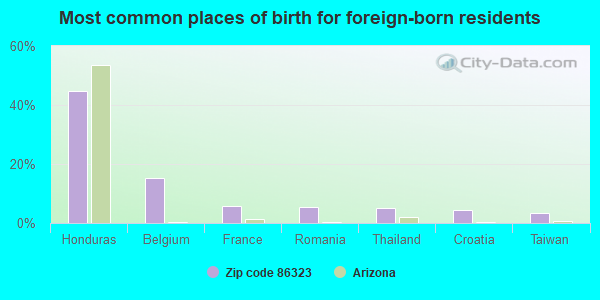
Foreign born population: 783 (4.0%) (70.5% of them are naturalized citizens)
This zip code:
4.0%
Whole state:
13.1%
45%Honduras
15%Belgium
6%France
6%Romania
5%Thailand
5%Croatia
3%Taiwan
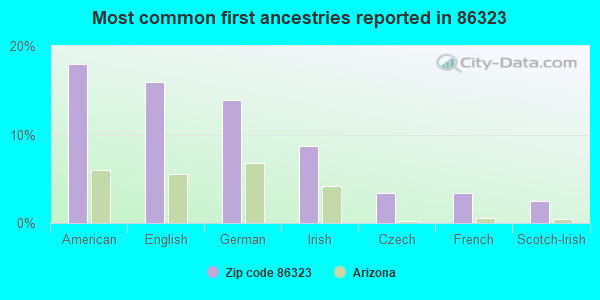
18%American
16%English
14%German
9%Irish
3%Czech
3%French
3%Scotch-Irish
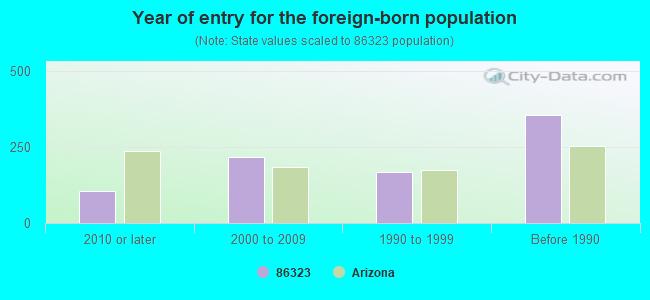
Year of entry for the foreign-born population
1052010 or later
2182000 to 2009
1691990 to 1999
356Before 1990
Facilities with environmental interests located in this zip code:
DEL RIO ELEMENTARY SCHOOL (1036 N RD 1 WEST in CHINO VALLEY, AZ)
(National Center for Education Statistics) - STATE ID-101 Organizations: CHINO VALLEY UNIFIED DISTRICT (SCHOOL DISTRICT)
EXCEL EDUCATION CENTERS, INC. - CHINO VALLEY (1985 N. ROAD 1 WEST in CHINO VALLEY, AZ)
(National Center for Education Statistics) - STATE ID-007
HERITAGE MIDDLE SCHOOL (1076 N RD 1 W in CHINO VALLEY, AZ)
(National Center for Education Statistics) - STATE ID-102 Organizations: CHINO VALLEY UNIFIED DISTRICT (SCHOOL DISTRICT)
Housing units lacking complete plumbing facilities: 0.8% Housing units lacking complete kitchen facilities: 0.9%
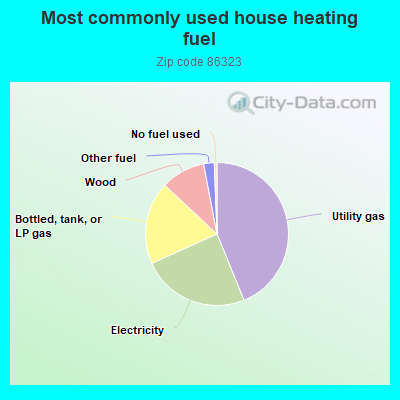
43.8%Utility gas
24.4%Electricity
18.7%Bottled, tank, or LP gas
10.0%Wood
2.4%Other fuel
0.6%No fuel used
Population in 1990: 7,285. Population change in the 1990s: +5,108 (+70.1%).
Place of birth for U.S.-born residents:
This state: 7,515
Northeast: 821
Midwest: 3,780
South: 1,689
West: 5,097
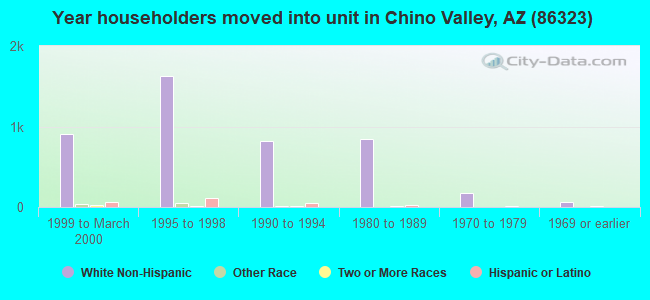
43% of the 86323 zip code residents lived in the same house 5 years ago. Out of people who lived in different houses, 49% lived in this county. Out of people who lived in different counties, 50% lived in Arizona.
93% of the 86323 zip code residents lived in the same house 1 year ago. Out of people who lived in different houses, 38% moved from this county. Out of people who lived in different houses, 23% moved from different county within same state. Out of people who lived in different houses, 52% moved from different state.
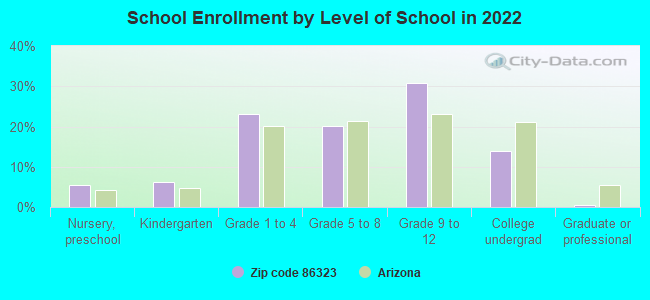
Private vs. public school enrollment:
Students in private schools in grades 1 to 8 (elementary and middle school): 204
Here:
14.5%
Arizona:
10.4%
Students in private schools in grades 9 to 12 (high school): 87
Here:
8.6%
Arizona:
8.8%
Students in private undergraduate colleges: 6
Here:
1.4%
Arizona:
13.1%
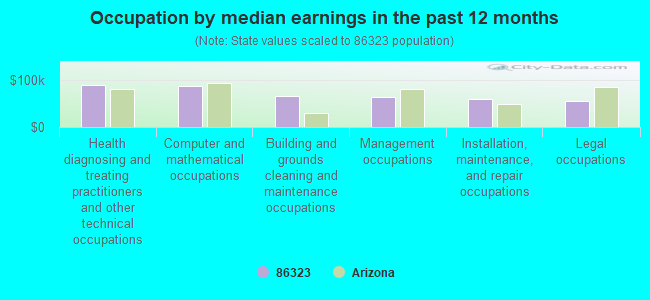
Occupation by median earnings in the past 12 months ($)
88,950Health diagnosing and treating practitioners and other technical occupations
87,186Computer and mathematical occupations
64,997Building and grounds cleaning and maintenance occupations
62,958Management occupations
58,697Installation, maintenance, and repair occupations
54,946Legal occupations
Companies with federal contracts located in this zip code:
CONCEPTUAL SYSTEMS & SOFTWARE (432 W BUTTERFIELD RD in CHINO VALLEY, AZ; small business)
$157,246 with Navy for Defense Electronics and Communication Equipment -- Advanced Development (R&D). Signed on 2001-08-28. Completion date: 2002-08-15.
HANS J VANG (400 W BUTTERFIELD RD in CHINO VALLEY, AZ; small business) 50 employees, $0 revenue
$42,450 with Navy for Miscellaneous Weapons. Signed on 2005-08-18. Completion date: 2005-09-15.
TABLE MOUNTAIN ELECTRIC (1035 TABLE MOUNTAIN RD in CHINO VALLEY, AZ; small business) 2 employees, $95000 revenue. : $11,715 in 4 contractsin 2002
$11,000 with Forest Service (disused code: now 12C2) for Construction of Structures and Facilities -- Other Utilities. Signed on 2002-09-15. Completion date: 2002-11-15.
$715 with Forest Service for Construction of Structures and Facilities -- Other Utilities. Signed on 2002-11-15. Completion date: 2002-11-15.
$0, same as above.Signed on 2002-11-15. Completion date: 2002-11-15.
$0, same as above.Signed on 2002-11-15. Completion date: 2002-11-15.
Top industries in this zip code by the number of employees in 2005:
Mining: Crushed and Broken Limestone Mining and Quarrying (100-249 employees: 1 establishment)
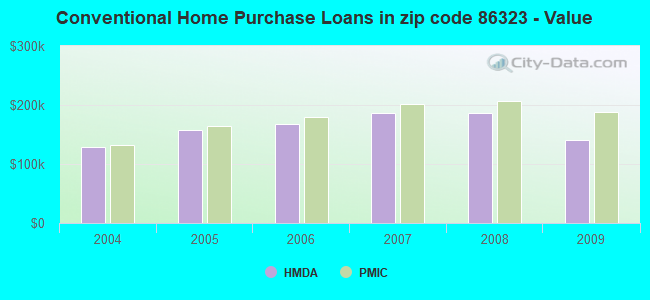
Detailed PMIC statistics for the following Tracts:0002.01
, 0002.02
2003 - 2018 National Fire Incident Reporting System (NFIRS) incidents
According to the data from the years 2003 - 2018 the average number of fires per year is 26. The highest number of fires - 56 took place in 2006, and the least - 0 in 2010. The data has a constant trend.
When looking into fire subcategories, the most incidents belonged to: Outside Fires (39.6%), and Structure Fires (36.9%).
Fire incident types reported to NFIRS in Zip Code 86323


 Nearest zip codes: 86315, 86314, 86301, 86334, 86313, 86331.
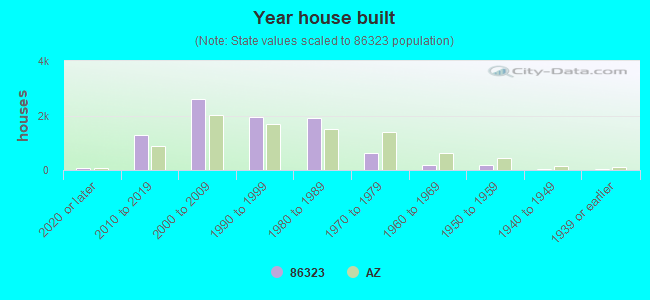


 According to the data from the years 2003 - 2018 the average number of fires per year is 26. The highest number of fires - 56 took place in 2006, and the least - 0 in 2010. The data has a constant trend.
 When looking into fire subcategories, the most incidents belonged to: Outside Fires (39.6%), and Structure Fires (36.9%).