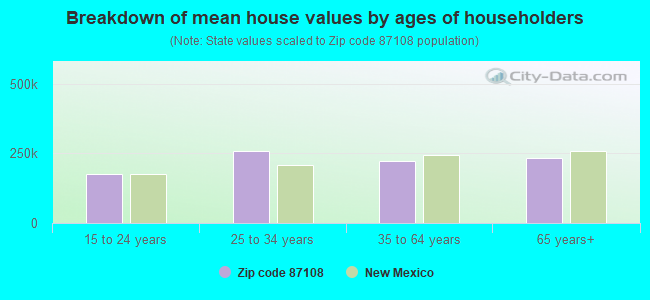
Estimated zip code population in 2022: 36,162 Zip code population in 2010: 38,647 Zip code population in 2000: 37,711
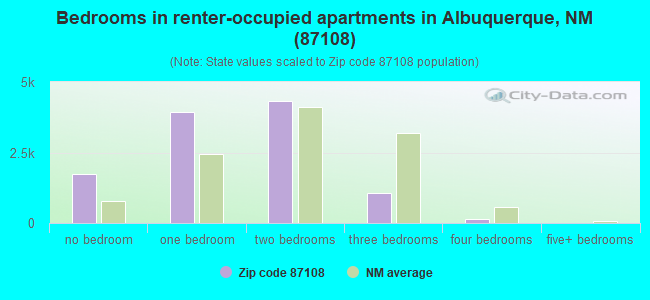
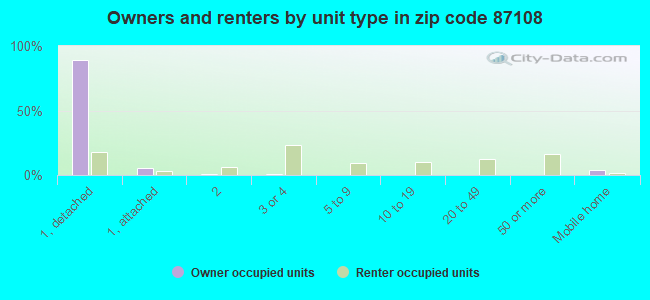
Houses and condos: 19,512 Renter-occupied apartments: 10,773
% of renters here:
62%
State:
29%
March 2022 cost of living index in zip code 87108: 95.1 (less than average, U.S. average is 100)
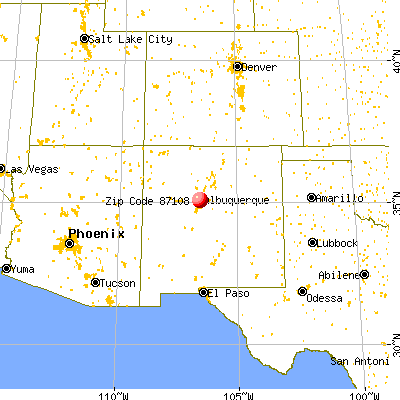
Land area: 5.9 sq. mi. Water area: 0.0 sq. mi.
Population density: 6,152 people per square mile
(high).
OSM Map
General Map
Google Map
MSN Map
OSM Map
General Map
Google Map
MSN Map
OSM Map
General Map
Google Map
MSN Map
OSM Map
General Map
Google Map
MSN Map
Please wait while loading the map...
Real estate property taxes paid for housing units in 2022:
This zip code:
0.9% ($2,104)
New Mexico:
0.7% ($1,638)
Median real estate property taxes paid for housing units with mortgages in 2022: $2,051 (0.8%) Median real estate property taxes paid for housing units with no mortgage in 2022: $2,123 (1.0%)
Averages for the 2020 tax year for zip code 87108, filed in 2021:
Average Adjusted Gross Income (AGI) in 2020: $42,104 (Individual Income Tax Returns)
Here:
$42,104
State:
$59,146
Salary/wage: $36,473 (reported on 80.9% of returns)
Here:
$36,473
State:
$48,327
(% of AGI for various income ranges: 1177.4% for AGIs below $25k, 3519.5% for AGIs $25k-50k, 6669.4% for AGIs $50k-75k, 9532.0% for AGIs $75k-100k, 16860.2% for AGIs $100k-200k, 55041.0% for AGIs over 200k)
Taxable interest for individuals: $1,159 (reported on 23.4% of returns)
This zip code:
$1,159
New Mexico:
$1,616
(% of AGI for various income ranges: 9.7% for AGIs below $25k, 14.3% for AGIs $25k-50k, 54.3% for AGIs $50k-75k, 104.1% for AGIs $75k-100k, 212.9% for AGIs $100k-200k, 919.0% for AGIs over 200k)
Ordinary dividends: $7,487 (reported on 12.4% of returns)
Here:
$7,487
State:
$7,816
(% of AGI for various income ranges: 13.7% for AGIs below $25k, 29.4% for AGIs $25k-50k, 118.2% for AGIs $50k-75k, 248.6% for AGIs $75k-100k, 575.0% for AGIs $100k-200k, 7027.0% for AGIs over 200k)
Net capital gain/loss in AGI: +$9,287 (reported on 11.2% of returns)
Here:
+$9,287
State:
+$19,595
(% of AGI for various income ranges: 4.9% for AGIs below $25k, 20.0% for AGIs $25k-50k, 97.9% for AGIs $50k-75k, 282.2% for AGIs $75k-100k, 971.0% for AGIs $100k-200k, 7674.0% for AGIs over 200k)
Profit/loss from business: +$9,106 (reported on 13.2% of returns)
Here:
+$9,106
State:
+$11,430
(% of AGI for various income ranges: 89.8% for AGIs below $25k, 116.2% for AGIs $25k-50k, 175.3% for AGIs $50k-75k, 357.1% for AGIs $75k-100k, 678.8% for AGIs $100k-200k, 2249.0% for AGIs over 200k)
Taxable individual retirement arrangement distribution: $16,628 (reported on 5.6% of returns)
87108:
$16,628
New Mexico:
$20,970
(% of AGI for various income ranges: 24.9% for AGIs below $25k, 49.5% for AGIs $25k-50k, 160.0% for AGIs $50k-75k, 373.9% for AGIs $75k-100k, 765.4% for AGIs $100k-200k, 3768.0% for AGIs over 200k)
Self-employed (Keogh) retirement plans: $11,020 (reported on 0.3% of returns)
87108:
$11,020
New Mexico:
$20,997
(% of AGI for various income ranges: 2.8% for AGIs below $25k, 76.2% for AGIs $100k-200k)
Total itemized deductions: $26,650 (reported on 3.8% of returns)
Here:
$26,650
State:
$33,187
(% of AGI for various income ranges: 16.6% for AGIs below $25k, 55.7% for AGIs $25k-50k, 184.9% for AGIs $50k-75k, 389.0% for AGIs $75k-100k, 895.8% for AGIs $100k-200k, 4315.0% for AGIs over 200k)
Charity contributions: $8,087 (reported on 2.9% of returns)
Here:
$8,087
State:
$11,850
(% of AGI for various income ranges: 1.1% for AGIs below $25k, 5.4% for AGIs $25k-50k, 30.3% for AGIs $50k-75k, 69.4% for AGIs $75k-100k, 209.8% for AGIs $100k-200k, 1594.0% for AGIs over 200k)
Taxes paid: $6,920 (reported on 3.8% of returns)
87108:
$6,920
State:
$7,150
(% of AGI for various income ranges: 2.6% for AGIs below $25k, 6.7% for AGIs $25k-50k, 44.7% for AGIs $50k-75k, 123.1% for AGIs $75k-100k, 286.5% for AGIs $100k-200k, 1077.0% for AGIs over 200k)
Earned income credit: $2,108 (reported on 24.4% of returns)
Here:
$2,108
State:
$2,323
(% of AGI for various income ranges: 101.0% for AGIs below $25k, 67.5% for AGIs $25k-50k, 1.0% for AGIs $50k-75k)
Percentage of individuals using paid preparers for their 2020 taxes: 90.7%
Here:
91%
State:
92%
(% for various income ranges: 90.1% for AGIs below $25k, 91.4% for AGIs $25k-50k, 90.8% for AGIs $50k-75k, 92.3% for AGIs $75k-100k, 89.9% for AGIs $100k-200k, 93.5% for AGIs over 200k)
Averages for the 2012 tax year for zip code 87108, filed in 2013:
Average Adjusted Gross Income (AGI) in 2012: $35,823 (Individual Income Tax Returns)
Here:
$35,823
State:
$50,343
Salary/wage: $30,538 (reported on 84.2% of returns)
Here:
$30,538
State:
$41,171
(% of AGI for various income ranges: 81.4% for AGIs below $25k, 82.1% for AGIs $25k-50k, 72.2% for AGIs $50k-75k, 66.1% for AGIs $75k-100k, 67.9% for AGIs $100k-200k, 47.1% for AGIs over 200k)
Taxable interest for individuals: $1,406 (reported on 22.8% of returns)
This zip code:
$1,406
New Mexico:
$1,677
(% of AGI for various income ranges: 0.7% for AGIs below $25k, 0.7% for AGIs $25k-50k, 1.0% for AGIs $50k-75k, 1.1% for AGIs $75k-100k, 1.2% for AGIs $100k-200k, 1.1% for AGIs over 200k)
Ordinary dividends: $6,605 (reported on 12.6% of returns)
Here:
$6,605
State:
$6,939
(% of AGI for various income ranges: 0.8% for AGIs below $25k, 1.0% for AGIs $25k-50k, 1.7% for AGIs $50k-75k, 2.2% for AGIs $75k-100k, 2.2% for AGIs $100k-200k, 8.1% for AGIs over 200k)
Net capital gain/loss in AGI: +$7,449 (reported on 9.8% of returns)
Here:
+$7,449
State:
+$14,311
(% of AGI for various income ranges: 0.2% for AGIs $25k-50k, 0.8% for AGIs $50k-75k, 1.1% for AGIs $75k-100k, 3.2% for AGIs $100k-200k, 9.3% for AGIs over 200k)
Profit/loss from business: +$9,403 (reported on 12.5% of returns)
Here:
+$9,403
State:
+$11,059
(% of AGI for various income ranges: 6.6% for AGIs below $25k, 2.3% for AGIs $25k-50k, 1.7% for AGIs $50k-75k, 3.2% for AGIs $75k-100k, 2.5% for AGIs $100k-200k, 2.9% for AGIs over 200k)
Taxable individual retirement arrangement distribution: $11,624 (reported on 6.4% of returns)
87108:
$11,624
New Mexico:
$15,706
(% of AGI for various income ranges: 1.2% for AGIs below $25k, 1.3% for AGIs $25k-50k, 2.4% for AGIs $50k-75k, 3.1% for AGIs $75k-100k, 3.2% for AGIs $100k-200k, 2.3% for AGIs over 200k)
Self-employment retirement plans: $11,167 (reported on 0.4% of returns)
87108:
$11,167
New Mexico:
$18,209
Total itemized deductions: $17,854 (19% of AGI, reported on 16.7% of returns)
Here:
$17,854
State:
$21,709
Here:
19.5% of AGI
State:
19.8% of AGI
(% of AGI for various income ranges: 3.6% for AGIs below $25k, 6.6% for AGIs $25k-50k, 10.1% for AGIs $50k-75k, 11.2% for AGIs $75k-100k, 12.5% for AGIs $100k-200k, 9.0% for AGIs over 200k)
Charity contributions: $3,086 (reported on 12.6% of returns)
Here:
$3,086
State:
$4,195
(% of AGI for various income ranges: 0.3% for AGIs below $25k, 0.6% for AGIs $25k-50k, 1.1% for AGIs $50k-75k, 1.5% for AGIs $75k-100k, 1.8% for AGIs $100k-200k, 1.8% for AGIs over 200k)
Taxes paid: $5,457 (reported on 16.5% of returns)
87108:
$5,457
State:
$6,176
(% of AGI for various income ranges: 0.6% for AGIs below $25k, 1.3% for AGIs $25k-50k, 2.6% for AGIs $50k-75k, 3.1% for AGIs $75k-100k, 4.3% for AGIs $100k-200k, 4.7% for AGIs over 200k)
Earned income credit: $2,230 (reported on 28.8% of returns)
Here:
$2,230
State:
$2,311
(% of AGI for various income ranges: 7.7% for AGIs below $25k, 1.0% for AGIs $25k-50k)
Percentage of individuals using paid preparers for their 2012 taxes: 45.7%
Here:
46%
State:
50%
(% for various income ranges: 46.4% for AGIs below $25k, 42.9% for AGIs $25k-50k, 44.4% for AGIs $50k-75k, 44.8% for AGIs $75k-100k, 47.9% for AGIs $100k-200k, 76.5% for AGIs over 200k)
Averages for the 2004 tax year for zip code 87108, filed in 2005:
Average Adjusted Gross Income (AGI) in 2004: $29,484 (Individual Income Tax Returns)
Here:
$29,484
State:
$39,572
Salary/wage: $26,037 (reported on 84.9% of returns)
Here:
$26,037
State:
$34,237
(% of AGI for various income ranges: 102.9% for AGIs below $10k, 84.6% for AGIs $10k-25k, 82.0% for AGIs $25k-50k, 71.7% for AGIs $50k-75k, 71.3% for AGIs $75k-100k, 55.7% for AGIs over 100k)
Taxable interest for individuals: $1,896 (reported on 30.3% of returns)
This zip code:
$1,896
New Mexico:
$1,873
(% of AGI for various income ranges: 2.6% for AGIs below $10k, 1.5% for AGIs $10k-25k, 1.5% for AGIs $25k-50k, 2.4% for AGIs $50k-75k, 1.9% for AGIs $75k-100k, 2.6% for AGIs over 100k)
Taxable dividends: $3,564 (reported on 16.5% of returns)
Here:
$3,564
State:
$3,554
(% of AGI for various income ranges: 2.3% for AGIs below $10k, 1.0% for AGIs $10k-25k, 1.2% for AGIs $25k-50k, 1.6% for AGIs $50k-75k, 2.1% for AGIs $75k-100k, 4.3% for AGIs over 100k)
Net capital gain/loss: +$8,491 (reported on 12.8% of returns)
Here:
+$8,491
State:
+$10,425
(% of AGI for various income ranges: -1.1% for AGIs below $10k, 0.2% for AGIs $10k-25k, 0.6% for AGIs $25k-50k, 1.1% for AGIs $50k-75k, 2.4% for AGIs $75k-100k, 14.4% for AGIs over 100k)
Profit/loss from business: +$9,118 (reported on 11.2% of returns)
Here:
+$9,118
State:
+$8,875
(% of AGI for various income ranges: 6.5% for AGIs below $10k, 2.5% for AGIs $10k-25k, 2.2% for AGIs $25k-50k, 2.4% for AGIs $50k-75k, 2.5% for AGIs $75k-100k, 6.7% for AGIs over 100k)
IRA payment deduction: $2,789 (reported on 2.0% of returns)
87108:
$2,789
New Mexico:
$2,940
(% of AGI for various income ranges: 0.2% for AGIs below $10k, 0.1% for AGIs $10k-25k, 0.3% for AGIs $25k-50k, 0.2% for AGIs $50k-75k, 0.1% for AGIs $75k-100k, 0.1% for AGIs over 100k)
Self-employed pension: $11,812 (reported on 0.6% of returns)
Here:
$11,812
New Mexico:
$13,110
(% of AGI for various income ranges: 0.1% for AGIs $25k-50k, 0.1% for AGIs $50k-75k, 0.3% for AGIs $75k-100k, 0.9% for AGIs over 100k)
Total itemized deductions: $14,648 (21% of AGI, reported on 19.2% of returns)
Here:
$14,648
State:
$18,103
Here:
21.3% of AGI
State:
21.5% of AGI
(% of AGI for various income ranges: 7.7% for AGIs below $10k, 4.7% for AGIs $10k-25k, 8.6% for AGIs $25k-50k, 11.9% for AGIs $50k-75k, 13.6% for AGIs $75k-100k, 12.2% for AGIs over 100k)
Charity contributions deductions: $2,682 (4% of AGI, reported on 15.5% of returns)
Here:
$2,682
State:
$3,246
Here:
3.6% of AGI
State:
3.6% of AGI
(% of AGI for various income ranges: 0.4% for AGIs below $10k, 0.5% for AGIs $10k-25k, 0.9% for AGIs $25k-50k, 1.7% for AGIs $50k-75k, 2.2% for AGIs $75k-100k, 2.6% for AGIs over 100k)
Total tax: $4,506 (reported on 63.7% of returns)
87108:
$4,506
State:
$6,237
(% of AGI for various income ranges: 2.2% for AGIs below $10k, 3.5% for AGIs $10k-25k, 7.3% for AGIs $25k-50k, 10.7% for AGIs $50k-75k, 12.1% for AGIs $75k-100k, 18.5% for AGIs over 100k)
Earned income credit: $1,661 (reported on 27.9% of returns)
Here:
$1,661
State:
$1,796
Percentage of individuals using paid preparers for their 2004 taxes: 53.6%
Here:
54%
State:
57%
(% for various income ranges: 55.8% for AGIs below $10k, 55.9% for AGIs $10k-25k, 49.6% for AGIs $25k-50k, 48.7% for AGIs $50k-75k, 49.1% for AGIs $75k-100k, 57.6% for AGIs over 100k)
Likely homosexual households (counted as self-reported same-sex unmarried-partner households)
Lesbian couples: 0.4% of all households
Gay men: 0.3% of all households
Household received Food Stamps/SNAP in the past 12 months: 5,789 Household did not receive Food Stamps/SNAP in the past 12 months: 12,404
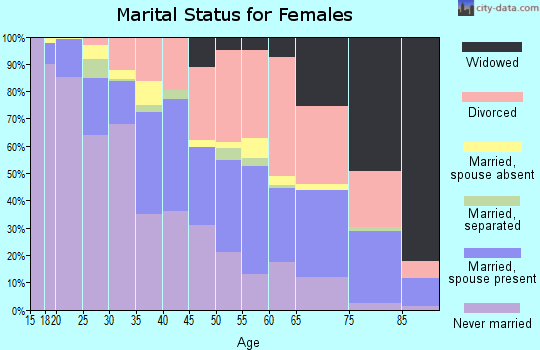
Women who had a birth in the past 12 months: 463 (288 now married, 169 unmarried) Women who did not have a birth in the past 12 months: 8,242 (1,943 now married, 6,349 unmarried)
Housing units in zip code 87108 with a mortgage: 3,619 (367 second mortgage, 313 both second mortgage and home equity loan) Houses without a mortgage: 233
Median monthly owner costs for units with a mortgage: $1,244 Median monthly owner costs for units without a mortgage: $441
Residents with income below the poverty level in 2022:
This zip code:
33.4%
Whole state:
17.6%
Residents with income below 50% of the poverty level in 2022:
This zip code:
16.1%
Whole state:
9.7%
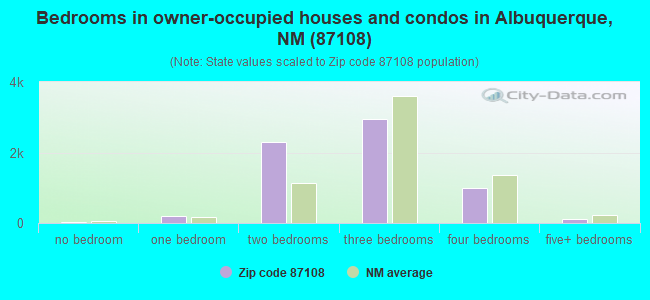
Median number of rooms in houses and condos:
Here:
5.9
State:
5.9
Median number of rooms in apartments:
Here:
3.4
State:
4.2
Notable locations in this zip code not listed on our city pages
Notable locations in zip code 87108: New Mexico State Fairgrounds (A), Grandview Green (B), Arrowhead Plaza (C), Zuni-San Mateo Center (D), Gibson Center (E), Albuquerque Fire Department Station 5 (F), Albuquerque Fire Department Station 11 (G). Display/hide their locations on the map
Shopping Centers: Morningside Shopping Center (1), Siesta Hills Shopping Center (2), Parkland Hills Shopping Center (3). Display/hide their locations on the map
Churches in zip code 87108 include: Faith Temple Church of God in Christ (A), Universal Church of the Holy Spirit (B), East Mesa Church (C), Heights Church of Christ (D), University Heights United Methodist Church (E), Baptist Convention Church (F), Morningstar Baptist Church (G), Shiloh Baptist Church (H), Fellowship Baptist Church (I). Display/hide their locations on the map
Parks in zip code 87108 include: Eunice Kaloch Park (1), Hermosa Green (2), Monroe Green Park (3), Morningside Park (4), Vail Park (5), Ross Park (6), Fox Memorial Park (7), Ridgecrest Park (8). Display/hide their locations on the map
Tourist attractions (not listed on the city page) : Zabel Vending & Amusement CO (Amusement & Theme Parks; 5211 Gibson Boulevard Southeast), Highland Swing Miniature Golf & Games (Amusement & Theme Parks; 312 Adams Street Northeast), Expo New Mexico (300 San Pedro Drive Southeast).
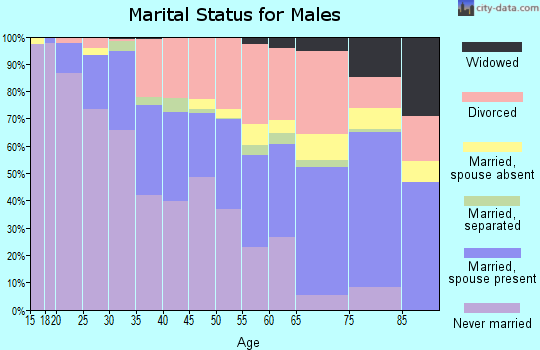
2,103 married couples with children.
3,969 single-parent households (457 men, 3,512 women).
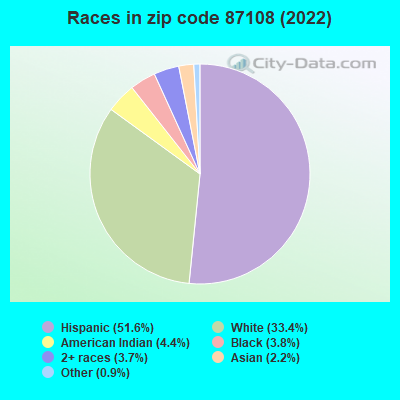
67.8% of residents of 87108 zip code speak English at home.
25.7% of residents speak Spanish at home (57% very well, 18% well, 14% not well, 11% not at all).
3.0% of residents speak other Indo-European language at home (52% very well, 45% well, 4% not well).
1.6% of residents speak Asian or Pacific Island language at home (54% very well, 19% well, 11% not well, 16% not at all).
2.6% of residents speak other language at home (84% very well, 15% well, 1% not well).
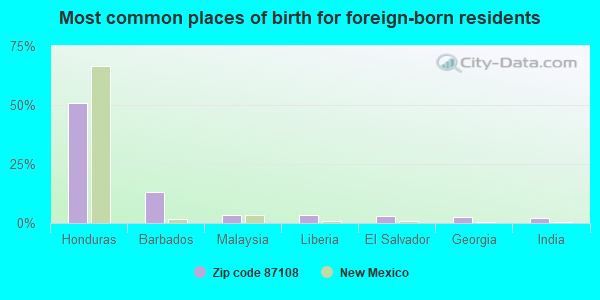
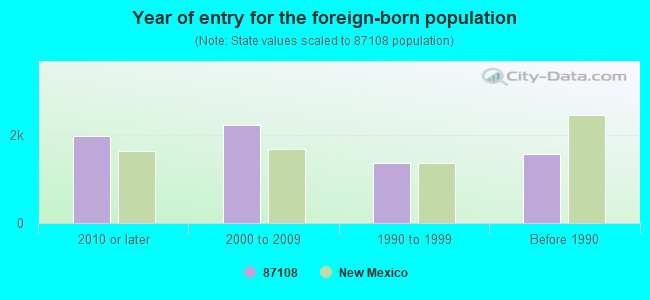
Foreign born population: 6,510 (18.0%) (27.2% of them are naturalized citizens)
Major facilities with environmental interests located in this zip code:
APS HIGHLAND HIGH SCHOOL (4700 COAL AVENUE SOUTHEAST in ALBUQUERQUE, NM)
AIR MINOR (AIRS/AFS) ENFORCEMENT/COMPLIANCE ACTIVITY (Integrated Compliance Information System) (National Center for Education Statistics) - STATE ID-01011520 Business SIC classification: ELEMENTARY AND SECONDARY SCHOOLS Organizations: ALBUQUERQUE PUBLIC SCHOOLS (SCHOOL DISTRICT)
ALBUQUERQUE PUBLIC SCHOOL WILSON MIDDLE SCHOOL (1138 CARDENAS DRIVE SOUTHEAST in ALBUQUERQUE, NM)
AIR MINOR (AIRS/AFS) (National Center for Education Statistics) - STATE ID-01011470 Business SIC classification: ELEMENTARY AND SECONDARY SCHOOLS Organizations: ALBUQUERQUE PUBLIC SCHOOLS (SCHOOL DISTRICT)
Alternative names: APS WILSON MIDDLE SCHOOL
APS VAN BUREN MIDDLE SCHOOL (700 LOUISIANA SE in ALBUQUERQUE, NM)
AIR MINOR (AIRS/AFS) (National Center for Education Statistics) - STATE ID-01011460 Business SIC classification: ELEMENTARY AND SECONDARY SCHOOLS Organizations: ALBUQUERQUE PUBLIC SCHOOLS (SCHOOL DISTRICT)
ACADEMY PERFORMING ARTS C (1820 RANDOLPH RD. SE in ALBUQUERQUE, NM)
(National Center for Education Statistics) - STATE ID-01015047 Organizations: ALBUQUERQUE PUBLIC SCHOOLS (SCHOOL DISTRICT)
CENTRAL 66 (8614 CENTRAL AVE SE in ALBUQUERQUE, NM)
AIR MINOR (AIRS/AFS) (Resource Conservation and Recovery Act (tracking hazardous waste)) Business SIC classification: GASOLINE SERVICE STATIONS Organizations: PHILLIPS PETROLEUM COMPANY (CONTACT/OPERATOR)
Alternative names: PHILLIPS 66 SERVICE STATION #27245, PHILLIPS PETROLEUM CO SS#27245
EMERSON ELEMENTARY (620 GEORGIA ST SE in ALBUQUERQUE, NM)
(National Center for Education Statistics) - STATE ID-01011255 Organizations: ALBUQUERQUE PUBLIC SCHOOLS (SCHOOL DISTRICT)
LA MESA ELEMENTARY (7500 COPPER NE in ALBUQUERQUE, NM)
(National Center for Education Statistics) - STATE ID-01011285 Organizations: ALBUQUERQUE PUBLIC SCHOOLS (SCHOOL DISTRICT)
REK CHEM MANUFACTURER (121 VIRGINIA STREET NORTHEAST in ALBUQUERQUE, NM)
(Integrated Compliance Information System) - ICIS-06-1989-0401, FORMAL ENFORCEMENT ACTION, ICIS-06-1986-0165, COMPLIANCE ACTIVITY (Tracking inspections of insecticide, fungicide, and rodenticide, and toxic substances)
BELLEFLOWER REALTY (812 VALENCIA NE in ALBUQUERQUE, NM)
(Integrated Compliance Information System) - ICIS-06-2002-0712, FORMAL ENFORCEMENT ACTION Business SIC classification: LESSORS OF REAL PROPERTY
INDUSTRIAL PLATING AND METAL FINISHING (312 FLORIDA ST SE in ALBUQUERQUE, NM)
(Integrated Compliance Information System) - ICIS-06-1999-0824, FORMAL ENFORCEMENT ACTION Business SIC classification: ELECTROPLATING, PLATING, POLISHING, ANODIZING, AND COLORING
LOVELACE RESPIRATORY RESEARCH INSTITUTE (2425 RIDGECREST DRIVE SOUTHEAST in ALBUQUERQUE, NM)
AIR MINOR (AIRS/AFS) Small Quantity Generators, between 100 kg and 1000 kg of hazardous waste/month (Resource Conservation and Recovery Act (tracking hazardous waste)) Business SIC classification: NONCOMMERCIAL RESEARCH ORGANIZATIONS Organizations: LOVELACE RESPIRATORY RESARCH INSTITUTE (CONTACT/OPERATOR)
, THE LOVELACE INSTITUTES (CONTACT/OWNER)
Alternative names: THE LOVELACE INSTITUTES
ATRISCO 66 (4617 CENTRAL NW in ALBUQUERQUE, NM)
AIR MINOR (AIRS/AFS) Business SIC classification: GASOLINE SERVICE STATIONS Alternative names: PHILLIPS 66 #28013, PHILLIPS 66 SERVICE STATION #28013
HIGHLAND CHEVRON (4320 LEAD SE in ALBUQUERQUE, NM)
AIR MINOR (AIRS/AFS) Business SIC classification: GASOLINE SERVICE STATIONS Alternative names: EVER-READY OIL CO INC PETROLINK
Housing units lacking complete plumbing facilities: 0.8% Housing units lacking complete kitchen facilities: 1.1%
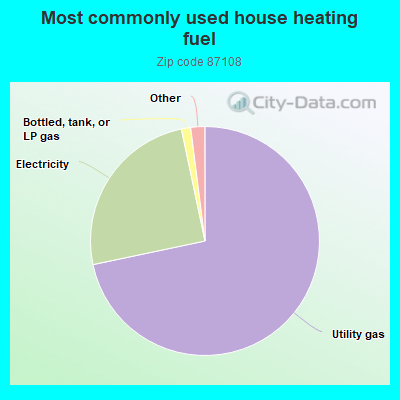
71.7%Utility gas
25.0%Electricity
1.3%Bottled, tank, or LP gas
0.8%No fuel used
0.7%Wood
Population in 1990: 36,704. Population change in the 1990s: +1,007 (+2.7%).
Place of birth for U.S.-born residents:
This state: 16,018
Northeast: 1,751
Midwest: 3,066
South: 3,758
West: 4,550
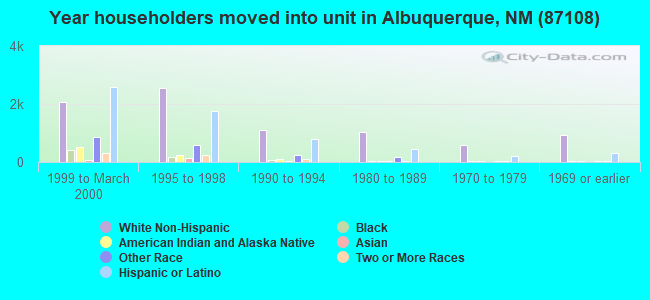
42% of the 87108 zip code residents lived in the same house 5 years ago. Out of people who lived in different houses, 60% lived in this county. Out of people who lived in different counties, 50% lived in New Mexico.
84% of the 87108 zip code residents lived in the same house 1 year ago. Out of people who lived in different houses, 59% moved from this county. Out of people who lived in different houses, 15% moved from different county within same state. Out of people who lived in different houses, 13% moved from different state. Out of people who lived in different houses, 7% moved from abroad.
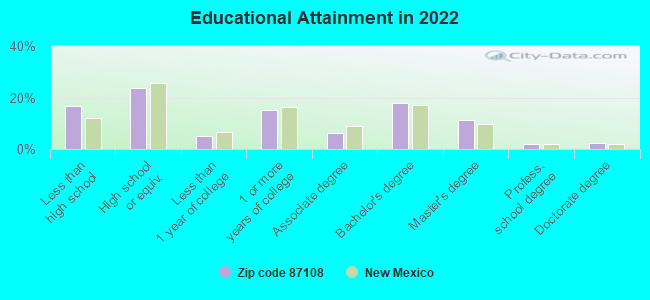
Private vs. public school enrollment:
Students in private schools in grades 1 to 8 (elementary and middle school): 143
Here:
4.7%
New Mexico:
10.2%
Students in private schools in grades 9 to 12 (high school): 87
Here:
6.3%
New Mexico:
10.0%
Students in private undergraduate colleges: 83
Here:
6.2%
New Mexico:
12.3%
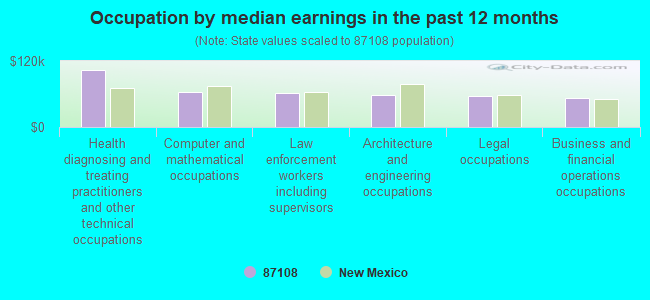
Occupation by median earnings in the past 12 months ($)
103,243Health diagnosing and treating practitioners and other technical occupations
62,728Computer and mathematical occupations
62,335Law enforcement workers including supervisors
58,556Architecture and engineering occupations
55,991Legal occupations
52,613Business and financial operations occupations
Companies with biggest federal contracts located in this zip code (ALBUQUERQUE, NM):
FIORE INDUSTRIES INC (5301 CENTRAL AVE NE STE 90; small business) : $23,070,843 in 111 contractsfrom 1999 to 2006
Contracts for Other Management Support Services, Services -- Basic Research (R&D), Technical Representation Services -- Miscellaneous, Weapons -- Advanced Development (R&D), and moreby ENERGY, Department of, Army, Air Force, Forest Service, and others Signed by year:2000: $2,805,418; 2001: $3,444,460; 2002: $3,826,944; 2003: $6,181,063; 2004: $2,985,401; 2005: $2,702,342; 2006: $992,215.
Biggest contracts:
$2,592,000 with ENERGY, Department of for Other Management Support Services. Signed on 2001-07-15. Completion date: 2002-07-15.
$2,553,021, same as above.Signed on 2003-02-15. Completion date: 2004-02-15.
$2,553,000, same as above.Signed on 2002-07-15. Completion date: 2003-07-15.
$2,167,000, same as above.Signed on 2000-07-15. Completion date: 2001-07-15.
K L HOUSE CONSTRUCTION COMPANY (6409 ACOMA RD SE; small business) : $22,825,862 in 55 contractsfrom 2000 to 2005
Contracts for Construction of Structures and Facilities -- Other Administrative Facilities and Service Buildings, Construction of Structures and Facilities -- Miscellaneous Buildings, Construction of Structures and Facilities -- Office Buildings by Army Signed by year:2000: $2,336,380; 2001: $6,937,990; 2002: $12,432,363; 2003: $341,249; 2004: $539,198; 2005: $238,682; 2006: $0.
Biggest contracts:
$12,199,950 with Army for Construction of Structures and Facilities -- Other Administrative Facilities and Service Buildings. Signed on 2002-08-23. Completion date: 2004-02-08.
$6,282,000, same as above.Signed on 2001-09-18. Completion date: 2003-03-15.
$2,194,700 with Army for Construction of Structures and Facilities -- Miscellaneous Buildings. Signed on 2000-05-09. Completion date: 2000-07-31.
$152,205 with Army for Construction of Structures and Facilities -- Other Administrative Facilities and Service Buildings. Signed on 2004-02-23. Completion date: 2004-02-23.
TERRADIGM, INC (401 ALVARADO DR SE STE G; small business) : $21,383,435 in 317 contractsfrom 1999 to 2006
Contracts for ADP Systems Development Services, Other Professional Services, Program Management/Support Services, Weapons -- Management and Support (R&D), and moreby Army, ENERGY, Department of, Air Force, Federal Technology Service, and others Signed by year:2000: $1,754,198; 2001: $2,582,303; 2002: $4,435,747; 2003: $3,458,632; 2004: $2,608,596; 2005: $3,781,183; 2006: $1,914,776.
Biggest contracts:
$647,258 with Army for ADP Systems Development Services. Signed on 2002-07-26. Completion date: 2003-07-28.
$575,000 with ENERGY, Department of for Other Professional Services. Signed on 1999-11-15. Completion date: 2001-11-15.
$565,000 with Air Force for Program Management/Support Services. Signed on 2000-03-28. Completion date: 2002-10-08.
$476,461 with Army for Other Professional Services. Signed on 2001-07-03. Completion date: 2001-10-31.
SHAW ENVIRONMENTAL, INC (5301 CENTRAL AVE NE STE 70) : $7,320,000 in 3 contractsin 2005
$6,410,000 with U.S. Army Corps of Engineers - civil program financing only for Other Architect and Engineering Services. Taking place in NY. Signed on 2005-05-20. Completion date: 2006-05-20.
$900,000, same as above.Signed on 2005-09-02. Completion date: 2006-05-20.
$10,000 with Army for Other Special Studies and Analyses. Taking place in NV. Signed on 2005-09-08. Completion date: 2005-09-30.
VOSS SCIENTIFIC (418 WASHINGTON ST SE; small business) : $6,684,492 in 45 contractsfrom 2000 to 2006
Contracts for Weapons -- Advanced Development (R&D), Weapons -- Basic Research (R&D), Services -- Advanced Development (R&D), Weapons -- Applied Research and Exploratory Development (R&D), and moreby Air Force, Navy Signed by year:2000: $845,633; 2001: $1,635,936; 2002: $743,397; 2003: $380,378; 2004: $1,991,515; 2005: $365,723; 2006: $721,910.
Biggest contracts:
$750,000 with Air Force for Weapons -- Advanced Development (R&D). Signed on 2004-07-01. Completion date: 2006-09-29.
$600,000 with Air Force for Weapons -- Basic Research (R&D). Signed on 2004-07-29. Completion date: 2006-11-01.
$497,949 with Air Force for Services -- Advanced Development (R&D). Signed on 2001-06-21. Completion date: 2003-09-18.
$492,280 with Air Force for Weapons -- Applied Research and Exploratory Development (R&D). Signed on 2000-03-16. Completion date: 2001-02-28.
VICKS VITTLES (137 UTAH N E) : $5,569,752 in 18 contractsfrom 2002 to 2006
Contracts for Food Services, Custodial Janitorial Services by Air Force Signed by year:2000: $0; 2001: $0; 2002: $912,411; 2003: $1,124,394; 2004: $1,828,677; 2005: $1,639,886; 2006: $64,384.
Biggest contracts:
$1,462,947 with Air Force for Food Services. Signed on 2005-09-29. Completion date: 2006-09-15.
$1,414,385, same as above.Signed on 2004-09-16. Completion date: 2004-09-15.
$1,109,000 with Air Force for Custodial Janitorial Services. Signed on 2003-09-16. Completion date: 2003-06-30.
$912,411, same as above.Signed on 2002-01-07. Completion date: 2002-09-30.
TAN-O-ON MARKETING, INC (303 SAN MATEO BLVD , NE, S; small business) : $5,093,927 in 356 contractsfrom 2001 to 2006
Contracts for Fruits and Vegetables by Defense Logistics Agency Signed by year:2000: $0; 2001: $284,905; 2002: $553,198; 2003: $104,836; 2004: $1,375,961; 2005: $1,723,941; 2006: $1,051,086.
Biggest contracts:
$52,084 with Defense Logistics Agency for Fruits and Vegetables. Signed on 2004-12-16. Completion date: 2004-12-16.
$51,562, same as above.Signed on 2004-11-24. Completion date: 2004-11-24.
$49,676, same as above.Signed on 2002-07-11. Completion date: 2002-07-11.
$43,365, same as above.Signed on 2002-06-24. Completion date: 2002-06-24.
1ST NATIONS COMMUNITY HEALTHSO (5608 ZUNI ROAD SE) : $2,950,580 in 16 contractsfrom 1999 to 2004
Contracts for Other Medical Services, General Health Care Services, Personal Services Contracts by Public Health Service Signed by year:2000: $81,000; 2001: $867,000; 2002: $923,000; 2003: $0; 2004: $846,580; 2005: $0; 2006: $0.
Biggest contracts:
$846,580 with Public Health Service for Other Medical Services. Signed on 2004-05-21. Effective on 2004-05-17. Completion date: 2004-12-31.
$500,000 with Public Health Service for General Health Care Services. Signed on 2002-05-15. Completion date: 2002-12-15.
$500,000, same as above.Signed on 2001-06-15. Completion date: 2001-12-15.
$263,000, same as above.Signed on 2001-01-15. Completion date: 2001-12-15.
ENVIRONMENTAL ROBOTS INC (909 VRGINIA ST NE STE 205; small business) 7 employees, $460000 revenue. Woman Owned Business: $2,306,674 in 9 contractsfrom 2000 to 2003
Contracts for Other Defense -- Applied Research and Exploratory Development (R&D), Space Flight -- Advanced Development (R&D), Space Science and Applications -- Basic Research (R&D) by Navy, NASA Signed by year:2000: $1,238,111; 2001: $197,000; 2002: $522,000; 2003: $349,563; 2004: $0; 2005: $0; 2006: $0.
Biggest contracts:
$630,000 with Navy for Other Defense -- Applied Research and Exploratory Development (R&D). Signed on 2000-12-07. Completion date: 2003-08-31.
$608,111, same as above.Signed on 2000-01-11. Completion date: 2003-08-31.
$272,000, same as above.Signed on 2002-03-08. Completion date: 2003-08-31.
$250,000 with NASA for Space Flight -- Advanced Development (R&D). Signed on 2002-02-15. Completion date: 2004-01-15.
CHEYENNE BUILDING CONTRACTORS, (329 FLORIDA SE; small business) : $1,874,747 in 14 contractsfrom 1999 to 2002
Contracts for Construction of Structures and Facilities -- Miscellaneous Buildings, Maintenance, Repair or Alteration of Real Property -- Office Buildings, Maintenance, Repair or Alteration of Real Property -- Other Administrative Facilities and Service Buildings, Maintenance, Repair or Alteration of Real Property -- Miscellaneous Buildings, and moreby Army, Air Force Signed by year:2000: $1,204,884; 2001: $646,192; 2002: -$2,169; 2003: $0; 2004: $0; 2005: $0; 2006: $0.
Biggest contracts:
$614,884 with Army for Construction of Structures and Facilities -- Miscellaneous Buildings. Signed on 2001-09-27. Completion date: 2002-08-15.
$596,280 with Army for Maintenance, Repair or Alteration of Real Property -- Office Buildings. Signed on 2000-03-07. Completion date: 2001-03-07.
$193,337, same as above.Signed on 2000-02-04. Completion date: 2001-02-16.
$148,980 with Army for Maintenance, Repair or Alteration of Real Property -- Other Administrative Facilities and Service Buildings. Signed on 2000-09-26. Completion date: 2001-03-02.
Top industries in this zip code by the number of employees in 2005:
Health Care and Social Assistance: General Medical and Surgical Hospitals (over 1000 employees: 1 establishment, 250-499 employees: 1 establishment)
Management of Companies and Enterprises: Corporate, Subsidiary, and Regional Managing Offices (250-499: 2, 100-249: 1, 50-99: 2, 10-19: 3)
Health Care and Social Assistance: All Other Miscellaneous Ambulatory Health Care Services (500-999: 1, 20-49: 1, 1-4: 3)
Health Care and Social Assistance: Nursing Care Facilities (250-499: 1, 100-249: 1, 50-99: 1)
Finance and Insurance: Direct Health and Medical Insurance Carriers (250-499: 1, 100-249: 1, 20-49: 1, 5-9: 1, 1-4: 1)
Administrative and Support and Waste Management and Remediation Services: Temporary Help Services (250-499: 1, 50-99: 1, 20-49: 2)
Professional, Scientific, and Technical Services: Research and Development in the Physical, Engineering, and Life Sciences (100-249: 1, 50-99: 2, 20-49: 2, 5-9: 1, 1-4: 4)
People in group quarters in 2010:
443 people in nursing facilities/skilled-nursing facilities
172 people in residential treatment centers for adults
101 people in group homes intended for adults
35 people in residential treatment centers for juveniles (non-correctional)
29 people in workers' group living quarters and job corps centers
21 people in emergency and transitional shelters (with sleeping facilities) for people experiencing homelessness
People in group quarters in 2000:
528 people in nursing homes
365 people in other noninstitutional group quarters
77 people in other nonhousehold living situations
72 people in homes for the mentally retarded
17 people in religious group quarters
12 people in hospitals/wards and hospices for chronically ill
9 people in other hospitals or wards for chronically ill
4 people in homes for the mentally ill
3 people in hospices or homes for chronically ill
3 people in hospitals or wards for drug/alcohol abuse
Fatal accident statistics in 2014:
Fatal accident count: 4
Vehicles involved in fatal accidents: 4
Fatal accidents caused by drunken drivers: 0
Fatalities: 4
Persons involved in fatal accidents: 4
Pedestrians involved in fatal accidents: 4
Fatal accident statistics in 2013:
Fatal accident count: 4
Vehicles involved in fatal accidents: 5
Fatal accidents caused by drunken drivers: 1
Fatalities: 6
Persons involved in fatal accidents: 9
Pedestrians involved in fatal accidents: 2
Home Mortgage Disclosure Act Aggregated Statistics For Year 2009 (Based on 9 full and 4 partial tracts)
A) FHA, FSA/RHS & VA Home Purchase Loans
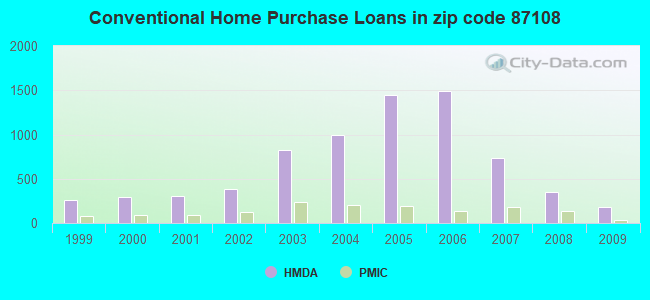
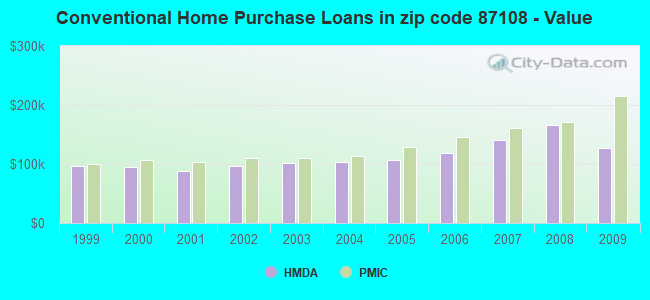
B) Conventional Home Purchase Loans
C) Refinancings
D) Home Improvement Loans
E) Loans on Dwellings For 5+ Families
F) Non-occupant Loans on < 5 Family Dwellings (A B C & D)
G) Loans On Manufactured Home Dwelling (A B C & D)
Number
Average Value
Number
Average Value
Number
Average Value
Number
Average Value
Number
Average Value
Number
Average Value
Number
Average Value
LOANS ORIGINATED
169
$147,004
181
$126,657
782
$150,010
75
$86,566
1
$67,000
134
$121,032
0
$0
APPLICATIONS APPROVED, NOT ACCEPTED
12
$98,992
23
$153,513
89
$150,653
7
$111,099
0
$0
16
$195,718
0
$0
APPLICATIONS DENIED
34
$138,196
45
$139,227
311
$153,435
41
$50,758
6
$429,543
67
$131,388
4
$71,762
APPLICATIONS WITHDRAWN
18
$134,399
32
$145,927
249
$141,962
11
$34,955
0
$0
44
$118,043
1
$100,000
FILES CLOSED FOR INCOMPLETENESS
4
$92,385
3
$161,517
44
$153,433
6
$84,852
0
$0
7
$95,616
0
$0
Aggregated Statistics For Year 2008 (Based on 9 full and 4 partial tracts)
A) FHA, FSA/RHS & VA Home Purchase Loans
B) Conventional Home Purchase Loans
C) Refinancings
D) Home Improvement Loans
E) Loans on Dwellings For 5+ Families
F) Non-occupant Loans on < 5 Family Dwellings (A B C & D)
G) Loans On Manufactured Home Dwelling (A B C & D)
Number
Average Value
Number
Average Value
Number
Average Value
Number
Average Value
Number
Average Value
Number
Average Value
Number
Average Value
LOANS ORIGINATED
147
$154,127
354
$166,385
632
$149,023
84
$62,296
14
$1,058,931
209
$135,969
0
$0
APPLICATIONS APPROVED, NOT ACCEPTED
3
$173,033
30
$194,550
65
$160,270
12
$55,573
1
$125,000
28
$123,696
2
$37,670
APPLICATIONS DENIED
23
$153,895
106
$157,569
365
$157,710
107
$66,353
3
$272,710
78
$161,192
13
$44,074
APPLICATIONS WITHDRAWN
9
$125,382
34
$171,587
196
$145,835
19
$78,519
0
$0
63
$139,039
0
$0
FILES CLOSED FOR INCOMPLETENESS
2
$123,590
8
$182,115
34
$172,814
12
$58,401
0
$0
11
$129,295
0
$0
Aggregated Statistics For Year 2007 (Based on 9 full and 4 partial tracts)
A) FHA, FSA/RHS & VA Home Purchase Loans
B) Conventional Home Purchase Loans
C) Refinancings
D) Home Improvement Loans
E) Loans on Dwellings For 5+ Families
F) Non-occupant Loans on < 5 Family Dwellings (A B C & D)
G) Loans On Manufactured Home Dwelling (A B C & D)
Number
Average Value
Number
Average Value
Number
Average Value
Number
Average Value
Number
Average Value
Number
Average Value
Number
Average Value
LOANS ORIGINATED
65
$155,334
739
$140,930
864
$140,431
196
$78,009
26
$817,418
398
$137,626
4
$110,138
APPLICATIONS APPROVED, NOT ACCEPTED
10
$120,398
145
$136,438
153
$161,738
34
$66,172
2
$192,220
97
$130,954
7
$67,991
APPLICATIONS DENIED
9
$146,979
228
$127,190
560
$139,823
141
$58,800
5
$989,256
175
$133,525
11
$43,684
APPLICATIONS WITHDRAWN
8
$134,288
102
$120,260
359
$133,205
37
$121,682
4
$695,990
83
$107,745
0
$0
FILES CLOSED FOR INCOMPLETENESS
2
$145,410
46
$118,618
92
$158,464
10
$102,513
2
$771,590
30
$116,155
2
$145,410
Aggregated Statistics For Year 2006 (Based on 9 full and 4 partial tracts)
A) FHA, FSA/RHS & VA Home Purchase Loans
B) Conventional Home Purchase Loans
C) Refinancings
D) Home Improvement Loans
E) Loans on Dwellings For 5+ Families
F) Non-occupant Loans on < 5 Family Dwellings (A B C & D)
G) Loans On Manufactured Home Dwelling (A B C & D)
Number
Average Value
Number
Average Value
Number
Average Value
Number
Average Value
Number
Average Value
Number
Average Value
Number
Average Value
LOANS ORIGINATED
78
$146,992
1,487
$118,105
842
$122,618
132
$53,466
36
$972,818
848
$111,892
6
$45,062
APPLICATIONS APPROVED, NOT ACCEPTED
7
$153,219
187
$98,940
177
$109,896
22
$50,722
2
$184,390
149
$104,920
4
$28,265
APPLICATIONS DENIED
8
$98,360
335
$103,219
568
$119,690
146
$63,002
4
$533,828
246
$109,512
21
$39,020
APPLICATIONS WITHDRAWN
6
$149,738
168
$108,167
441
$121,446
59
$75,963
2
$1,735,255
135
$110,173
4
$55,160
FILES CLOSED FOR INCOMPLETENESS
0
$0
50
$95,574
111
$134,363
4
$67,792
0
$0
43
$118,725
0
$0
Aggregated Statistics For Year 2005 (Based on 9 full and 4 partial tracts)
A) FHA, FSA/RHS & VA Home Purchase Loans
B) Conventional Home Purchase Loans
C) Refinancings
D) Home Improvement Loans
E) Loans on Dwellings For 5+ Families
F) Non-occupant Loans on < 5 Family Dwellings (A B C & D)
G) Loans On Manufactured Home Dwelling (A B C & D)
Number
Average Value
Number
Average Value
Number
Average Value
Number
Average Value
Number
Average Value
Number
Average Value
Number
Average Value
LOANS ORIGINATED
123
$128,318
1,446
$107,217
855
$110,398
89
$69,311
48
$772,700
855
$101,614
6
$53,732
APPLICATIONS APPROVED, NOT ACCEPTED
17
$117,841
180
$84,944
126
$100,552
7
$92,857
2
$501,075
89
$75,636
10
$59,999
APPLICATIONS DENIED
11
$93,318
320
$85,245
558
$107,654
96
$52,959
4
$213,015
182
$94,663
27
$34,726
APPLICATIONS WITHDRAWN
9
$134,084
223
$101,301
357
$117,960
63
$106,247
0
$0
147
$131,602
2
$132,640
FILES CLOSED FOR INCOMPLETENESS
1
$120,000
27
$69,466
69
$119,920
10
$34,929
2
$678,320
18
$92,952
2
$75,925
Aggregated Statistics For Year 2004 (Based on 9 full and 4 partial tracts)
A) FHA, FSA/RHS & VA Home Purchase Loans
B) Conventional Home Purchase Loans
C) Refinancings
D) Home Improvement Loans
E) Loans on Dwellings For 5+ Families
F) Non-occupant Loans on < 5 Family Dwellings (A B C & D)
G) Loans On Manufactured Home Dwelling (A B C & D)
Number
Average Value
Number
Average Value
Number
Average Value
Number
Average Value
Number
Average Value
Number
Average Value
Number
Average Value
LOANS ORIGINATED
195
$118,793
1,000
$104,025
904
$102,106
136
$49,176
32
$416,667
625
$95,386
5
$34,776
APPLICATIONS APPROVED, NOT ACCEPTED
2
$119,175
162
$105,085
170
$100,258
14
$91,189
6
$398,197
122
$98,464
4
$57,922
APPLICATIONS DENIED
21
$118,615
244
$84,110
443
$95,528
71
$42,247
5
$401,400
147
$84,746
21
$33,391
APPLICATIONS WITHDRAWN
23
$126,037
158
$91,725
331
$106,519
14
$84,429
2
$86,500
97
$87,560
9
$63,002
FILES CLOSED FOR INCOMPLETENESS
0
$0
14
$206,557
37
$109,725
4
$36,785
0
$0
6
$70,403
0
$0
Aggregated Statistics For Year 2003 (Based on 9 full and 4 partial tracts)
A) FHA, FSA/RHS & VA Home Purchase Loans
B) Conventional Home Purchase Loans
C) Refinancings
D) Home Improvement Loans
E) Loans on Dwellings For 5+ Families
F) Non-occupant Loans on < 5 Family Dwellings (A B C & D)
Number
Average Value
Number
Average Value
Number
Average Value
Number
Average Value
Number
Average Value
Number
Average Value
LOANS ORIGINATED
217
$111,105
829
$101,727
2,013
$97,483
82
$19,096
17
$542,524
707
$90,052
APPLICATIONS APPROVED, NOT ACCEPTED
4
$99,388
101
$86,039
255
$95,187
10
$36,508
2
$234,020
92
$86,075
APPLICATIONS DENIED
35
$101,943
167
$79,948
564
$99,060
65
$28,532
4
$1,115,805
149
$85,683
APPLICATIONS WITHDRAWN
11
$96,391
101
$116,785
378
$104,778
10
$10,009
0
$0
95
$93,366
FILES CLOSED FOR INCOMPLETENESS
5
$111,740
18
$103,078
90
$98,722
2
$34,945
0
$0
34
$89,524
Aggregated Statistics For Year 2002 (Based on 6 full and 2 partial tracts)
A) FHA, FSA/RHS & VA Home Purchase Loans
B) Conventional Home Purchase Loans
C) Refinancings
D) Home Improvement Loans
E) Loans on Dwellings For 5+ Families
F) Non-occupant Loans on < 5 Family Dwellings (A B C & D)
Number
Average Value
Number
Average Value
Number
Average Value
Number
Average Value
Number
Average Value
Number
Average Value
LOANS ORIGINATED
197
$100,332
383
$96,594
807
$93,034
31
$17,705
8
$483,998
262
$99,427
APPLICATIONS APPROVED, NOT ACCEPTED
18
$84,381
75
$68,829
106
$85,370
6
$47,728
0
$0
25
$100,674
APPLICATIONS DENIED
10
$134,389
95
$71,248
279
$92,514
37
$19,081
2
$343,875
49
$78,468
APPLICATIONS WITHDRAWN
12
$95,919
38
$121,986
196
$94,012
4
$7,175
0
$0
25
$95,312
FILES CLOSED FOR INCOMPLETENESS
2
$51,830
12
$99,242
45
$88,335
2
$43,230
2
$659,220
8
$75,279
Aggregated Statistics For Year 2001 (Based on 6 full and 2 partial tracts)
A) FHA, FSA/RHS & VA Home Purchase Loans
B) Conventional Home Purchase Loans
C) Refinancings
D) Home Improvement Loans
E) Loans on Dwellings For 5+ Families
F) Non-occupant Loans on < 5 Family Dwellings (A B C & D)
Number
Average Value
Number
Average Value
Number
Average Value
Number
Average Value
Number
Average Value
Number
Average Value
LOANS ORIGINATED
189
$97,580
305
$87,794
604
$86,149
59
$22,456
6
$695,160
222
$84,031
APPLICATIONS APPROVED, NOT ACCEPTED
8
$104,882
100
$51,177
76
$81,561
12
$31,463
0
$0
31
$82,007
APPLICATIONS DENIED
16
$101,731
162
$56,159
329
$76,301
29
$20,946
0
$0
75
$95,378
APPLICATIONS WITHDRAWN
12
$81,698
49
$67,252
151
$86,196
17
$21,105
2
$148,885
21
$96,806
FILES CLOSED FOR INCOMPLETENESS
0
$0
10
$74,927
33
$98,005
2
$26,530
0
$0
10
$79,255
Aggregated Statistics For Year 2000 (Based on 6 full and 2 partial tracts)
A) FHA, FSA/RHS & VA Home Purchase Loans
B) Conventional Home Purchase Loans
C) Refinancings
D) Home Improvement Loans
E) Loans on Dwellings For 5+ Families
F) Non-occupant Loans on < 5 Family Dwellings (A B C & D)
Number
Average Value
Number
Average Value
Number
Average Value
Number
Average Value
Number
Average Value
Number
Average Value
LOANS ORIGINATED
104
$93,196
295
$94,448
237
$71,465
55
$22,629
4
$607,988
109
$75,335
APPLICATIONS APPROVED, NOT ACCEPTED
0
$0
33
$90,382
50
$72,840
34
$27,545
0
$0
13
$59,564
APPLICATIONS DENIED
29
$82,082
200
$53,757
299
$83,952
54
$17,943
0
$0
61
$82,167
APPLICATIONS WITHDRAWN
23
$56,443
37
$77,106
99
$80,953
16
$20,968
0
$0
18
$88,742
FILES CLOSED FOR INCOMPLETENESS
4
$102,030
18
$82,907
24
$113,187
0
$0
0
$0
6
$85,478
Aggregated Statistics For Year 1999 (Based on 4 full and 2 partial tracts)
A) FHA, FSA/RHS & VA Home Purchase Loans
B) Conventional Home Purchase Loans
C) Refinancings
D) Home Improvement Loans
E) Loans on Dwellings For 5+ Families
F) Non-occupant Loans on < 5 Family Dwellings (A B C & D)
2003 - 2018 National Fire Incident Reporting System (NFIRS) incidents
According to the data from the years 2003 - 2018 the average number of fire incidents per year is 474. The highest number of fires - 1,306 took place in 2017, and the least - 26 in 2006. The data has an increasing trend.
When looking into fire subcategories, the most incidents belonged to: Outside Fires (41.7%), and Structure Fires (38.4%).
Fire incident types reported to NFIRS in Zip Code 87108


 Nearest zip codes: 87110, 87116, 87106, 87117, 87112, 87102.


 According to the data from the years 2003 - 2018 the average number of fire incidents per year is 474. The highest number of fires - 1,306 took place in 2017, and the least - 26 in 2006. The data has an increasing trend.
 When looking into fire subcategories, the most incidents belonged to: Outside Fires (41.7%), and Structure Fires (38.4%).