Estimated zip code population in 2022: 40,420 Zip code population in 2010: 38,587 Zip code population in 2000: 38,417
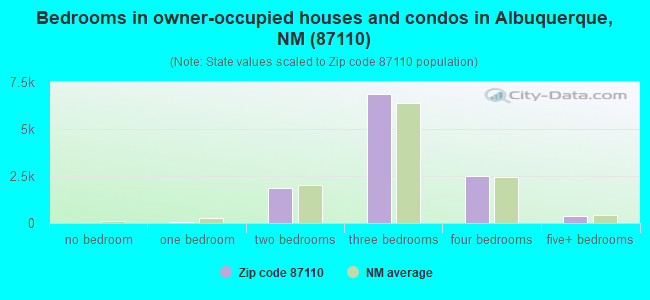
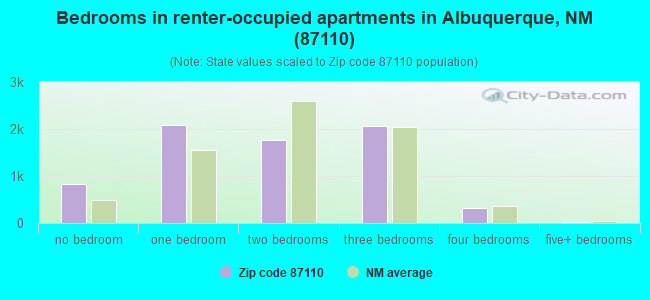
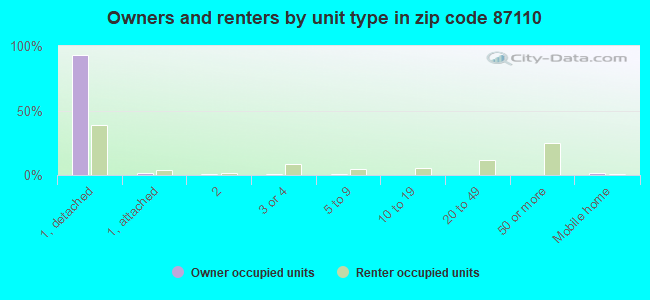
Houses and condos: 19,749 Renter-occupied apartments: 7,071
% of renters here:
38%
State:
29%
March 2022 cost of living index in zip code 87110: 93.9 (less than average, U.S. average is 100)
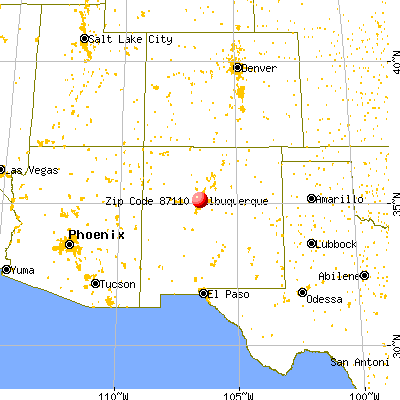
Land area: 8.6 sq. mi. Water area: 0.0 sq. mi.
Population density: 4,681 people per square mile
(average).
OSM Map
General Map
Google Map
MSN Map
OSM Map
General Map
Google Map
MSN Map
OSM Map
General Map
Google Map
MSN Map
OSM Map
General Map
Google Map
MSN Map
Please wait while loading the map...
Real estate property taxes paid for housing units in 2022:
This zip code:
0.9% ($2,444)
New Mexico:
0.7% ($1,638)
Median real estate property taxes paid for housing units with mortgages in 2022: $2,418 (0.9%) Median real estate property taxes paid for housing units with no mortgage in 2022: $2,426 (0.9%)
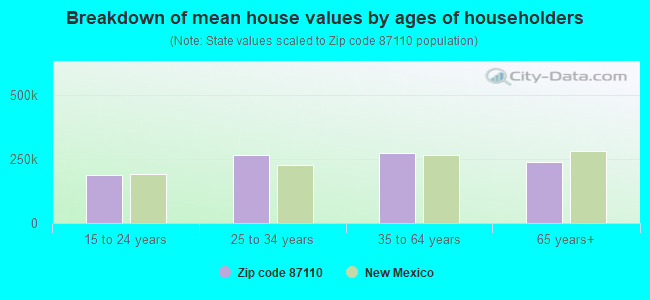
Estimated median house/condo value in 2022: $267,185
87110:
$267,185
New Mexico:
$243,100
According to our research of New Mexico and other state lists, there were 34 registered sex offenders living in 87110 zip code as of April 27, 2024. The ratio of all residents to sex offenders in zip code 87110 is 1,136 to 1. The ratio of registered sex offenders to all residents in this zip code is lower than the state average.
Median resident age:
This zip code:
41.4 years
New Mexico median age:
39.4 years
Average household size:
This zip code:
2.1 people
New Mexico:
2.4 people
Averages for the 2020 tax year for zip code 87110, filed in 2021:
Average Adjusted Gross Income (AGI) in 2020: $58,558 (Individual Income Tax Returns)
Here:
$58,558
State:
$59,146
Salary/wage: $49,469 (reported on 77.6% of returns)
Here:
$49,469
State:
$48,327
(% of AGI for various income ranges: 1098.6% for AGIs below $25k, 3436.1% for AGIs $25k-50k, 6475.6% for AGIs $50k-75k, 9339.4% for AGIs $75k-100k, 17350.5% for AGIs $100k-200k, 62311.1% for AGIs over 200k)
Taxable interest for individuals: $1,532 (reported on 35.5% of returns)
This zip code:
$1,532
New Mexico:
$1,616
(% of AGI for various income ranges: 19.6% for AGIs below $25k, 31.7% for AGIs $25k-50k, 50.2% for AGIs $50k-75k, 93.2% for AGIs $75k-100k, 222.4% for AGIs $100k-200k, 2032.2% for AGIs over 200k)
Ordinary dividends: $6,893 (reported on 18.9% of returns)
Here:
$6,893
State:
$7,816
(% of AGI for various income ranges: 27.5% for AGIs below $25k, 39.9% for AGIs $25k-50k, 95.0% for AGIs $50k-75k, 249.4% for AGIs $75k-100k, 589.8% for AGIs $100k-200k, 5934.4% for AGIs over 200k)
Net capital gain/loss in AGI: +$12,933 (reported on 16.9% of returns)
Here:
+$12,933
State:
+$19,595
(% of AGI for various income ranges: 9.5% for AGIs below $25k, 30.0% for AGIs $25k-50k, 97.5% for AGIs $50k-75k, 256.2% for AGIs $75k-100k, 772.0% for AGIs $100k-200k, 14961.7% for AGIs over 200k)
Profit/loss from business: +$11,139 (reported on 14.1% of returns)
Here:
+$11,139
State:
+$11,430
(% of AGI for various income ranges: 104.3% for AGIs below $25k, 125.5% for AGIs $25k-50k, 189.0% for AGIs $50k-75k, 283.8% for AGIs $75k-100k, 694.9% for AGIs $100k-200k, 2920.6% for AGIs over 200k)
Taxable individual retirement arrangement distribution: $17,394 (reported on 8.8% of returns)
87110:
$17,394
New Mexico:
$20,970
(% of AGI for various income ranges: 50.8% for AGIs below $25k, 75.6% for AGIs $25k-50k, 167.4% for AGIs $50k-75k, 326.1% for AGIs $75k-100k, 816.6% for AGIs $100k-200k, 4160.0% for AGIs over 200k)
Self-employed (Keogh) retirement plans: $20,657 (reported on 0.4% of returns)
87110:
$20,657
New Mexico:
$20,997
(% of AGI for various income ranges: 7.9% for AGIs $25k-50k, 89.8% for AGIs $100k-200k)
Total itemized deductions: $28,994 (reported on 6.1% of returns)
Here:
$28,994
State:
$33,187
(% of AGI for various income ranges: 36.7% for AGIs below $25k, 87.9% for AGIs $25k-50k, 223.2% for AGIs $50k-75k, 464.0% for AGIs $75k-100k, 869.0% for AGIs $100k-200k, 5041.7% for AGIs over 200k)
Charity contributions: $9,296 (reported on 4.6% of returns)
Here:
$9,296
State:
$11,850
(% of AGI for various income ranges: 1.3% for AGIs below $25k, 11.7% for AGIs $25k-50k, 33.2% for AGIs $50k-75k, 92.8% for AGIs $75k-100k, 230.5% for AGIs $100k-200k, 1877.8% for AGIs over 200k)
Taxes paid: $6,611 (reported on 6.1% of returns)
87110:
$6,611
State:
$7,150
(% of AGI for various income ranges: 2.3% for AGIs below $25k, 12.8% for AGIs $25k-50k, 47.8% for AGIs $50k-75k, 116.7% for AGIs $75k-100k, 252.6% for AGIs $100k-200k, 1072.8% for AGIs over 200k)
Earned income credit: $1,843 (reported on 14.8% of returns)
Here:
$1,843
State:
$2,323
(% of AGI for various income ranges: 70.1% for AGIs below $25k, 48.9% for AGIs $25k-50k, 0.7% for AGIs $50k-75k)
Percentage of individuals using paid preparers for their 2020 taxes: 91.2%
Here:
91%
State:
92%
(% for various income ranges: 90.6% for AGIs below $25k, 92.4% for AGIs $25k-50k, 90.6% for AGIs $50k-75k, 90.6% for AGIs $75k-100k, 91.2% for AGIs $100k-200k, 91.8% for AGIs over 200k)
Averages for the 2012 tax year for zip code 87110, filed in 2013:
Average Adjusted Gross Income (AGI) in 2012: $52,385 (Individual Income Tax Returns)
Here:
$52,385
State:
$50,343
Salary/wage: $42,110 (reported on 78.5% of returns)
Here:
$42,110
State:
$41,171
(% of AGI for various income ranges: 73.1% for AGIs below $25k, 77.2% for AGIs $25k-50k, 68.7% for AGIs $50k-75k, 68.9% for AGIs $75k-100k, 65.1% for AGIs $100k-200k, 36.4% for AGIs over 200k)
Taxable interest for individuals: $1,776 (reported on 35.8% of returns)
This zip code:
$1,776
New Mexico:
$1,677
(% of AGI for various income ranges: 1.4% for AGIs below $25k, 0.8% for AGIs $25k-50k, 1.2% for AGIs $50k-75k, 1.1% for AGIs $75k-100k, 1.5% for AGIs $100k-200k, 1.3% for AGIs over 200k)
Ordinary dividends: $5,717 (reported on 21.3% of returns)
Here:
$5,717
State:
$6,939
(% of AGI for various income ranges: 1.8% for AGIs below $25k, 1.3% for AGIs $25k-50k, 1.8% for AGIs $50k-75k, 1.8% for AGIs $75k-100k, 3.1% for AGIs $100k-200k, 3.4% for AGIs over 200k)
Net capital gain/loss in AGI: +$10,811 (reported on 16.4% of returns)
Here:
+$10,811
State:
+$14,311
(% of AGI for various income ranges: 0.4% for AGIs $25k-50k, 0.5% for AGIs $50k-75k, 0.9% for AGIs $75k-100k, 2.0% for AGIs $100k-200k, 12.8% for AGIs over 200k)
Profit/loss from business: +$11,464 (reported on 14.2% of returns)
Here:
+$11,464
State:
+$11,059
(% of AGI for various income ranges: 6.4% for AGIs below $25k, 1.7% for AGIs $25k-50k, 2.6% for AGIs $50k-75k, 2.8% for AGIs $75k-100k, 3.9% for AGIs $100k-200k, 2.6% for AGIs over 200k)
Taxable individual retirement arrangement distribution: $12,836 (reported on 11.2% of returns)
87110:
$12,836
New Mexico:
$15,706
(% of AGI for various income ranges: 2.4% for AGIs below $25k, 1.8% for AGIs $25k-50k, 2.7% for AGIs $50k-75k, 3.0% for AGIs $75k-100k, 3.9% for AGIs $100k-200k, 2.4% for AGIs over 200k)
Self-employment retirement plans: $13,682 (reported on 0.6% of returns)
87110:
$13,682
New Mexico:
$18,209
(% of AGI for various income ranges: 0.2% for AGIs $25k-50k, 0.3% for AGIs $100k-200k, 0.3% for AGIs over 200k)
Total itemized deductions: $19,201 (18% of AGI, reported on 29.2% of returns)
Here:
$19,201
State:
$21,709
Here:
18.5% of AGI
State:
19.8% of AGI
(% of AGI for various income ranges: 8.2% for AGIs below $25k, 10.2% for AGIs $25k-50k, 12.1% for AGIs $50k-75k, 12.0% for AGIs $75k-100k, 12.4% for AGIs $100k-200k, 8.7% for AGIs over 200k)
Charity contributions: $3,740 (reported on 22.8% of returns)
Here:
$3,740
State:
$4,195
(% of AGI for various income ranges: 0.5% for AGIs below $25k, 0.9% for AGIs $25k-50k, 1.5% for AGIs $50k-75k, 1.8% for AGIs $75k-100k, 2.3% for AGIs $100k-200k, 2.1% for AGIs over 200k)
Taxes paid: $5,745 (reported on 29.1% of returns)
87110:
$5,745
State:
$6,176
(% of AGI for various income ranges: 1.5% for AGIs below $25k, 2.0% for AGIs $25k-50k, 3.1% for AGIs $50k-75k, 3.4% for AGIs $75k-100k, 4.3% for AGIs $100k-200k, 3.8% for AGIs over 200k)
Earned income credit: $1,827 (reported on 17.4% of returns)
Here:
$1,827
State:
$2,311
(% of AGI for various income ranges: 4.9% for AGIs below $25k, 0.8% for AGIs $25k-50k)
Percentage of individuals using paid preparers for their 2012 taxes: 41.5%
Here:
41%
State:
50%
(% for various income ranges: 36.8% for AGIs below $25k, 40.6% for AGIs $25k-50k, 45.5% for AGIs $50k-75k, 44.6% for AGIs $75k-100k, 50.3% for AGIs $100k-200k, 71.8% for AGIs over 200k)
Averages for the 2004 tax year for zip code 87110, filed in 2005:
Average Adjusted Gross Income (AGI) in 2004: $41,514 (Individual Income Tax Returns)
Here:
$41,514
State:
$39,572
Salary/wage: $34,954 (reported on 78.6% of returns)
Here:
$34,954
State:
$34,237
(% of AGI for various income ranges: 121.4% for AGIs below $10k, 72.7% for AGIs $10k-25k, 75.6% for AGIs $25k-50k, 69.5% for AGIs $50k-75k, 68.0% for AGIs $75k-100k, 51.6% for AGIs over 100k)
Taxable interest for individuals: $2,320 (reported on 45.7% of returns)
This zip code:
$2,320
New Mexico:
$1,873
(% of AGI for various income ranges: 6.9% for AGIs below $10k, 2.7% for AGIs $10k-25k, 2.0% for AGIs $25k-50k, 2.3% for AGIs $50k-75k, 2.1% for AGIs $75k-100k, 3.0% for AGIs over 100k)
Taxable dividends: $3,736 (reported on 27.0% of returns)
Here:
$3,736
State:
$3,554
(% of AGI for various income ranges: 4.8% for AGIs below $10k, 1.9% for AGIs $10k-25k, 1.5% for AGIs $25k-50k, 1.8% for AGIs $50k-75k, 2.1% for AGIs $75k-100k, 3.7% for AGIs over 100k)
Net capital gain/loss: +$8,405 (reported on 21.5% of returns)
Here:
+$8,405
State:
+$10,425
(% of AGI for various income ranges: -1.0% for AGIs below $10k, 0.3% for AGIs $10k-25k, 0.7% for AGIs $25k-50k, 1.1% for AGIs $50k-75k, 1.9% for AGIs $75k-100k, 11.7% for AGIs over 100k)
Profit/loss from business: +$10,473 (reported on 14.1% of returns)
Here:
+$10,473
State:
+$8,875
(% of AGI for various income ranges: 5.6% for AGIs below $10k, 4.6% for AGIs $10k-25k, 2.5% for AGIs $25k-50k, 2.8% for AGIs $50k-75k, 3.8% for AGIs $75k-100k, 4.2% for AGIs over 100k)
IRA payment deduction: $2,849 (reported on 3.0% of returns)
87110:
$2,849
New Mexico:
$2,940
(% of AGI for various income ranges: 0.4% for AGIs below $10k, 0.2% for AGIs $10k-25k, 0.3% for AGIs $25k-50k, 0.2% for AGIs $50k-75k, 0.2% for AGIs $75k-100k, 0.1% for AGIs over 100k)
Self-employed pension: $10,095 (reported on 0.9% of returns)
Here:
$10,095
New Mexico:
$13,110
(% of AGI for various income ranges: 0.0% for AGIs $10k-25k, 0.0% for AGIs $25k-50k, 0.2% for AGIs $50k-75k, 0.3% for AGIs $75k-100k, 0.4% for AGIs over 100k)
Total itemized deductions: $16,295 (21% of AGI, reported on 32.4% of returns)
Here:
$16,295
State:
$18,103
Here:
21.2% of AGI
State:
21.5% of AGI
(% of AGI for various income ranges: 14.2% for AGIs below $10k, 8.4% for AGIs $10k-25k, 12.8% for AGIs $25k-50k, 13.6% for AGIs $50k-75k, 14.3% for AGIs $75k-100k, 12.8% for AGIs over 100k)
Charity contributions deductions: $2,852 (3% of AGI, reported on 27.0% of returns)
Here:
$2,852
State:
$3,246
Here:
3.4% of AGI
State:
3.6% of AGI
(% of AGI for various income ranges: 0.7% for AGIs below $10k, 0.8% for AGIs $10k-25k, 1.3% for AGIs $25k-50k, 1.8% for AGIs $50k-75k, 2.4% for AGIs $75k-100k, 2.5% for AGIs over 100k)
Total tax: $6,172 (reported on 76.7% of returns)
87110:
$6,172
State:
$6,237
(% of AGI for various income ranges: 3.4% for AGIs below $10k, 4.5% for AGIs $10k-25k, 7.4% for AGIs $25k-50k, 9.9% for AGIs $50k-75k, 11.2% for AGIs $75k-100k, 18.1% for AGIs over 100k)
Earned income credit: $1,427 (reported on 14.8% of returns)
Here:
$1,427
State:
$1,796
Percentage of individuals using paid preparers for their 2004 taxes: 49.5%
Here:
49%
State:
57%
(% for various income ranges: 47.6% for AGIs below $10k, 50.0% for AGIs $10k-25k, 47.9% for AGIs $25k-50k, 50.1% for AGIs $50k-75k, 47.0% for AGIs $75k-100k, 60.0% for AGIs over 100k)
Likely homosexual households (counted as self-reported same-sex unmarried-partner households)
Lesbian couples: 0.6% of all households
Gay men: 0.5% of all households
Household received Food Stamps/SNAP in the past 12 months: 3,791 Household did not receive Food Stamps/SNAP in the past 12 months: 15,118
Women who had a birth in the past 12 months: 405 (195 now married, 183 unmarried) Women who did not have a birth in the past 12 months: 9,502 (3,089 now married, 6,429 unmarried)
Housing units in zip code 87110 with a mortgage: 7,326 (667 second mortgage, 10 home equity loan, 393 both second mortgage and home equity loan) Houses without a mortgage: 119
Median monthly owner costs for units with a mortgage: $1,384 Median monthly owner costs for units without a mortgage: $505
Residents with income below the poverty level in 2022:
This zip code:
13.1%
Whole state:
17.6%
Residents with income below 50% of the poverty level in 2022:
This zip code:
6.6%
Whole state:
9.7%
Median number of rooms in houses and condos:
Here:
6.3
State:
5.9
Median number of rooms in apartments:
Here:
3.9
State:
4.2
Notable locations in this zip code not listed on our city pages
Notable locations in zip code 87110: Laramie Square (A), San Mateo Square (B), Albuquerque Fire Department Station 13 (C). Display/hide their locations on the map
Shopping Centers: Town and Country Shopping Center (1), Uptown Shopping Center (2), La Mesa Shopping Center (3), Altura Shopping Center (4), Winrock Shopping Center (5), Park Square Shopping Center (6), Hoffmantown Shopping Center (7), Encantada Square Shopping Center (8), Coronado Shopping Center (9). Display/hide their locations on the map
Churches in zip code 87110 include: Temple Baptist Academy (A), Sombra del Monte Church (B), Queen of Heaven Church (C), Congregation Albert (D), Bel-Air Mission (E), Reformed Church (F), Hope Church (G), Carlisle Plaza United Methodist Church (H), Neighborhood Church (I). Display/hide their locations on the map
Parks in zip code 87110 include: Prospect Park (1), Prado del Sol (2), Altura Park (3), Alvarado Park (4), Beverly Park (5), McDuffie Park (6), Montgomery Park (7), Grisham Park (8), Stardust Skies Park (9). Display/hide their locations on the map
Tourist attractions (not listed on the city page) : Glowgolf (Amusement & Theme Parks; 6600 Menaul Boulevard Northeast Ofc), Tilt (Amusement & Theme Parks; 704 Coronado Centre), Leisure Bowl (Amusement & Theme Parks; 7400 Lomas Boulevard Northeast), Pilot Shop Western Skies (4503 Menaul Boulevard Northeast), Tour New Mexico Inc (6101 Candelaria Road Northeast), Sun Tours (Tours & Charters; 4300 San Mateo Boulevard Northeast Suite B155), Going Places Travel (Tours & Charters; 6400 Uptown Boulevard Northeast Suite 429E).
3,360 married couples with children.
3,195 single-parent households (1,320 men, 1,875 women).
81.0% of residents of 87110 zip code speak English at home.
14.8% of residents speak Spanish at home (76% very well, 19% well, 3% not well, 3% not at all).
1.9% of residents speak other Indo-European language at home (58% very well, 31% well, 12% not well).
1.6% of residents speak Asian or Pacific Island language at home (51% very well, 24% well, 25% not well).
2.1% of residents speak other language at home (87% very well, 8% well, 5% not well).
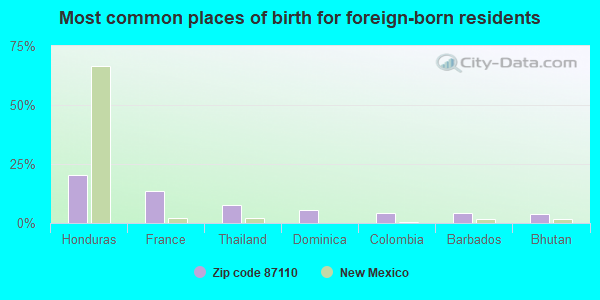
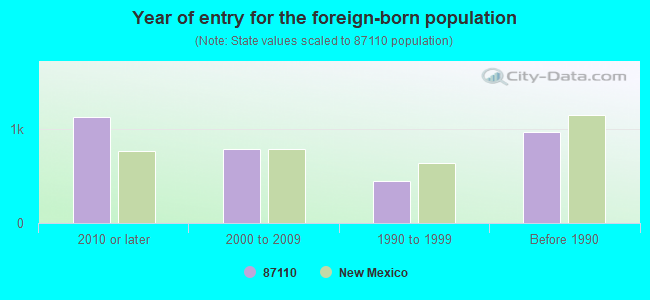
Foreign born population: 2,835 (7.0%) (54.2% of them are naturalized citizens)
Major facilities with environmental interests located in this zip code:
GRANBURY CLEANERS (4314 LOMAS NE in ALBUQUERQUE, NM)
AIR MINOR (AIRS/AFS) (Resource Conservation and Recovery Act (tracking hazardous waste)) Business SIC classification: GASOLINE SERVICE STATIONS; DRYCLEANING PLANTS, EXCEPT RUG CLEANING Organizations: DAVIS KENT (CONTACT/OPERATOR)
, GLENDA DAVIS (CONTACT/OWNER)
Alternative names: DAVIS CLEANERS
APS CLEVELAND MIDDLE SCHOOL (6910 NATALIE ST NE in ALBUQUERQUE, NM)
AIR MINOR (AIRS/AFS) (National Center for Education Statistics) - STATE ID-01011407 Business SIC classification: ELEMENTARY AND SECONDARY SCHOOLS Organizations: ALBUQUERQUE PUBLIC SCHOOLS (SCHOOL DISTRICT)
APS HODGIN ELEMENTARY SCHOOL (3801 MORNINGSIDE DRIVE NORTHEAST in ALBUQUERQUE, NM)
AIR MINOR (AIRS/AFS) (National Center for Education Statistics) - STATE ID-01011273 Business SIC classification: ELEMENTARY AND SECONDARY SCHOOLS Organizations: ALBUQUERQUE PUBLIC SCHOOLS (SCHOOL DISTRICT)
APS SANDIA HIGH SCHOOL (7801 CANDELARIA ROAD NORTHEAST in ALBUQUERQUE, NM)
AIR MINOR (AIRS/AFS) (National Center for Education Statistics) - STATE ID-01011550 Business SIC classification: ELEMENTARY AND SECONDARY SCHOOLS Organizations: ALBUQUERQUE PUBLIC SCHOOLS (SCHOOL DISTRICT)
ALBUQUERQUE PUBLIC SCHOOL DEL NORTE HIGH SCHOOL (5323 MONTGOMERY BOULEVARD NORTHEAST in ALBUQUERQUE, NM)
AIR MINOR (AIRS/AFS) (National Center for Education Statistics) - STATE ID-01011514 Business SIC classification: ELEMENTARY AND SECONDARY SCHOOLS Organizations: ALBUQUERQUE PUBLIC SCHOOLS (SCHOOL DISTRICT)
Alternative names: APS DEL NORTE HIGH SCHOOL
ALBUQUERQUE PUBLIC SCHOOL MARK TWAIN ELEMENTARY SCHOOL (6316 CONSTITUTION AVENUE NORTHEAST in ALBUQUERQUE, NM)
AIR MINOR (AIRS/AFS) (National Center for Education Statistics) - STATE ID-01011364 Business SIC classification: ELEMENTARY AND SECONDARY SCHOOLS Organizations: ALBUQUERQUE PUBLIC SCHOOLS (SCHOOL DISTRICT)
Alternative names: APS MARK TWAIN ELEMENTARY SCHOOL
DUKE CITY BUMPER SUPPLY INC (3229 CLAREMONT NE in ALBUQUERQUE, NM)
(Integrated Compliance Information System) - ICIS-06-2001-0902, FORMAL ENFORCEMENT ACTION COMPLIANCE ACTIVITY (Tracking inspections of insecticide, fungicide, and rodenticide, and toxic substances) Small Quantity Generators, between 100 kg and 1000 kg of hazardous waste/month (Resource Conservation and Recovery Act (tracking hazardous waste)) - notification Business SIC classification: ELECTROPLATING, PLATING, POLISHING, ANODIZING, AND COLORING Organizations: JOHN BARTH (CONTACT/OWNER)
Alternative names: DUKE CITY PLATING INC., DUKE CITY PLATING DUKE CITY BUMPER
GENES SERVICE CENTER (1401 CARLISLE BLVD NE in ALBUQUERQUE, NM)
AIR MINOR (AIRS/AFS) (Integrated Compliance Information System) - ICIS-06-1999-0450, FORMAL ENFORCEMENT ACTION Business SIC classification: GENERAL AUTOMOTIVE REPAIR SHOPS
JIMS FINE CAR SERVICE (5110 HEADINGLY NE in ALBUQUERQUE, NM)
AIR MINOR (AIRS/AFS) (Integrated Compliance Information System) - ICIS-06-1999-0449, FORMAL ENFORCEMENT ACTION Business SIC classification: AUTO AND HOME SUPPLY STORES; GENERAL AUTOMOTIVE REPAIR SHOPS
COMANCHE ELEMENTARY (3505 PENN NE in ALBUQUERQUE, NM)
(National Center for Education Statistics) - STATE ID-01011241 Organizations: ALBUQUERQUE PUBLIC SCHOOLS (SCHOOL DISTRICT)
GOVENOR BENT ELEMENTARY (5700 HENDRIX RD NE in ALBUQUERQUE, NM)
(National Center for Education Statistics) - STATE ID-01011230 Organizations: ALBUQUERQUE PUBLIC SCHOOLS (SCHOOL DISTRICT)
AMY BIEHL CHARTER HIGH (8300 PHOENIX, NE in ALBUQUERQUE, NM)
(National Center for Education Statistics) - STATE ID-01015026 Organizations: ALBUQUERQUE PUBLIC SCHOOLS (SCHOOL DISTRICT)
Housing units lacking complete plumbing facilities: 0.3% Housing units lacking complete kitchen facilities: 0.5%
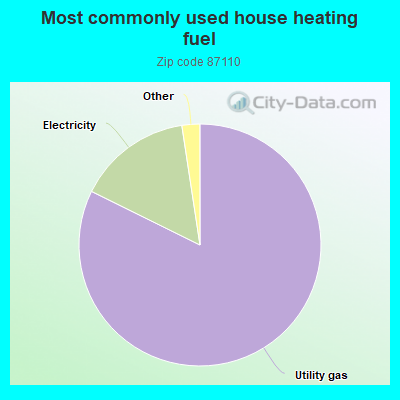
82.4%Utility gas
15.3%Electricity
0.9%Bottled, tank, or LP gas
0.7%No fuel used
0.6%Wood
Population in 1990: 42,652.
Place of birth for U.S.-born residents:
This state: 22,232
Northeast: 2,031
Midwest: 3,858
South: 4,025
West: 4,940
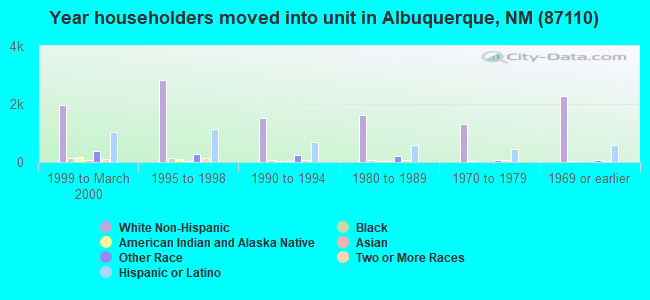
58% of the 87110 zip code residents lived in the same house 5 years ago. Out of people who lived in different houses, 67% lived in this county. Out of people who lived in different counties, 50% lived in New Mexico.
88% of the 87110 zip code residents lived in the same house 1 year ago. Out of people who lived in different houses, 70% moved from this county. Out of people who lived in different houses, 10% moved from different county within same state. Out of people who lived in different houses, 15% moved from different state. Out of people who lived in different houses, 0% moved from abroad.
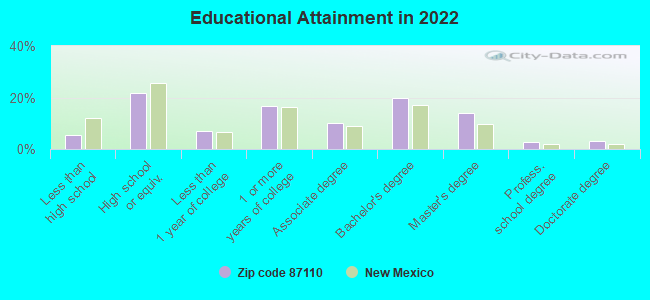
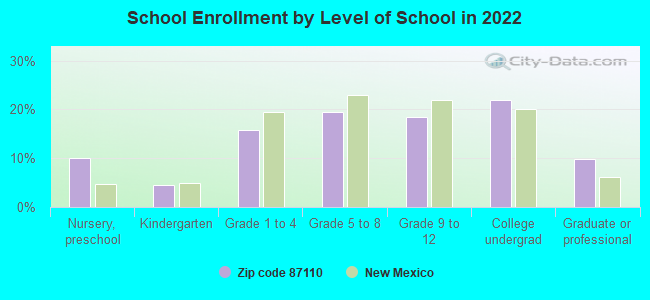
Private vs. public school enrollment:
Students in private schools in grades 1 to 8 (elementary and middle school): 852
Here:
26.1%
New Mexico:
10.2%
Students in private schools in grades 9 to 12 (high school): 143
Here:
8.6%
New Mexico:
10.0%
Students in private undergraduate colleges: 267
Here:
13.3%
New Mexico:
12.3%
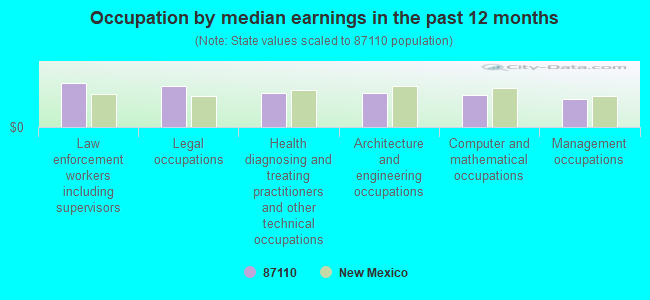
Occupation by median earnings in the past 12 months ($)
102,368Law enforcement workers including supervisors
94,513Legal occupations
79,278Health diagnosing and treating practitioners and other technical occupations
79,198Architecture and engineering occupations
74,324Computer and mathematical occupations
64,269Management occupations
Companies with biggest federal contracts located in this zip code (ALBUQUERQUE, NM):
BOEING LTS INC (6200 UPTOWN BLVD) : $164,091,017 in 595 contractsfrom 1999 to 2006
Contracts for Engineering and Technical Services, Defense Missile and Space Systems -- Advanced Development (R&D), Weapons -- Advanced Development (R&D), Defense Missile and Space Systems -- Engineering Development (R&D), and moreby Air Force Signed by year:2000: $12,143,655; 2001: $8,907,997; 2002: $17,866,585; 2003: $27,025,519; 2004: $26,078,437; 2005: $29,716,212; 2006: $41,366,100.
Biggest contracts:
$9,578,427 with Air Force for Engineering and Technical Services. Signed on 2006-03-02. Completion date: 2009-12-31.
$4,075,000 with Air Force for Defense Missile and Space Systems -- Advanced Development (R&D). Signed on 2004-01-16. Completion date: 2005-11-30.
$3,902,140, same as above.Signed on 2004-03-25. Completion date: 2005-11-30.
$2,940,000, same as above.Signed on 2005-01-04. Completion date: 2005-11-30.
TRW INC (6001 INDIAN SCHOOL ROAD, N) : $23,425,397 in 156 contractsfrom 2000 to 2003
Contracts for Weapons -- Management and Support (R&D), Aircraft, Fixed Wing, Facilities Operations Support Services, Other Professional Services by Air Force, Navy, Army Signed by year:2000: $911,779; 2001: $16,764,135; 2002: $3,952,831; 2003: $1,796,652; 2004: $0; 2005: $0; 2006: $0.
Biggest contracts:
$1,804,509 with Air Force for Weapons -- Management and Support (R&D). Signed on 2001-11-07. Completion date: 2005-07-09.
$1,804,509, same as above.Signed on 2001-09-30. Completion date: 2005-07-09.
$1,499,744 with Air Force for Aircraft, Fixed Wing. Taking place in GA. Signed on 2001-05-25. Completion date: 2001-04-04.
$1,487,973 with Air Force for Weapons -- Management and Support (R&D). Signed on 2001-01-03. Completion date: 2005-07-09.
PROFESSIONAL MANAGEMENT CONCEP (1923 SAN MATEO BLVD NE; small business) : $17,470,700 in 226 contractsfrom 2001 to 2006
Contracts for Educational Buildings, Construction of Structures and Facilities -- Miscellaneous Buildings, Construction of Structures and Facilities -- Other Non-Building Facilities, Maintenance, Repair or Alteration of Real Property -- Restoration of real property, and moreby Army, U.S. Army Corps of Engineers - civil program financing only, ENERGY, Department of, Air Force, and others Signed by year:2000: $0; 2001: $438,296; 2002: $1,662,579; 2003: $2,551,086; 2004: $2,746,274; 2005: $7,030,475; 2006: $3,041,990.
Biggest contracts:
$1,690,542 with Army for Educational Buildings. Signed on 2006-07-10. Completion date: 2007-01-16.
$865,300 with Army for Construction of Structures and Facilities -- Miscellaneous Buildings. Signed on 2005-09-30. Completion date: 2006-04-03.
$693,804 with U.S. Army Corps of Engineers - civil program financing only for Construction of Structures and Facilities -- Other Non-Building Facilities. Taking place in CO. Signed on 2005-07-25. Completion date: 2005-08-25.
$693,804 with Army for Construction of Structures and Facilities -- Other Non-Building Facilities. Taking place in CO. Signed on 2005-07-25. Completion date: 2005-08-25.
TRINITY CONSTRUCTION ENTERPRIS (6000 INDIAN SCHOOL RD NE; small business) : $16,345,494 in 114 contractsfrom 1999 to 2006
Contracts for Construction of Structures and Facilities -- Office Buildings, Construction of Structures and Facilities -- Other Administrative Facilities and Service Buildings, Maintenance, Repair or Alteration of Real Property -- Troop Housing Facilities, Maintenance, Repair or Alteration of Real Property -- Other Airfield Structures, and moreby U.S. Army Corps of Engineers - civil program financing only, Army, Air Force, Employment and Training Administration, and others Signed by year:2000: $4,282,364; 2001: $6,766,935; 2002: $3,747,264; 2003: $209,024; 2004: $2,338; 2005: $1,192,360; 2006: $129,209.
Biggest contracts:
$4,090,596 with U.S. Army Corps of Engineers - civil program financing only for Construction of Structures and Facilities -- Office Buildings. Taking place in TX. Signed on 2001-04-11. Completion date: 2002-05-24.
$2,596,084 with Army for Construction of Structures and Facilities -- Other Administrative Facilities and Service Buildings. Signed on 2000-05-10. Completion date: 2001-06-07.
$2,102,552 with U.S. Army Corps of Engineers - civil program financing only for Construction of Structures and Facilities -- Other Administrative Facilities and Service Buildings. Signed on 2005-07-19. Completion date: 2005-09-19.
$2,102,552 with Army for Construction of Structures and Facilities -- Other Administrative Facilities and Service Buildings. Signed on 2005-07-19. Completion date: 2005-09-19.
SBS TECHNOLOGIES INC (2400 LOUISIANA BLVD NE) : $14,185,973 in 216 contractsfrom 1999 to 2006
Contracts for Electrical and Electronic assemblies, Boards, Cards, and Associated Hardware, Miscellaneous Electrical and Electronic Components, ADP Central Processing Unit (CPU, Computer), Digital, ADP Support Equipment, and moreby Navy, NASA, Air Force, National Oceanic and Atmospheric Administration/Under Secretary for Oceans and Atmosphere, and others Signed by year:2000: $2,415,113; 2001: $1,060,948; 2002: $3,226,389; 2003: $1,263,383; 2004: $2,425,691; 2005: $3,070,780; 2006: $666,469.
Biggest contracts:
$2,158,736 with Navy for Electrical and Electronic assemblies, Boards, Cards, and Associated Hardware. Signed on 2002-09-24. Completion date: 2003-05-30.
$999,320, same as above.Signed on 2005-11-30. Completion date: 2006-02-22.
$972,190, same as above.Signed on 2005-02-25. Completion date: 2005-09-03.
$968,440 with Navy for Miscellaneous Electrical and Electronic Components. Signed on 2004-09-15. Completion date: 2004-11-25.
CORDOVA SUPPORT SERVICES INC (1927 SAN MATEO BLVD NE; small business) : $11,310,315 in 43 contractsfrom 2000 to 2006
Contracts for Other Professional Services, Intelligence Studies, Restoration, Information Retrieval, and moreby Virginia Contracting Activity, Defense Intelligence Agency, Department of Defense, SOCIAL SECURITY ADMINISTRATION, and others Signed by year:2000: $391,625; 2001: $387,150; 2002: $342,780; 2003: $1,041,788; 2004: $4,179,872; 2005: $2,225,240; 2006: $2,741,860.
Biggest contracts:
$2,300,000 with Virginia Contracting Activity for Other Professional Services. Taking place in DC. Signed on 2004-02-02. Completion date: 2004-09-09.
$1,701,560 with Defense Intelligence Agency for Intelligence Studies. Taking place in DC. Signed on 2006-02-02. Completion date: 2007-09-09.
$1,040,300 with Defense Intelligence Agency for Restoration. Signed on 2006-04-04. Completion date: 2007-04-04.
$988,000 with Defense Intelligence Agency for Other Professional Services. Taking place in DC. Signed on 2005-02-02. Completion date: 2004-09-09.
MANAGEMENT SCIENCES INC (6022 CONSTITUTION AVE NE; small business) : $9,847,758 in 48 contractsfrom 1999 to 2006
Contracts for Defense Electronics and Communication Equipment -- Engineering Development (R&D), Defense Electronics and Communication Equipment -- Applied Research and Exploratory Development (R&D), Construction -- Applied Research and Exploratory Development (R&D), Defense Missile and Space Systems -- Basic Research (R&D), and moreby Navy, Missile Defense Agency, Air Force, Research and Innovative Technology Administration, and others Signed by year:2000: $2,282,944; 2001: $1,848,523; 2002: $1,828,816; 2003: $1,758,677; 2004: $540,484; 2005: $923,407; 2006: $474,998.
Biggest contracts:
$780,253 with Navy for Defense Electronics and Communication Equipment -- Engineering Development (R&D). Signed on 2000-08-24. Completion date: 2000-11-23.
$749,921 with Navy for Defense Electronics and Communication Equipment -- Applied Research and Exploratory Development (R&D). Signed on 2002-12-23. Completion date: 2003-12-22.
$749,159 with Navy for Construction -- Applied Research and Exploratory Development (R&D). Signed on 2001-01-29. Completion date: 2003-01-29.
$748,510 with Missile Defense Agency for Defense Missile and Space Systems -- Basic Research (R&D). Signed on 2005-07-19. Completion date: 2007-06-30.
ASCG INCORPORATED OF NEW MEXIC (6501 AMERICAS PARKWAY NE S; small business) : $9,644,628 in 235 contractsfrom 1999 to 2006
Contracts for Architect - Engineer Services (including landscaping, interior layout, and designing), Administrative and Service Buildings, Educational Buildings, Highways, Roads, Streets, Bridges, and Railways, and moreby Indian Affairs (Assistant Secretary), Public Buildings Service, Air Force, Federal Law Enforcement Training Center (disused code, now 7015), and others Signed by year:2000: $1,218,000; 2001: $2,056,000; 2002: $1,949,440; 2003: $2,260,734; 2004: $1,018; 2005: $1,521,949; 2006: $569,487.
Biggest contracts:
$849,000 with Indian Affairs (Assistant Secretary) for Architect - Engineer Services (including landscaping, interior layout, and designing). Signed on 2001-06-15. Completion date: 2001-09-15.
$607,000 with Public Buildings Service for Administrative and Service Buildings. Signed on 2002-03-15. Completion date: 2001-06-15.
$470,762 with Indian Affairs (Assistant Secretary) for Educational Buildings. Signed on 2005-11-09. Completion date: 2007-05-31.
$442,000 with Public Buildings Service for Administrative and Service Buildings. Signed on 2002-08-15. Completion date: 2002-09-15.
TECHNOLOGY MANAGEMENT COMPANY, (2500 LOUISIANA BLVD #300; small business) : $8,499,427 in 62 contractsfrom 1999 to 2005
Contracts for Other Environmental Services, Studies, and Analytical Support, Other Administrative Support Services, Chemical Weapons and Equipment by Navy, Tennessee Valley Authority, Department of Defense Signed by year:2000: $2,503,443; 2001: $2,263,417; 2002: $1,526,037; 2003: $1,064,920; 2004: $1,291,289; 2005: -$197,142; 2006: $0.
Biggest contracts:
$597,444 with Navy for Other Environmental Services, Studies, and Analytical Support. Taking place in CA. Signed on 2000-09-18. Completion date: 2001-01-31.
$595,195, same as above.Signed on 2001-04-02. Completion date: 2001-03-31.
$550,000, same as above.Signed on 2003-05-01. Completion date: 2003-06-30.
$426,705 with Navy for Other Environmental Services, Studies, and Analytical Support. Taking place in DC. Signed on 2004-08-05. Completion date: 2002-09-30.
AGILOPTICS INC (1717 LOUISIANA BLVD NE STE; small business) : $5,217,589 in 47 contractsfrom 2001 to 2006
Contracts for Weapons -- Basic Research (R&D), Weapons -- Applied Research and Exploratory Development (R&D), Other Defense -- Basic Research (R&D), Defense Missile and Space Systems -- Operational Systems Development (R&D), and moreby Air Force, Department of Defense Signed by year:2000: $0; 2001: $179,968; 2002: $743,862; 2003: $769,714; 2004: $1,685,408; 2005: $1,022,058; 2006: $816,579.
Biggest contracts:
$749,594 with Air Force for Weapons -- Basic Research (R&D). Signed on 2004-05-26. Completion date: 2006-07-31.
$560,511 with Air Force for Weapons -- Applied Research and Exploratory Development (R&D). Signed on 2004-03-17. Completion date: 2005-06-15.
$543,891 with Department of Defense for Other Defense -- Basic Research (R&D). Signed on 2002-07-24. Completion date: 2003-07-24.
$526,575 with Air Force for Weapons -- Basic Research (R&D). Signed on 2005-07-01. Completion date: 2006-07-31.
Top industries in this zip code by the number of employees in 2005:
Administrative and Support and Waste Management and Remediation Services: Temporary Help Services (250-499 employees: 5 establishments, 100-249 employees: 6 establishments, 50-99 employees: 3 establishments, 20-49 employees: 3 establishments, 10-19 employees: 4 establishments, 5-9 employees: 1 establishment, 1-4 employees: 8 establishments)
Administrative and Support and Waste Management and Remediation Services: Professional Employer Organizations (500-999: 1, 50-99: 1)
Professional, Scientific, and Technical Services: Research and Development in the Physical, Engineering, and Life Sciences (250-499: 1, 100-249: 1, 50-99: 2, 20-49: 2, 10-19: 3, 1-4: 3)
Professional, Scientific, and Technical Services: Offices of Lawyers (50-99: 2, 20-49: 5, 10-19: 15, 5-9: 12, 1-4: 71)
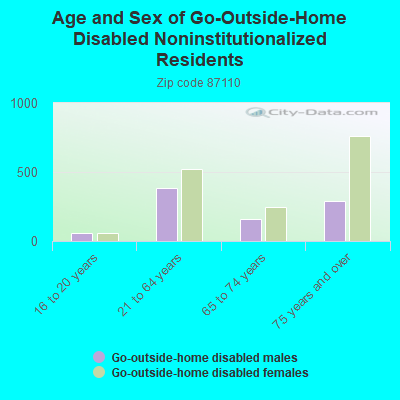
People in group quarters in 2010:
165 people in nursing facilities/skilled-nursing facilities
35 people in group homes intended for adults
26 people in mental (psychiatric) hospitals and psychiatric units in other hospitals
26 people in in-patient hospice facilities
16 people in workers' group living quarters and job corps centers
3 people in other noninstitutional facilities
People in group quarters in 2000:
163 people in nursing homes
43 people in other noninstitutional group quarters
20 people in homes for the mentally retarded
14 people in homes for the mentally ill
3 people in religious group quarters
Fatal accident statistics in 2014:
Fatal accident count: 5
Vehicles involved in fatal accidents: 7
Fatal accidents caused by drunken drivers: 1
Fatalities: 5
Persons involved in fatal accidents: 7
Pedestrians involved in fatal accidents: 3
Fatal accident statistics in 2013:
Fatal accident count: 2
Vehicles involved in fatal accidents: 3
Fatal accidents caused by drunken drivers: 0
Fatalities: 2
Persons involved in fatal accidents: 4
Pedestrians involved in fatal accidents: 1
Home Mortgage Disclosure Act Aggregated Statistics For Year 2009 (Based on 11 full and 10 partial tracts)
A) FHA, FSA/RHS & VA Home Purchase Loans
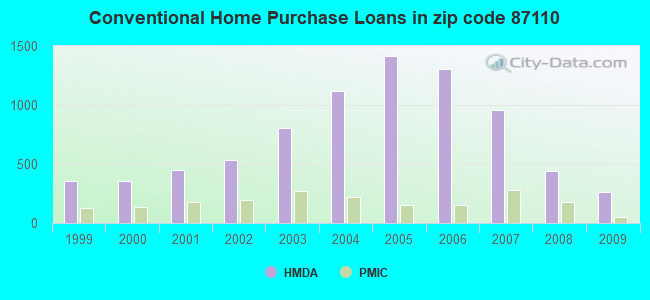
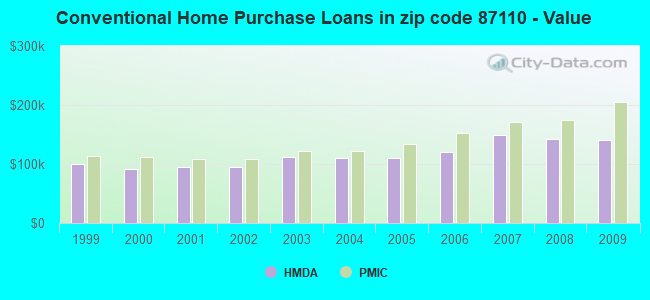
B) Conventional Home Purchase Loans
C) Refinancings
D) Home Improvement Loans
E) Loans on Dwellings For 5+ Families
F) Non-occupant Loans on < 5 Family Dwellings (A B C & D)
G) Loans On Manufactured Home Dwelling (A B C & D)
Number
Average Value
Number
Average Value
Number
Average Value
Number
Average Value
Number
Average Value
Number
Average Value
Number
Average Value
LOANS ORIGINATED
277
$163,604
265
$141,188
1,254
$152,772
121
$74,023
0
$0
120
$129,160
0
$0
APPLICATIONS APPROVED, NOT ACCEPTED
18
$158,547
15
$189,640
138
$174,486
9
$41,586
2
$801,030
15
$139,677
0
$0
APPLICATIONS DENIED
37
$162,768
37
$134,072
472
$162,657
81
$39,838
0
$0
61
$121,091
1
$22,000
APPLICATIONS WITHDRAWN
33
$160,438
22
$178,327
291
$161,632
14
$120,050
0
$0
24
$122,526
0
$0
FILES CLOSED FOR INCOMPLETENESS
0
$0
3
$156,917
57
$137,089
4
$79,275
0
$0
12
$129,799
0
$0
Aggregated Statistics For Year 2008 (Based on 11 full and 10 partial tracts)
A) FHA, FSA/RHS & VA Home Purchase Loans
B) Conventional Home Purchase Loans
C) Refinancings
D) Home Improvement Loans
E) Loans on Dwellings For 5+ Families
F) Non-occupant Loans on < 5 Family Dwellings (A B C & D)
G) Loans On Manufactured Home Dwelling (A B C & D)
Number
Average Value
Number
Average Value
Number
Average Value
Number
Average Value
Number
Average Value
Number
Average Value
Number
Average Value
LOANS ORIGINATED
211
$167,189
442
$143,111
949
$148,660
142
$71,012
4
$9,275,715
176
$135,019
3
$94,327
APPLICATIONS APPROVED, NOT ACCEPTED
28
$165,150
34
$155,749
105
$150,766
11
$44,981
0
$0
16
$160,527
0
$0
APPLICATIONS DENIED
31
$170,512
85
$130,524
591
$174,712
109
$49,009
2
$925,000
45
$137,953
10
$33,779
APPLICATIONS WITHDRAWN
14
$151,956
66
$154,419
266
$162,386
22
$117,231
1
$900,000
20
$142,500
2
$104,990
FILES CLOSED FOR INCOMPLETENESS
5
$169,172
17
$124,581
46
$153,895
8
$86,184
0
$0
7
$104,084
2
$162,985
Aggregated Statistics For Year 2007 (Based on 11 full and 10 partial tracts)
A) FHA, FSA/RHS & VA Home Purchase Loans
B) Conventional Home Purchase Loans
C) Refinancings
D) Home Improvement Loans
E) Loans on Dwellings For 5+ Families
F) Non-occupant Loans on < 5 Family Dwellings (A B C & D)
G) Loans On Manufactured Home Dwelling (A B C & D)
Number
Average Value
Number
Average Value
Number
Average Value
Number
Average Value
Number
Average Value
Number
Average Value
Number
Average Value
LOANS ORIGINATED
87
$158,617
961
$149,080
1,258
$142,999
301
$62,937
3
$5,545,097
319
$135,794
8
$88,081
APPLICATIONS APPROVED, NOT ACCEPTED
6
$170,168
138
$162,596
229
$146,581
24
$39,693
0
$0
56
$146,561
4
$78,690
APPLICATIONS DENIED
16
$138,012
202
$147,995
741
$157,573
149
$73,290
1
$1,307,000
89
$143,109
8
$63,026
APPLICATIONS WITHDRAWN
11
$149,765
131
$140,219
463
$147,820
48
$84,175
1
$6,500,000
51
$113,224
2
$53,500
FILES CLOSED FOR INCOMPLETENESS
4
$129,518
47
$146,115
128
$160,378
8
$86,280
0
$0
12
$146,052
0
$0
Aggregated Statistics For Year 2006 (Based on 11 full and 10 partial tracts)
A) FHA, FSA/RHS & VA Home Purchase Loans
B) Conventional Home Purchase Loans
C) Refinancings
D) Home Improvement Loans
E) Loans on Dwellings For 5+ Families
F) Non-occupant Loans on < 5 Family Dwellings (A B C & D)
G) Loans On Manufactured Home Dwelling (A B C & D)
Number
Average Value
Number
Average Value
Number
Average Value
Number
Average Value
Number
Average Value
Number
Average Value
Number
Average Value
LOANS ORIGINATED
138
$144,415
1,304
$121,080
1,327
$129,260
270
$50,069
6
$2,889,197
446
$116,706
4
$34,025
APPLICATIONS APPROVED, NOT ACCEPTED
7
$132,209
199
$103,956
170
$132,603
17
$53,888
0
$0
54
$92,217
9
$87,229
APPLICATIONS DENIED
8
$114,000
246
$114,130
842
$131,302
179
$60,940
0
$0
73
$113,397
19
$59,418
APPLICATIONS WITHDRAWN
14
$116,548
148
$124,108
605
$132,475
51
$95,027
0
$0
61
$103,626
0
$0
FILES CLOSED FOR INCOMPLETENESS
2
$114,500
41
$107,366
142
$152,382
13
$86,304
0
$0
19
$150,325
0
$0
Aggregated Statistics For Year 2005 (Based on 11 full and 10 partial tracts)
A) FHA, FSA/RHS & VA Home Purchase Loans
B) Conventional Home Purchase Loans
C) Refinancings
D) Home Improvement Loans
E) Loans on Dwellings For 5+ Families
F) Non-occupant Loans on < 5 Family Dwellings (A B C & D)
G) Loans On Manufactured Home Dwelling (A B C & D)
Number
Average Value
Number
Average Value
Number
Average Value
Number
Average Value
Number
Average Value
Number
Average Value
Number
Average Value
LOANS ORIGINATED
187
$136,085
1,417
$110,271
1,421
$116,611
142
$60,092
15
$356,383
462
$109,186
0
$0
APPLICATIONS APPROVED, NOT ACCEPTED
13
$114,681
164
$104,281
167
$116,496
26
$44,963
0
$0
40
$94,738
8
$33,402
APPLICATIONS DENIED
19
$139,648
213
$101,756
781
$119,346
157
$69,132
1
$262,000
89
$101,097
7
$28,863
APPLICATIONS WITHDRAWN
5
$170,654
234
$109,056
425
$127,110
56
$133,955
0
$0
62
$105,793
0
$0
FILES CLOSED FOR INCOMPLETENESS
0
$0
46
$126,679
78
$139,207
11
$75,785
2
$1,555,455
9
$159,674
0
$0
Aggregated Statistics For Year 2004 (Based on 11 full and 10 partial tracts)
A) FHA, FSA/RHS & VA Home Purchase Loans
B) Conventional Home Purchase Loans
C) Refinancings
D) Home Improvement Loans
E) Loans on Dwellings For 5+ Families
F) Non-occupant Loans on < 5 Family Dwellings (A B C & D)
G) Loans On Manufactured Home Dwelling (A B C & D)
Number
Average Value
Number
Average Value
Number
Average Value
Number
Average Value
Number
Average Value
Number
Average Value
Number
Average Value
LOANS ORIGINATED
251
$125,178
1,115
$110,592
1,443
$107,338
161
$41,894
5
$736,168
361
$99,026
9
$59,949
APPLICATIONS APPROVED, NOT ACCEPTED
7
$117,833
102
$114,048
191
$104,934
17
$21,253
0
$0
34
$102,549
0
$0
APPLICATIONS DENIED
32
$125,753
206
$96,271
633
$109,016
117
$35,074
0
$0
71
$106,479
19
$40,172
APPLICATIONS WITHDRAWN
33
$105,450
129
$108,534
511
$112,431
27
$68,731
0
$0
73
$109,794
0
$0
FILES CLOSED FOR INCOMPLETENESS
0
$0
21
$124,663
76
$105,124
9
$36,893
0
$0
12
$81,282
0
$0
Aggregated Statistics For Year 2003 (Based on 11 full and 10 partial tracts)
A) FHA, FSA/RHS & VA Home Purchase Loans
B) Conventional Home Purchase Loans
C) Refinancings
D) Home Improvement Loans
E) Loans on Dwellings For 5+ Families
F) Non-occupant Loans on < 5 Family Dwellings (A B C & D)
Number
Average Value
Number
Average Value
Number
Average Value
Number
Average Value
Number
Average Value
Number
Average Value
LOANS ORIGINATED
330
$116,257
804
$111,774
3,217
$104,852
102
$27,268
4
$2,607,978
453
$90,017
APPLICATIONS APPROVED, NOT ACCEPTED
21
$112,819
105
$114,613
311
$96,383
27
$31,438
0
$0
51
$82,413
APPLICATIONS DENIED
30
$117,084
112
$93,412
878
$105,726
75
$27,610
1
$355,000
53
$80,325
APPLICATIONS WITHDRAWN
25
$129,408
86
$103,777
633
$114,863
20
$23,113
2
$119,500
64
$91,554
FILES CLOSED FOR INCOMPLETENESS
6
$102,465
19
$125,872
121
$107,656
5
$44,880
0
$0
14
$103,661
Aggregated Statistics For Year 2002 (Based on 8 full and 10 partial tracts)
A) FHA, FSA/RHS & VA Home Purchase Loans
B) Conventional Home Purchase Loans
C) Refinancings
D) Home Improvement Loans
E) Loans on Dwellings For 5+ Families
F) Non-occupant Loans on < 5 Family Dwellings (A B C & D)
Number
Average Value
Number
Average Value
Number
Average Value
Number
Average Value
Number
Average Value
Number
Average Value
LOANS ORIGINATED
233
$108,583
531
$94,955
1,425
$95,107
76
$26,850
0
$0
217
$86,638
APPLICATIONS APPROVED, NOT ACCEPTED
16
$104,881
89
$86,085
189
$91,966
12
$34,608
1
$8,393,330
15
$75,705
APPLICATIONS DENIED
24
$107,222
179
$53,859
480
$93,355
61
$16,245
0
$0
32
$63,488
APPLICATIONS WITHDRAWN
28
$102,399
41
$107,232
383
$110,143
12
$29,483
0
$0
29
$131,048
FILES CLOSED FOR INCOMPLETENESS
6
$114,590
24
$85,301
81
$105,420
3
$15,930
0
$0
3
$65,927
Aggregated Statistics For Year 2001 (Based on 8 full and 10 partial tracts)
A) FHA, FSA/RHS & VA Home Purchase Loans
B) Conventional Home Purchase Loans
C) Refinancings
D) Home Improvement Loans
E) Loans on Dwellings For 5+ Families
F) Non-occupant Loans on < 5 Family Dwellings (A B C & D)
Number
Average Value
Number
Average Value
Number
Average Value
Number
Average Value
Number
Average Value
Number
Average Value
LOANS ORIGINATED
294
$104,647
452
$94,758
1,128
$92,184
103
$24,877
2
$94,270
186
$82,598
APPLICATIONS APPROVED, NOT ACCEPTED
14
$93,261
64
$74,936
113
$73,952
18
$46,626
0
$0
16
$72,207
APPLICATIONS DENIED
18
$109,665
88
$77,652
448
$84,653
59
$16,748
0
$0
46
$71,614
APPLICATIONS WITHDRAWN
8
$90,634
41
$104,656
272
$93,810
11
$29,187
0
$0
23
$90,463
FILES CLOSED FOR INCOMPLETENESS
2
$121,370
4
$101,230
76
$83,248
2
$14,005
0
$0
1
$114,000
Aggregated Statistics For Year 2000 (Based on 8 full and 10 partial tracts)
A) FHA, FSA/RHS & VA Home Purchase Loans
B) Conventional Home Purchase Loans
C) Refinancings
D) Home Improvement Loans
E) Loans on Dwellings For 5+ Families
F) Non-occupant Loans on < 5 Family Dwellings (A B C & D)
Number
Average Value
Number
Average Value
Number
Average Value
Number
Average Value
Number
Average Value
Number
Average Value
LOANS ORIGINATED
171
$104,821
356
$91,348
393
$77,225
122
$15,450
2
$9,849,480
67
$65,333
APPLICATIONS APPROVED, NOT ACCEPTED
5
$59,208
52
$88,648
117
$87,250
35
$13,873
0
$0
10
$78,891
APPLICATIONS DENIED
13
$91,123
115
$63,966
344
$73,254
84
$26,073
0
$0
12
$61,891
APPLICATIONS WITHDRAWN
14
$106,643
57
$90,639
157
$86,668
12
$40,766
0
$0
10
$69,041
FILES CLOSED FOR INCOMPLETENESS
1
$83,000
18
$89,833
40
$86,739
0
$0
0
$0
4
$80,268
Aggregated Statistics For Year 1999 (Based on 7 full and 5 partial tracts)
A) FHA, FSA/RHS & VA Home Purchase Loans
B) Conventional Home Purchase Loans
C) Refinancings
D) Home Improvement Loans
F) Non-occupant Loans on < 5 Family Dwellings (A B C & D)
2003 - 2014 National Fire Incident Reporting System (NFIRS) incidents
Based on the data from the years 2003 - 2014 the average number of fires per year is 91. The highest number of fire incidents - 191 took place in 2004, and the least - 4 in 2014. The data has a decreasing trend.
When looking into fire subcategories, the most incidents belonged to: Structure Fires (42.9%), and Outside Fires (31.5%).
Fire incident types reported to NFIRS in Zip Code 87110


 Nearest zip codes: 87108, 87109, 87116, 87112, 87106, 87107.


 Based on the data from the years 2003 - 2014 the average number of fires per year is 91. The highest number of fire incidents - 191 took place in 2004, and the least - 4 in 2014. The data has a decreasing trend.
 When looking into fire subcategories, the most incidents belonged to: Structure Fires (42.9%), and Outside Fires (31.5%).