Estimated zip code population in 2022: 42,649 Zip code population in 2010: 43,584 Zip code population in 2000: 43,702
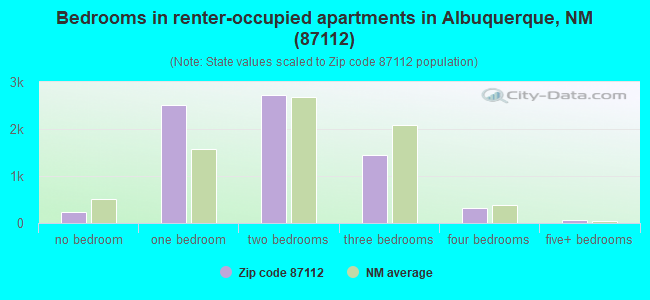
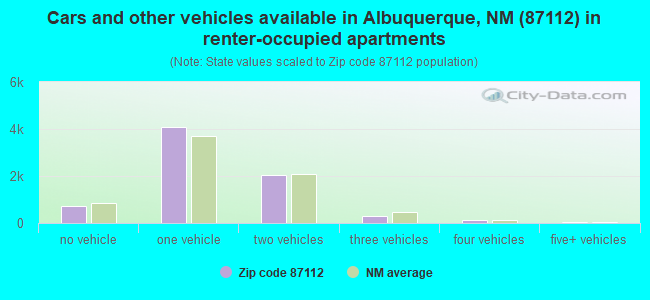
Houses and condos: 20,274 Renter-occupied apartments: 7,212
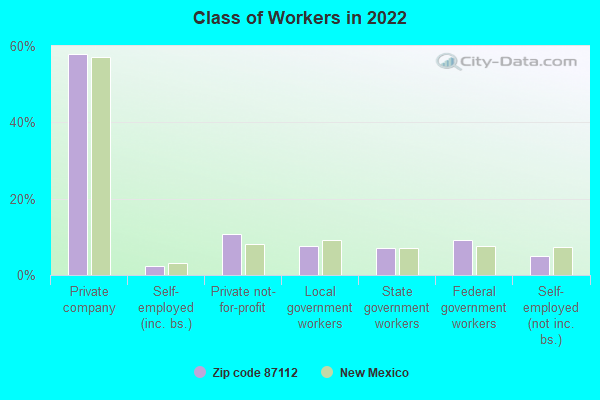
% of renters here:
37%
State:
29%
March 2022 cost of living index in zip code 87112: 93.2 (less than average, U.S. average is 100)
Land area: 8.1 sq. mi. Water area: 0.1 sq. mi.
Population density: 5,283 people per square mile
(average).
OSM Map
General Map
Google Map
MSN Map
OSM Map
General Map
Google Map
MSN Map
OSM Map
General Map
Google Map
MSN Map
OSM Map
General Map
Google Map
MSN Map
Please wait while loading the map...
Real estate property taxes paid for housing units in 2022:
This zip code:
1.0% ($2,539)
New Mexico:
0.7% ($1,638)
Median real estate property taxes paid for housing units with mortgages in 2022: $2,596 (1.0%) Median real estate property taxes paid for housing units with no mortgage in 2022: $2,389 (1.0%)
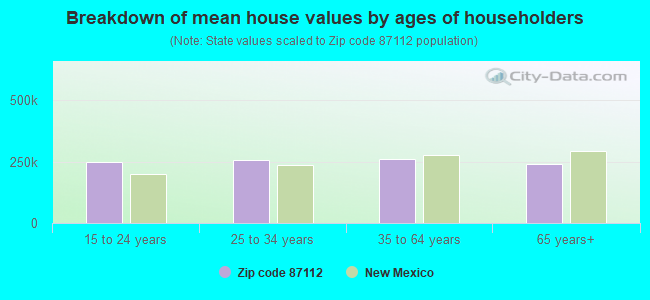
Estimated median house/condo value in 2022: $260,882
87112:
$260,882
New Mexico:
$243,100
According to our research of New Mexico and other state lists, there were 43 registered sex offenders living in 87112 zip code as of April 27, 2024. The ratio of all residents to sex offenders in zip code 87112 is 1,012 to 1. The ratio of registered sex offenders to all residents in this zip code is lower than the state average.
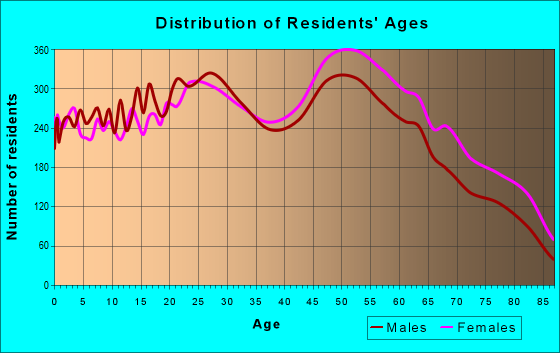
Median resident age:
This zip code:
41.1 years
New Mexico median age:
39.4 years
Average household size:
This zip code:
2.1 people
New Mexico:
2.4 people
Averages for the 2020 tax year for zip code 87112, filed in 2021:
Average Adjusted Gross Income (AGI) in 2020: $54,999 (Individual Income Tax Returns)
Here:
$54,999
State:
$59,146
Salary/wage: $48,135 (reported on 78.5% of returns)
Here:
$48,135
State:
$48,327
(% of AGI for various income ranges: 1083.4% for AGIs below $25k, 3436.5% for AGIs $25k-50k, 6355.3% for AGIs $50k-75k, 9106.1% for AGIs $75k-100k, 16629.1% for AGIs $100k-200k, 48091.5% for AGIs over 200k)
Taxable interest for individuals: $1,200 (reported on 32.8% of returns)
This zip code:
$1,200
New Mexico:
$1,616
(% of AGI for various income ranges: 16.2% for AGIs below $25k, 21.8% for AGIs $25k-50k, 47.6% for AGIs $50k-75k, 92.5% for AGIs $75k-100k, 172.5% for AGIs $100k-200k, 952.5% for AGIs over 200k)
Ordinary dividends: $4,465 (reported on 16.8% of returns)
Here:
$4,465
State:
$7,816
(% of AGI for various income ranges: 23.6% for AGIs below $25k, 27.9% for AGIs $25k-50k, 77.0% for AGIs $50k-75k, 131.0% for AGIs $75k-100k, 373.8% for AGIs $100k-200k, 2489.5% for AGIs over 200k)
Net capital gain/loss in AGI: +$10,879 (reported on 14.5% of returns)
Here:
+$10,879
State:
+$19,595
(% of AGI for various income ranges: 6.4% for AGIs below $25k, 18.1% for AGIs $25k-50k, 65.8% for AGIs $50k-75k, 148.2% for AGIs $75k-100k, 637.5% for AGIs $100k-200k, 10334.0% for AGIs over 200k)
Profit/loss from business: +$10,012 (reported on 11.8% of returns)
Here:
+$10,012
State:
+$11,430
(% of AGI for various income ranges: 78.4% for AGIs below $25k, 90.5% for AGIs $25k-50k, 156.8% for AGIs $50k-75k, 175.5% for AGIs $75k-100k, 455.1% for AGIs $100k-200k, 2372.0% for AGIs over 200k)
Taxable individual retirement arrangement distribution: $17,658 (reported on 8.9% of returns)
87112:
$17,658
New Mexico:
$20,970
(% of AGI for various income ranges: 56.3% for AGIs below $25k, 73.3% for AGIs $25k-50k, 192.3% for AGIs $50k-75k, 306.5% for AGIs $75k-100k, 813.2% for AGIs $100k-200k, 3819.0% for AGIs over 200k)
Self-employed (Keogh) retirement plans: $12,900 (reported on 0.3% of returns)
87112:
$12,900
New Mexico:
$20,997
(% of AGI for various income ranges: 2.2% for AGIs below $25k, 47.4% for AGIs $100k-200k)
Total itemized deductions: $26,960 (reported on 5.8% of returns)
Here:
$26,960
State:
$33,187
(% of AGI for various income ranges: 30.5% for AGIs below $25k, 67.4% for AGIs $25k-50k, 191.3% for AGIs $50k-75k, 382.7% for AGIs $75k-100k, 876.0% for AGIs $100k-200k, 3626.0% for AGIs over 200k)
Charity contributions: $8,912 (reported on 4.3% of returns)
Here:
$8,912
State:
$11,850
(% of AGI for various income ranges: 2.6% for AGIs below $25k, 8.6% for AGIs $25k-50k, 31.0% for AGIs $50k-75k, 72.3% for AGIs $75k-100k, 261.0% for AGIs $100k-200k, 1274.0% for AGIs over 200k)
Taxes paid: $6,805 (reported on 5.7% of returns)
87112:
$6,805
State:
$7,150
(% of AGI for various income ranges: 4.0% for AGIs below $25k, 11.6% for AGIs $25k-50k, 46.4% for AGIs $50k-75k, 111.0% for AGIs $75k-100k, 262.8% for AGIs $100k-200k, 750.0% for AGIs over 200k)
Earned income credit: $1,932 (reported on 16.0% of returns)
Here:
$1,932
State:
$2,323
(% of AGI for various income ranges: 72.7% for AGIs below $25k, 57.4% for AGIs $25k-50k, 1.1% for AGIs $50k-75k)
Percentage of individuals using paid preparers for their 2020 taxes: 91.8%
Here:
92%
State:
92%
(% for various income ranges: 91.4% for AGIs below $25k, 93.0% for AGIs $25k-50k, 91.5% for AGIs $50k-75k, 91.9% for AGIs $75k-100k, 91.2% for AGIs $100k-200k, 89.3% for AGIs over 200k)
Averages for the 2012 tax year for zip code 87112, filed in 2013:
Average Adjusted Gross Income (AGI) in 2012: $47,302 (Individual Income Tax Returns)
Here:
$47,302
State:
$50,343
Salary/wage: $40,148 (reported on 80.8% of returns)
Here:
$40,148
State:
$41,171
(% of AGI for various income ranges: 73.6% for AGIs below $25k, 77.2% for AGIs $25k-50k, 72.2% for AGIs $50k-75k, 70.2% for AGIs $75k-100k, 67.9% for AGIs $100k-200k, 46.1% for AGIs over 200k)
Taxable interest for individuals: $1,385 (reported on 33.5% of returns)
This zip code:
$1,385
New Mexico:
$1,677
(% of AGI for various income ranges: 1.3% for AGIs below $25k, 0.8% for AGIs $25k-50k, 1.0% for AGIs $50k-75k, 0.8% for AGIs $75k-100k, 0.9% for AGIs $100k-200k, 1.4% for AGIs over 200k)
Ordinary dividends: $3,667 (reported on 18.4% of returns)
Here:
$3,667
State:
$6,939
(% of AGI for various income ranges: 1.3% for AGIs below $25k, 0.9% for AGIs $25k-50k, 1.1% for AGIs $50k-75k, 1.3% for AGIs $75k-100k, 1.6% for AGIs $100k-200k, 2.6% for AGIs over 200k)
Net capital gain/loss in AGI: +$5,483 (reported on 13.9% of returns)
Here:
+$5,483
State:
+$14,311
(% of AGI for various income ranges: 0.3% for AGIs $25k-50k, 0.5% for AGIs $50k-75k, 0.7% for AGIs $75k-100k, 1.4% for AGIs $100k-200k, 8.1% for AGIs over 200k)
Profit/loss from business: +$9,663 (reported on 12.4% of returns)
Here:
+$9,663
State:
+$11,059
(% of AGI for various income ranges: 5.6% for AGIs below $25k, 2.3% for AGIs $25k-50k, 1.6% for AGIs $50k-75k, 2.0% for AGIs $75k-100k, 1.9% for AGIs $100k-200k, 3.3% for AGIs over 200k)
Taxable individual retirement arrangement distribution: $12,324 (reported on 11.3% of returns)
87112:
$12,324
New Mexico:
$15,706
(% of AGI for various income ranges: 3.2% for AGIs below $25k, 2.0% for AGIs $25k-50k, 2.4% for AGIs $50k-75k, 3.1% for AGIs $75k-100k, 3.7% for AGIs $100k-200k, 3.2% for AGIs over 200k)
Self-employment retirement plans: $10,689 (reported on 0.4% of returns)
87112:
$10,689
New Mexico:
$18,209
(% of AGI for various income ranges: 0.1% for AGIs $50k-75k, 0.1% for AGIs $100k-200k, 0.4% for AGIs over 200k)
Total itemized deductions: $18,598 (21% of AGI, reported on 29.0% of returns)
Here:
$18,598
State:
$21,709
Here:
21.1% of AGI
State:
19.8% of AGI
(% of AGI for various income ranges: 8.2% for AGIs below $25k, 9.4% for AGIs $25k-50k, 11.8% for AGIs $50k-75k, 12.1% for AGIs $75k-100k, 13.0% for AGIs $100k-200k, 12.8% for AGIs over 200k)
Charity contributions: $3,280 (reported on 22.8% of returns)
Here:
$3,280
State:
$4,195
(% of AGI for various income ranges: 0.6% for AGIs below $25k, 0.8% for AGIs $25k-50k, 1.5% for AGIs $50k-75k, 1.7% for AGIs $75k-100k, 2.5% for AGIs $100k-200k, 2.0% for AGIs over 200k)
Taxes paid: $5,352 (reported on 28.9% of returns)
87112:
$5,352
State:
$6,176
(% of AGI for various income ranges: 1.4% for AGIs below $25k, 2.0% for AGIs $25k-50k, 3.0% for AGIs $50k-75k, 3.6% for AGIs $75k-100k, 4.6% for AGIs $100k-200k, 4.3% for AGIs over 200k)
Earned income credit: $2,002 (reported on 19.5% of returns)
Here:
$2,002
State:
$2,311
(% of AGI for various income ranges: 5.7% for AGIs below $25k, 1.0% for AGIs $25k-50k)
Percentage of individuals using paid preparers for their 2012 taxes: 39.6%
Here:
40%
State:
50%
(% for various income ranges: 37.1% for AGIs below $25k, 38.4% for AGIs $25k-50k, 43.4% for AGIs $50k-75k, 42.2% for AGIs $75k-100k, 42.6% for AGIs $100k-200k, 60.0% for AGIs over 200k)
Averages for the 2004 tax year for zip code 87112, filed in 2005:
Average Adjusted Gross Income (AGI) in 2004: $41,845 (Individual Income Tax Returns)
Here:
$41,845
State:
$39,572
Salary/wage: $36,355 (reported on 82.6% of returns)
Here:
$36,355
State:
$34,237
(% of AGI for various income ranges: 123.4% for AGIs below $10k, 76.3% for AGIs $10k-25k, 78.6% for AGIs $25k-50k, 74.2% for AGIs $50k-75k, 75.8% for AGIs $75k-100k, 59.2% for AGIs over 100k)
Taxable interest for individuals: $1,638 (reported on 43.2% of returns)
This zip code:
$1,638
New Mexico:
$1,873
(% of AGI for various income ranges: 7.1% for AGIs below $10k, 2.0% for AGIs $10k-25k, 1.6% for AGIs $25k-50k, 1.6% for AGIs $50k-75k, 1.2% for AGIs $75k-100k, 1.7% for AGIs over 100k)
Taxable dividends: $2,270 (reported on 23.3% of returns)
Here:
$2,270
State:
$3,554
(% of AGI for various income ranges: 4.0% for AGIs below $10k, 1.2% for AGIs $10k-25k, 0.8% for AGIs $25k-50k, 1.1% for AGIs $50k-75k, 1.0% for AGIs $75k-100k, 1.7% for AGIs over 100k)
Net capital gain/loss: +$5,660 (reported on 18.1% of returns)
Here:
+$5,660
State:
+$10,425
(% of AGI for various income ranges: -0.9% for AGIs below $10k, 0.1% for AGIs $10k-25k, 0.3% for AGIs $25k-50k, 1.0% for AGIs $50k-75k, 1.0% for AGIs $75k-100k, 6.6% for AGIs over 100k)
Profit/loss from business: +$9,757 (reported on 12.6% of returns)
Here:
+$9,757
State:
+$8,875
(% of AGI for various income ranges: 6.6% for AGIs below $10k, 3.8% for AGIs $10k-25k, 2.1% for AGIs $25k-50k, 2.3% for AGIs $50k-75k, 2.1% for AGIs $75k-100k, 3.9% for AGIs over 100k)
IRA payment deduction: $2,878 (reported on 2.9% of returns)
87112:
$2,878
New Mexico:
$2,940
(% of AGI for various income ranges: 0.4% for AGIs below $10k, 0.2% for AGIs $10k-25k, 0.2% for AGIs $25k-50k, 0.2% for AGIs $50k-75k, 0.2% for AGIs $75k-100k, 0.1% for AGIs over 100k)
Self-employed pension: $11,480 (reported on 0.6% of returns)
Here:
$11,480
New Mexico:
$13,110
(% of AGI for various income ranges: 0.1% for AGIs $25k-50k, 0.1% for AGIs $50k-75k, 0.1% for AGIs $75k-100k, 0.4% for AGIs over 100k)
Total itemized deductions: $15,828 (20% of AGI, reported on 33.2% of returns)
Here:
$15,828
State:
$18,103
Here:
20.3% of AGI
State:
21.5% of AGI
(% of AGI for various income ranges: 11.9% for AGIs below $10k, 8.7% for AGIs $10k-25k, 11.5% for AGIs $25k-50k, 14.2% for AGIs $50k-75k, 14.7% for AGIs $75k-100k, 12.6% for AGIs over 100k)
Charity contributions deductions: $2,752 (3% of AGI, reported on 28.3% of returns)
Here:
$2,752
State:
$3,246
Here:
3.3% of AGI
State:
3.6% of AGI
(% of AGI for various income ranges: 0.8% for AGIs below $10k, 0.8% for AGIs $10k-25k, 1.2% for AGIs $25k-50k, 2.0% for AGIs $50k-75k, 2.4% for AGIs $75k-100k, 2.4% for AGIs over 100k)
Total tax: $6,081 (reported on 75.6% of returns)
87112:
$6,081
State:
$6,237
(% of AGI for various income ranges: 3.2% for AGIs below $10k, 4.1% for AGIs $10k-25k, 7.1% for AGIs $25k-50k, 9.5% for AGIs $50k-75k, 11.2% for AGIs $75k-100k, 17.5% for AGIs over 100k)
Earned income credit: $1,557 (reported on 16.7% of returns)
Here:
$1,557
State:
$1,796
Percentage of individuals using paid preparers for their 2004 taxes: 46.2%
Here:
46%
State:
57%
(% for various income ranges: 44.0% for AGIs below $10k, 49.7% for AGIs $10k-25k, 45.9% for AGIs $25k-50k, 45.3% for AGIs $50k-75k, 42.0% for AGIs $75k-100k, 46.3% for AGIs over 100k)
Likely homosexual households (counted as self-reported same-sex unmarried-partner households)
Lesbian couples: 0.1% of all households
Gay men: 0.4% of all households
Household received Food Stamps/SNAP in the past 12 months: 2,790 Household did not receive Food Stamps/SNAP in the past 12 months: 16,955
Women who had a birth in the past 12 months: 557 (518 now married, 98 unmarried) Women who did not have a birth in the past 12 months: 10,273 (3,168 now married, 7,131 unmarried)
Housing units in zip code 87112 with a mortgage: 8,202 (753 second mortgage, 7 home equity loan, 512 both second mortgage and home equity loan) Houses without a mortgage: 182
Median monthly owner costs for units with a mortgage: $1,420 Median monthly owner costs for units without a mortgage: $484
Residents with income below the poverty level in 2022:
This zip code:
10.9%
Whole state:
17.6%
Residents with income below 50% of the poverty level in 2022:
This zip code:
5.6%
Whole state:
9.7%
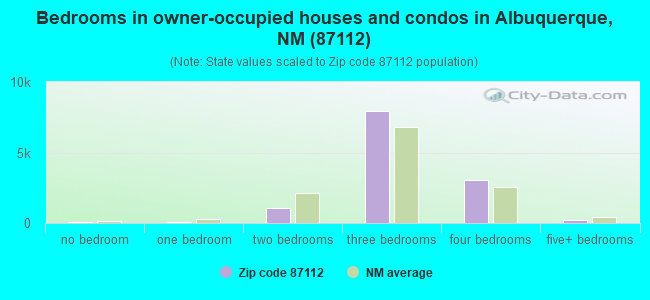
Median number of rooms in houses and condos:
Here:
6.5
State:
5.9
Median number of rooms in apartments:
Here:
4.1
State:
4.2
Notable locations in this zip code not listed on our city pages
Notable locations in zip code 87112: Tijeras Club Gardens (A), Cibola National Forest Supervisors Headquarters (B), Albuquerque Fire Department Station 8 (C), Albuquerque Fire Department Station 9 (D). Display/hide their locations on the map
Shopping Centers: Wyoming Mall (1), Los Altos Shopping Center (2), Snow Heights Shopping Center (3), Princess Jeanne Shopping Center (4), Foothills Shopping Center (5), Eastdale Shopping Center (6). Display/hide their locations on the map
Tourist attractions (not listed on the city page) : Lazer Tag Hinkle Family Fun Center (Amusement & Theme Parks; 12931 Indian School Road Northeast), Weems Galleries & Framing (2801 Eubank Boulevard Northeast Suite M), Taxi Tours of New Mexico (Tours & Charters; 8600 Jaffa Northeast Suite E).
4,137 married couples with children.
2,271 single-parent households (564 men, 1,707 women).
87.2% of residents of 87112 zip code speak English at home.
9.7% of residents speak Spanish at home (81% very well, 13% well, 2% not well, 3% not at all).
1.0% of residents speak other Indo-European language at home (62% very well, 28% well, 10% not well).
2.0% of residents speak Asian or Pacific Island language at home (65% very well, 21% well, 14% not well).
1.6% of residents speak other language at home (76% very well, 13% well, 11% not well).
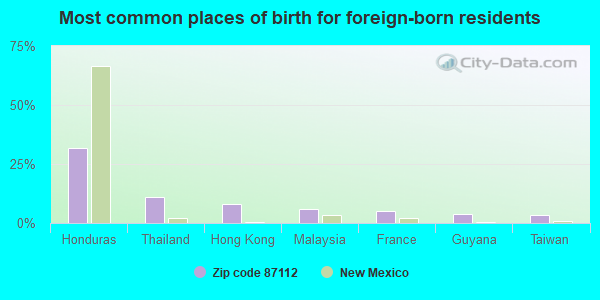
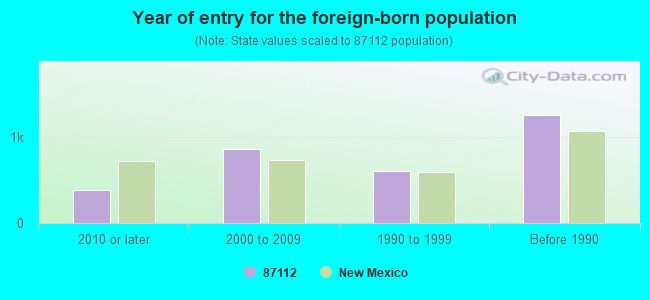
Foreign born population: 2,479 (5.8%) (64.6% of them are naturalized citizens)
Major facilities with environmental interests located in this zip code:
APS GRANT MIDDLE SCHOOL (1111 EASTERDAY NE in ALBUQUERQUE, NM)
AIR MINOR (AIRS/AFS) ENFORCEMENT/COMPLIANCE ACTIVITY (Integrated Compliance Information System) (National Center for Education Statistics) - STATE ID-01011413 Business SIC classification: ELEMENTARY AND SECONDARY SCHOOLS Organizations: ALBUQUERQUE PUBLIC SCHOOLS (SCHOOL DISTRICT)
EUBANK ELEMENTARY (9717 INDIAN SCH NE in ALBUQUERQUE, NM)
AIR MINOR (AIRS/AFS) (National Center for Education Statistics) - STATE ID-01011258 Business SIC classification: ELEMENTARY AND SECONDARY SCHOOLS Organizations: ALBUQUERQUE PUBLIC SCHOOLS (SCHOOL DISTRICT)
Alternative names: APS EUBANK ELEMENTARY SCHOOL
FASHION CLEANERS (2105 EUBANK STREET NORTHEAST in ALBUQUERQUE, NM)
(Resource Conservation and Recovery Act (tracking hazardous waste)) Organizations: WESTERN DRYCLNG INV (CONTACT/OPERATOR)
, GEOFFREY L GROVER DBA SOUTHWEST (CONTACT/OWNER)
, WESTERN DRY CLEANING INVESTMENT (CONTACT/OWNER)
Alternative names: ONE HOUR MARTINIZING
BELLEHAVEN ELEMENTARY (8701 PRIN JEANNE NE in ALBUQUERQUE, NM)
(National Center for Education Statistics) - STATE ID-01011229 Organizations: ALBUQUERQUE PUBLIC SCHOOLS (SCHOOL DISTRICT)
DAVIS CLEANERS #6A (2205 EUBANK BOULEVARD NORTHEAST in ALBUQUERQUE, NM)
AIR MINOR (AIRS/AFS) (Resource Conservation and Recovery Act (tracking hazardous waste)) Business SIC classification: GARMENT PRESSING, AND AGENTS FOR LAUNDRIES AND DRYCLEANERS Organizations: DAVIS DRYCLNG CORP (CONTACT/OPERATOR)
, NGUYEN TRINH (CONTACT/OWNER)
Alternative names: DAVIS CLNRS
CHELWOOD ELEMENTARY (12701 CONSTITUTN NE in ALBUQUERQUE, NM)
(National Center for Education Statistics) - STATE ID-01011236 Organizations: ALBUQUERQUE PUBLIC SCHOOLS (SCHOOL DISTRICT)
COLLET PARK ELEMENTARY (2100 MORRIS ST NE in ALBUQUERQUE, NM)
(National Center for Education Statistics) - STATE ID-01011240 Organizations: ALBUQUERQUE PUBLIC SCHOOLS (SCHOOL DISTRICT)
HAWTHORNE ELEMENTARY (420 G SOMERVELL NE in ALBUQUERQUE, NM)
(National Center for Education Statistics) - STATE ID-01011270 Organizations: ALBUQUERQUE PUBLIC SCHOOLS (SCHOOL DISTRICT)
HOME HOSPITAL (2611 EUBANK NE in ALBUQUERQUE, NM)
(National Center for Education Statistics) - STATE ID-01011998 Organizations: ALBUQUERQUE PUBLIC SCHOOLS (SCHOOL DISTRICT)
JACKSON MIDDLE (10600 INDIAN SCH NE in ALBUQUERQUE, NM)
(National Center for Education Statistics) - STATE ID-01011420 Organizations: ALBUQUERQUE PUBLIC SCHOOLS (SCHOOL DISTRICT)
JOHN BAKER ELEMENTARY (12015 TIVOLI NE in ALBUQUERQUE, NM)
(National Center for Education Statistics) - STATE ID-01011217 Organizations: ALBUQUERQUE PUBLIC SCHOOLS (SCHOOL DISTRICT)
INDIAN HILLS WATER CO (8616 MANAUL N.E., STE C in ALBUQUERQUE, NM)
(Integrated Compliance Information System) - ICIS-06-1997-0283, FORMAL ENFORCEMENT ACTION
ROBERTS OIL CO INC (1600 EUBANK BLVD NE in ALBUQUERQUE, NM)
AIR MINOR (AIRS/AFS) Business SIC classification: GASOLINE SERVICE STATIONS Alternative names: PHILLIPS 66 SERVICE STATION, ROBERTS OIL CO/PHILLIPS 66
Housing units lacking complete kitchen facilities: 0.4%
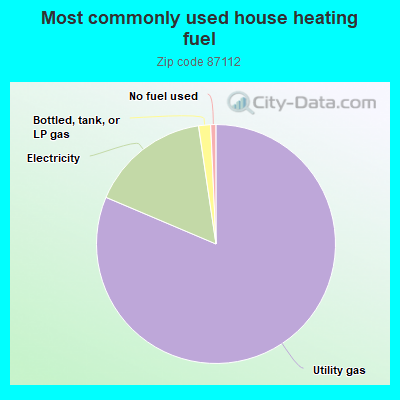
80.5%Utility gas
16.1%Electricity
1.6%Bottled, tank, or LP gas
0.7%No fuel used
Population in 1990: 45,478.
Place of birth for U.S.-born residents:
This state: 22,828
Northeast: 2,631
Midwest: 4,014
South: 4,901
West: 5,079
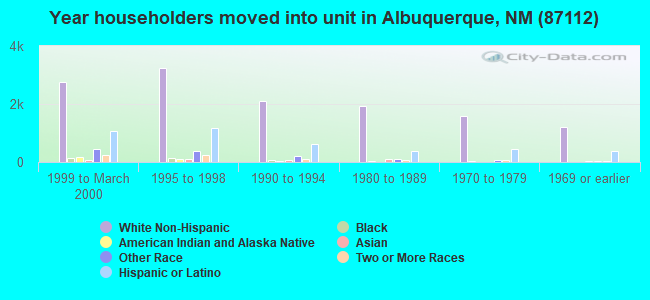
55% of the 87112 zip code residents lived in the same house 5 years ago. Out of people who lived in different houses, 64% lived in this county. Out of people who lived in different counties, 50% lived in New Mexico.
90% of the 87112 zip code residents lived in the same house 1 year ago. Out of people who lived in different houses, 66% moved from this county. Out of people who lived in different houses, 11% moved from different county within same state. Out of people who lived in different houses, 19% moved from different state. Out of people who lived in different houses, 2% moved from abroad.
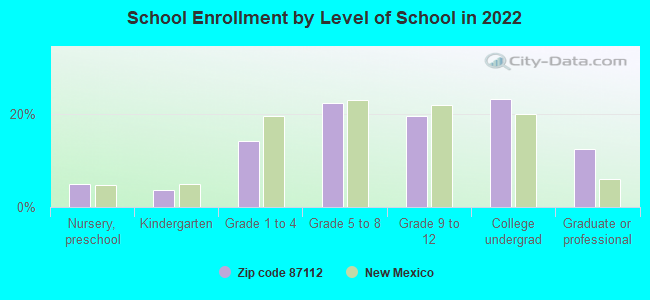
Private vs. public school enrollment:
Students in private schools in grades 1 to 8 (elementary and middle school): 545
Here:
15.5%
New Mexico:
10.2%
Students in private schools in grades 9 to 12 (high school): 240
Here:
12.8%
New Mexico:
10.0%
Students in private undergraduate colleges: 378
Here:
16.9%
New Mexico:
12.3%
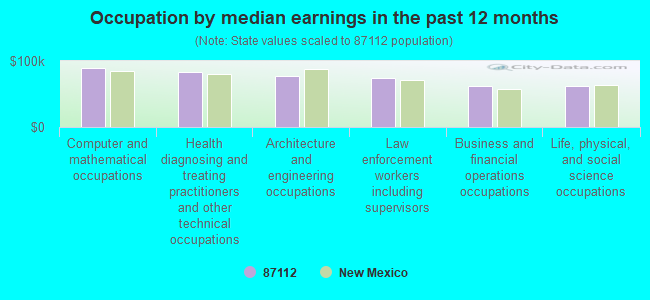
Occupation by median earnings in the past 12 months ($)
89,793Computer and mathematical occupations
83,267Health diagnosing and treating practitioners and other technical occupations
76,651Architecture and engineering occupations
74,346Law enforcement workers including supervisors
61,636Business and financial operations occupations
61,456Life, physical, and social science occupations
Companies with biggest federal contracts located in this zip code (ALBUQUERQUE, NM):
ASRC COMMUNICATIONS, LTD (8500 MENAUL BLVD , NE; small business) : $25,646,936 in 384 contractsfrom 2000 to 2006
Contracts for Maintenance, Repair or Alteration of Real Property -- Other Hospital Buildings, Logistics Support Services, Maintenance, Repair and Rebuilding of Equipment -- Medical, Dental, and Veterinary Equipment and Supplies, Maintenance, Repair and Rebuilding of Equipment -- Automatic Data Processing Equipment (Including Firmware), Software, Supplies and Support Equipment, and moreby Air Force, Army, Navy, Office of Policy, Management and Budget/Chief Financial Officer, and others Signed by year:2000: $5,560,284; 2001: $3,350,533; 2002: $5,783,579; 2003: $5,212,296; 2004: $1,650,778; 2005: $2,678,796; 2006: $1,410,670.
Biggest contracts:
$1,806,691 with Air Force for Maintenance, Repair or Alteration of Real Property -- Other Hospital Buildings. Taking place in MD. Signed on 2000-10-25. Completion date: 2001-09-30.
$1,082,751 with Army for Logistics Support Services. Taking place in MD. Signed on 2002-12-18. Completion date: 2003-12-31.
$993,547, same as above.Signed on 2001-12-21. Completion date: 2002-12-31.
$961,726 with Army for Logistics Support Services. Signed on 2000-12-20. Completion date: 2004-12-31.
THE PROTEUS CORPORATION (10010 INDIAN SCHOOL ROAD,; small business) : $7,958,097 in 48 contractsfrom 1999 to 2003
Contracts for Defense Missile and Space Systems -- Advanced Development (R&D), Other Management Support Services, ADP Systems Analysis Services by Air Force, ENERGY, Department of Signed by year:2000: $1,650,090; 2001: $1,531,384; 2002: $2,766,010; 2003: $1,570,204; 2004: $0; 2005: $0; 2006: $0.
Biggest contracts:
$1,100,000 with Air Force for Defense Missile and Space Systems -- Advanced Development (R&D). Signed on 2002-06-03. Completion date: 2003-02-28.
$600,000, same as above.Signed on 2003-02-28. Completion date: 2003-12-31.
$550,000, same as above.Signed on 2002-05-15. Completion date: 2003-02-28.
$511,374, same as above.Signed on 2001-03-02. Completion date: 2002-01-20.
PANTERA CONSULTING (1700 WELLS NE; small business) : $1,285,336 in 15 contractsfrom 1999 to 2006
Contracts for Weapons -- Operational Systems Development (R&D), Weapons -- Applied Research and Exploratory Development (R&D), Defense Missile and Space Systems -- Advanced Development (R&D), Other Professional Services by Air Force Signed by year:2000: $300,000; 2001: $0; 2002: $248,622; 2003: $239,300; 2004: $185,000; 2005: $88,303; 2006: $190,000.
Biggest contracts:
$175,000 with Air Force for Weapons -- Operational Systems Development (R&D). Signed on 2000-02-16. Completion date: 2002-02-23.
$150,000 with Air Force for Weapons -- Applied Research and Exploratory Development (R&D). Signed on 2006-05-03. Completion date: 2006-09-30.
$150,000 with Air Force for Defense Missile and Space Systems -- Advanced Development (R&D). Signed on 2003-02-21. Completion date: 2004-06-30.
$125,000 with Air Force for Weapons -- Operational Systems Development (R&D). Signed on 2000-11-03. Completion date: 2002-02-23.
T N J CONSTRUCTION (12836 LOMAS BLVD NE A)
$352,160 with Army for Purchase of Structures and Facilities -- Troop Housing Facilities. Taking place in IA. Signed on 2003-02-18. Completion date: 2004-01-31.
GEOPHYSICAL SOLUTIONS INC (1308 NARCISCO COURT; small business) : $335,050 in 3 contractsfrom 2002 to 2003
$126,705 with Army for Other Research and Development -- Applied Research and Exploratory Development (R&D). Signed on 2002-08-09. Completion date: 2003-08-09.
$118,345, same as above.Signed on 2003-02-27. Completion date: 2003-08-09.
$90,000, same as above.Signed on 2003-02-04. Completion date: 2003-08-09.
SOUTHWEST QUALITY SUPPLIERS, L (2705 JUAN TABO NE; small business) : $137,456 in 10 contractsfrom 2000 to 2002
Contracts for Miscellaneous Materials Handling Equipment, Tool and Hardware Boxes, Armor, Personal, In Vitro Diagnostic Substances, Reagents, Test Kits, and Sets, and moreby Air Force, Army Signed by year:2000: $118,675; 2001: $10,543; 2002: $8,238; 2003: $0; 2004: $0; 2005: $0; 2006: $0.
Biggest contracts:
$53,255 with Air Force for Miscellaneous Materials Handling Equipment. Taking place in PA. Signed on 2000-08-22. Completion date: 2000-10-31.
$24,110 with Air Force for Tool and Hardware Boxes. Taking place in IA. Signed on 2000-04-27. Completion date: 2000-05-10.
$17,975 with Air Force for Armor, Personal. Signed on 2000-09-30. Completion date: 2000-09-30.
$12,517 with Air Force for In Vitro Diagnostic Substances, Reagents, Test Kits, and Sets. Signed on 2000-09-19. Completion date: 2000-10-27.
DUSHAN MITROVICH (12912-B KACHINA PL NE; small business)
$99,715 with Air Force for Defense Missile and Space Systems -- Operational Systems Development (R&D). Signed on 2006-04-18. Completion date: 2007-01-07.
NAS-CORP-TELMAH INC (2609 LA CHARLES DR NE; small business) : $59,862 in 5 contractsfrom 2004 to 2006
Contracts for Dental Instruments, Equipment, and Supplies, Medical and Surgical Instruments, Equipment, and Supplies, Hospital Furniture, Equipment, Utensils, and Supplies by Army, Air Force, Minerals Management Service Signed by year:2000: $0; 2001: $0; 2002: $0; 2003: $0; 2004: $7,485; 2005: $35,670; 2006: $16,707.
Biggest contracts:
$30,750 with Army for Dental Instruments, Equipment, and Supplies. Signed on 2005-09-11. Completion date: 2005-09-30.
$16,707 with Air Force for Medical and Surgical Instruments, Equipment, and Supplies. Taking place in HI. Signed on 2006-05-09. Completion date: 2006-06-23.
$7,485 with Army for Medical and Surgical Instruments, Equipment, and Supplies. Signed on 2004-09-29. Completion date: 2004-10-29.
$4,920 with Minerals Management Service for Hospital Furniture, Equipment, Utensils, and Supplies. Taking place in VA. Signed on 2005-03-23. Completion date: 2005-04-22.
LYNN M BARKER (13229 CIRCULO LARGO NE; small business) : $42,145 in 2 contractsfrom 2000 to 2005
$37,979 with Air Force for Stimulated Coherent Radiation Devices, Components and Accessories. Signed on 2000-06-23. Completion date: 2000-09-15.
$4,166 with Army for Fiber Optic Devices. Signed on 2005-06-15. Completion date: 2005-08-11.
COMPUTER DISCOUNTERS, INC (1701 JUAN TABO BLVD NE; small business) : $35,345 in 2 contractsfrom 2003 to 2005
$19,305 with Army for ADPE System Configuration. Signed on 2005-09-21. Completion date: 2005-10-08.
$16,040 with Army for ADP Support Equipment. Signed on 2003-03-27. Completion date: 2003-04-18.
Top industries in this zip code by the number of employees in 2005:
Finance and Insurance: Direct Health and Medical Insurance Carriers (500-999 employees: 1 establishment, 5-9 employees: 1 establishment)
Administrative and Support and Waste Management and Remediation Services: Temporary Help Services (250-499: 1, 100-249: 1, 50-99: 1, 20-49: 2, 10-19: 1, 1-4: 2)
2003 - 2018 National Fire Incident Reporting System (NFIRS) incidents
Based on the data from the years 2003 - 2018 the average number of fires per year is 67. The highest number of fire incidents - 135 took place in 2004, and the least - 8 in 2017. The data has a decreasing trend.
When looking into fire subcategories, the most incidents belonged to: Outside Fires (43.6%), and Structure Fires (37.1%).
Fire incident types reported to NFIRS in Zip Code 87112


 Nearest zip codes: 87116, 87111, 87123, 87110, 87108, 87109.
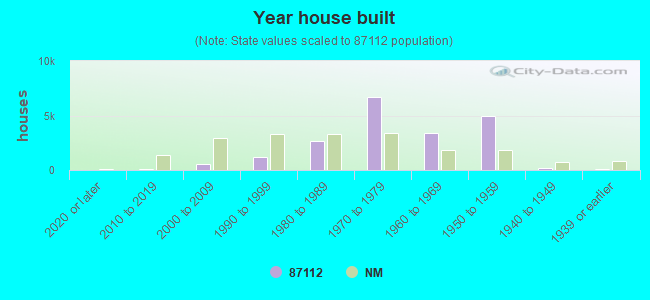


 Based on the data from the years 2003 - 2018 the average number of fires per year is 67. The highest number of fire incidents - 135 took place in 2004, and the least - 8 in 2017. The data has a decreasing trend.
 When looking into fire subcategories, the most incidents belonged to: Outside Fires (43.6%), and Structure Fires (37.1%).