Estimated zip code population in 2022: 18,599 Zip code population in 2010: 17,977 Zip code population in 2000: 12,898
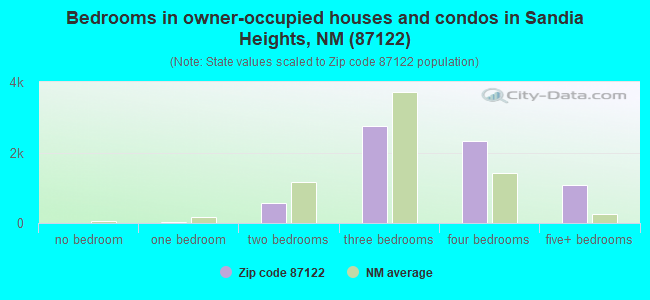
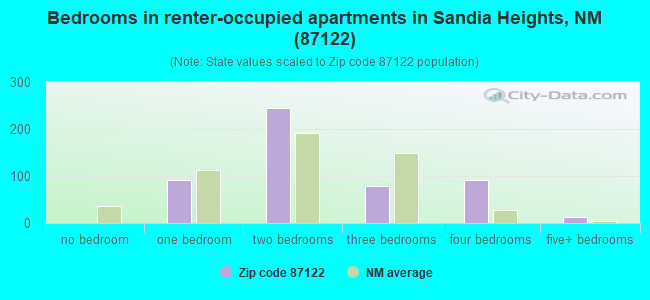
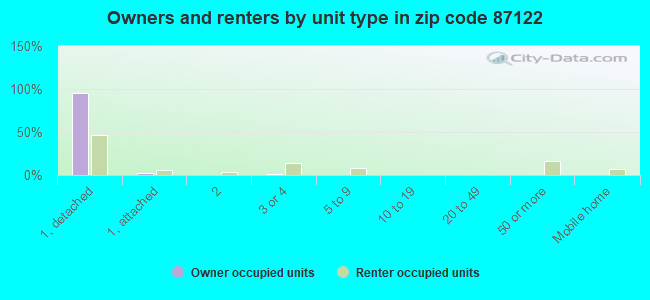
Houses and condos: 6,992 Renter-occupied apartments: 526
% of renters here:
7%
State:
29%
March 2022 cost of living index in zip code 87122: 97.2 (near average, U.S. average is 100)
Land area: 26.7 sq. mi. Water area: 0.0 sq. mi.
Population density: 698 people per square mile
(low).
OSM Map
General Map
Google Map
MSN Map
OSM Map
General Map
Google Map
MSN Map
OSM Map
General Map
Google Map
MSN Map
OSM Map
General Map
Google Map
MSN Map
Please wait while loading the map...
Real estate property taxes paid for housing units in 2022:
This zip code:
0.8% ($5,590)
New Mexico:
0.7% ($1,638)
Median real estate property taxes paid for housing units with mortgages in 2022: $5,810 (0.8%) Median real estate property taxes paid for housing units with no mortgage in 2022: $5,094 (0.8%)
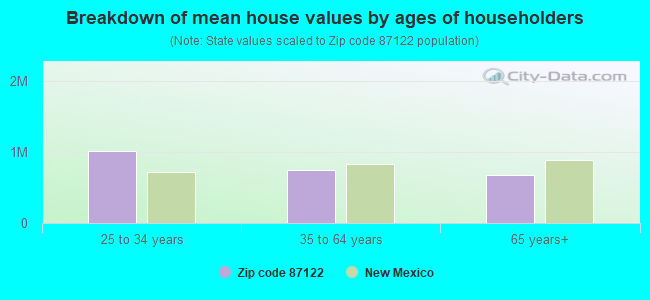
Estimated median house/condo value in 2022: $666,949
87122:
$666,949
New Mexico:
$243,100
According to our research of New Mexico and other state lists, there were 5 registered sex offenders living in 87122 zip code as of April 27, 2024. The ratio of all residents to sex offenders in zip code 87122 is 3,727 to 1. The ratio of registered sex offenders to all residents in this zip code is much lower than the state average.
Median resident age:
This zip code:
46.0 years
New Mexico median age:
39.4 years
Average household size:
This zip code:
2.6 people
New Mexico:
2.4 people
Averages for the 2020 tax year for zip code 87122, filed in 2021:
Average Adjusted Gross Income (AGI) in 2020: $178,037 (Individual Income Tax Returns)
Here:
$178,037
State:
$59,146
Salary/wage: $130,577 (reported on 73.9% of returns)
Here:
$130,577
State:
$48,327
(% of AGI for various income ranges: 1203.0% for AGIs below $25k, 3432.7% for AGIs $25k-50k, 5362.9% for AGIs $50k-75k, 7666.0% for AGIs $75k-100k, 16729.1% for AGIs $100k-200k, 74323.3% for AGIs over 200k)
Taxable interest for individuals: $2,658 (reported on 66.1% of returns)
This zip code:
$2,658
New Mexico:
$1,616
(% of AGI for various income ranges: 54.1% for AGIs below $25k, 130.4% for AGIs $25k-50k, 134.3% for AGIs $50k-75k, 224.8% for AGIs $75k-100k, 352.8% for AGIs $100k-200k, 1107.5% for AGIs over 200k)
Ordinary dividends: $8,965 (reported on 48.6% of returns)
Here:
$8,965
State:
$7,816
(% of AGI for various income ranges: 91.4% for AGIs below $25k, 168.2% for AGIs $25k-50k, 415.7% for AGIs $50k-75k, 435.7% for AGIs $75k-100k, 815.2% for AGIs $100k-200k, 3041.2% for AGIs over 200k)
Net capital gain/loss in AGI: +$42,262 (reported on 46.2% of returns)
Here:
+$42,262
State:
+$19,595
(% of AGI for various income ranges: 76.1% for AGIs below $25k, 234.5% for AGIs $25k-50k, 254.3% for AGIs $50k-75k, 431.2% for AGIs $75k-100k, 1275.6% for AGIs $100k-200k, 20152.2% for AGIs over 200k)
Profit/loss from business: +$27,388 (reported on 18.1% of returns)
Here:
+$27,388
State:
+$11,430
(% of AGI for various income ranges: 113.6% for AGIs below $25k, 229.6% for AGIs $25k-50k, 249.5% for AGIs $50k-75k, 254.0% for AGIs $75k-100k, 770.8% for AGIs $100k-200k, 3952.8% for AGIs over 200k)
Taxable individual retirement arrangement distribution: $32,747 (reported on 17.1% of returns)
87122:
$32,747
New Mexico:
$20,970
(% of AGI for various income ranges: 86.2% for AGIs below $25k, 267.9% for AGIs $25k-50k, 589.0% for AGIs $50k-75k, 1085.2% for AGIs $75k-100k, 1388.5% for AGIs $100k-200k, 3011.1% for AGIs over 200k)
Self-employed (Keogh) retirement plans: $28,453 (reported on 2.0% of returns)
87122:
$28,453
New Mexico:
$20,997
(% of AGI for various income ranges: 70.8% for AGIs $100k-200k, 557.8% for AGIs over 200k)
Total itemized deductions: $40,639 (reported on 26.3% of returns)
Here:
$40,639
State:
$33,187
(% of AGI for various income ranges: 218.5% for AGIs below $25k, 450.9% for AGIs $25k-50k, 923.6% for AGIs $50k-75k, 978.1% for AGIs $75k-100k, 1945.6% for AGIs $100k-200k, 7641.4% for AGIs over 200k)
Charity contributions: $15,222 (reported on 22.6% of returns)
Here:
$15,222
State:
$11,850
(% of AGI for various income ranges: 11.2% for AGIs below $25k, 60.5% for AGIs $25k-50k, 137.4% for AGIs $50k-75k, 194.8% for AGIs $75k-100k, 448.4% for AGIs $100k-200k, 3059.7% for AGIs over 200k)
Taxes paid: $9,094 (reported on 26.2% of returns)
87122:
$9,094
State:
$7,150
(% of AGI for various income ranges: 34.3% for AGIs below $25k, 79.3% for AGIs $25k-50k, 221.9% for AGIs $50k-75k, 263.1% for AGIs $75k-100k, 544.2% for AGIs $100k-200k, 1523.8% for AGIs over 200k)
Earned income credit: $1,290 (reported on 3.6% of returns)
Here:
$1,290
State:
$2,323
(% of AGI for various income ranges: 25.6% for AGIs below $25k, 24.8% for AGIs $25k-50k)
Percentage of individuals using paid preparers for their 2020 taxes: 91.6%
Here:
92%
State:
92%
(% for various income ranges: 89.5% for AGIs below $25k, 91.7% for AGIs $25k-50k, 90.0% for AGIs $50k-75k, 90.4% for AGIs $75k-100k, 92.2% for AGIs $100k-200k, 93.3% for AGIs over 200k)
Averages for the 2012 tax year for zip code 87122, filed in 2013:
Average Adjusted Gross Income (AGI) in 2012: $129,872 (Individual Income Tax Returns)
Here:
$129,872
State:
$50,343
Salary/wage: $99,263 (reported on 78.3% of returns)
Here:
$99,263
State:
$41,171
(% of AGI for various income ranges: 73.9% for AGIs below $25k, 61.8% for AGIs $25k-50k, 49.9% for AGIs $50k-75k, 59.1% for AGIs $75k-100k, 67.6% for AGIs $100k-200k, 55.7% for AGIs over 200k)
Taxable interest for individuals: $2,803 (reported on 65.0% of returns)
This zip code:
$2,803
New Mexico:
$1,677
(% of AGI for various income ranges: 3.2% for AGIs below $25k, 2.5% for AGIs $25k-50k, 2.4% for AGIs $50k-75k, 1.4% for AGIs $75k-100k, 1.2% for AGIs $100k-200k, 1.3% for AGIs over 200k)
Ordinary dividends: $7,761 (reported on 48.0% of returns)
Here:
$7,761
State:
$6,939
(% of AGI for various income ranges: 4.5% for AGIs below $25k, 4.6% for AGIs $25k-50k, 3.6% for AGIs $50k-75k, 2.7% for AGIs $75k-100k, 2.3% for AGIs $100k-200k, 3.0% for AGIs over 200k)
Net capital gain/loss in AGI: +$22,136 (reported on 42.7% of returns)
Here:
+$22,136
State:
+$14,311
(% of AGI for various income ranges: 1.0% for AGIs below $25k, 0.8% for AGIs $25k-50k, 1.2% for AGIs $50k-75k, 1.2% for AGIs $75k-100k, 1.7% for AGIs $100k-200k, 12.5% for AGIs over 200k)
Profit/loss from business: +$25,319 (reported on 19.6% of returns)
Here:
+$25,319
State:
+$11,059
(% of AGI for various income ranges: 4.9% for AGIs below $25k, 4.7% for AGIs $25k-50k, 5.5% for AGIs $50k-75k, 3.8% for AGIs $75k-100k, 2.9% for AGIs $100k-200k, 4.1% for AGIs over 200k)
Taxable individual retirement arrangement distribution: $24,504 (reported on 17.7% of returns)
87122:
$24,504
New Mexico:
$15,706
(% of AGI for various income ranges: 4.7% for AGIs below $25k, 5.8% for AGIs $25k-50k, 5.8% for AGIs $50k-75k, 5.3% for AGIs $75k-100k, 3.9% for AGIs $100k-200k, 2.4% for AGIs over 200k)
Self-employment retirement plans: $22,584 (reported on 2.4% of returns)
87122:
$22,584
New Mexico:
$18,209
(% of AGI for various income ranges: 1.2% for AGIs $50k-75k, 0.3% for AGIs $100k-200k, 0.5% for AGIs over 200k)
Total itemized deductions: $32,347 (17% of AGI, reported on 60.7% of returns)
Here:
$32,347
State:
$21,709
Here:
17.0% of AGI
State:
19.8% of AGI
(% of AGI for various income ranges: 19.5% for AGIs below $25k, 20.2% for AGIs $25k-50k, 21.6% for AGIs $50k-75k, 19.0% for AGIs $75k-100k, 17.1% for AGIs $100k-200k, 12.4% for AGIs over 200k)
Charity contributions: $5,687 (reported on 54.3% of returns)
Here:
$5,687
State:
$4,195
(% of AGI for various income ranges: 1.5% for AGIs below $25k, 2.0% for AGIs $25k-50k, 2.3% for AGIs $50k-75k, 2.5% for AGIs $75k-100k, 2.7% for AGIs $100k-200k, 2.2% for AGIs over 200k)
Taxes paid: $11,598 (reported on 60.5% of returns)
87122:
$11,598
State:
$6,176
(% of AGI for various income ranges: 3.6% for AGIs below $25k, 4.5% for AGIs $25k-50k, 5.6% for AGIs $50k-75k, 5.5% for AGIs $75k-100k, 6.0% for AGIs $100k-200k, 5.1% for AGIs over 200k)
Earned income credit: $1,356 (reported on 4.5% of returns)
Here:
$1,356
State:
$2,311
(% of AGI for various income ranges: 1.9% for AGIs below $25k, 0.4% for AGIs $25k-50k)
Percentage of individuals using paid preparers for their 2012 taxes: 50.1%
Here:
50%
State:
50%
(% for various income ranges: 41.0% for AGIs below $25k, 50.6% for AGIs $25k-50k, 55.8% for AGIs $50k-75k, 48.1% for AGIs $75k-100k, 46.1% for AGIs $100k-200k, 67.6% for AGIs over 200k)
Averages for the 2004 tax year for zip code 87122, filed in 2005:
Average Adjusted Gross Income (AGI) in 2004: $105,104 (Individual Income Tax Returns)
Here:
$105,104
State:
$39,572
Salary/wage: $84,588 (reported on 80.7% of returns)
Here:
$84,588
State:
$34,237
(% of AGI for various income ranges: 142.9% for AGIs below $10k, 64.6% for AGIs $10k-25k, 57.9% for AGIs $25k-50k, 61.4% for AGIs $50k-75k, 70.8% for AGIs $75k-100k, 64.4% for AGIs over 100k)
Taxable interest for individuals: $2,694 (reported on 74.2% of returns)
This zip code:
$2,694
New Mexico:
$1,873
(% of AGI for various income ranges: 12.7% for AGIs below $10k, 5.6% for AGIs $10k-25k, 3.8% for AGIs $25k-50k, 2.9% for AGIs $50k-75k, 1.7% for AGIs $75k-100k, 1.6% for AGIs over 100k)
Taxable dividends: $4,581 (reported on 54.6% of returns)
Here:
$4,581
State:
$3,554
(% of AGI for various income ranges: 19.8% for AGIs below $10k, 6.5% for AGIs $10k-25k, 3.6% for AGIs $25k-50k, 3.1% for AGIs $50k-75k, 2.0% for AGIs $75k-100k, 2.1% for AGIs over 100k)
Net capital gain/loss: +$16,403 (reported on 46.0% of returns)
Here:
+$16,403
State:
+$10,425
(% of AGI for various income ranges: 11.0% for AGIs below $10k, 1.2% for AGIs $10k-25k, 2.1% for AGIs $25k-50k, 1.6% for AGIs $50k-75k, 1.9% for AGIs $75k-100k, 8.7% for AGIs over 100k)
Profit/loss from business: +$22,342 (reported on 19.8% of returns)
Here:
+$22,342
State:
+$8,875
(% of AGI for various income ranges: 7.9% for AGIs below $10k, 5.2% for AGIs $10k-25k, 7.2% for AGIs $25k-50k, 4.4% for AGIs $50k-75k, 4.1% for AGIs $75k-100k, 4.0% for AGIs over 100k)
IRA payment deduction: $3,541 (reported on 5.0% of returns)
87122:
$3,541
New Mexico:
$2,940
(% of AGI for various income ranges: 0.8% for AGIs below $10k, 0.6% for AGIs $10k-25k, 0.5% for AGIs $25k-50k, 0.4% for AGIs $50k-75k, 0.2% for AGIs $75k-100k, 0.1% for AGIs over 100k)
Self-employed pension: $14,423 (reported on 3.1% of returns)
Here:
$14,423
New Mexico:
$13,110
(% of AGI for various income ranges: 0.6% for AGIs $10k-25k, 0.3% for AGIs $50k-75k, 0.4% for AGIs $75k-100k, 0.5% for AGIs over 100k)
Total itemized deductions: $26,966 (18% of AGI, reported on 64.9% of returns)
Here:
$26,966
State:
$18,103
Here:
18.3% of AGI
State:
21.5% of AGI
(% of AGI for various income ranges: 23.1% for AGIs below $10k, 24.3% for AGIs $10k-25k, 23.8% for AGIs $25k-50k, 22.6% for AGIs $50k-75k, 20.4% for AGIs $75k-100k, 15.1% for AGIs over 100k)
Charity contributions deductions: $4,739 (3% of AGI, reported on 59.8% of returns)
Here:
$4,739
State:
$3,246
Here:
3.1% of AGI
State:
3.6% of AGI
(% of AGI for various income ranges: 1.4% for AGIs below $10k, 2.3% for AGIs $10k-25k, 2.5% for AGIs $25k-50k, 2.8% for AGIs $50k-75k, 2.8% for AGIs $75k-100k, 2.7% for AGIs over 100k)
Total tax: $20,493 (reported on 85.0% of returns)
87122:
$20,493
State:
$6,237
(% of AGI for various income ranges: 4.5% for AGIs below $10k, 5.2% for AGIs $10k-25k, 7.9% for AGIs $25k-50k, 9.2% for AGIs $50k-75k, 10.2% for AGIs $75k-100k, 18.8% for AGIs over 100k)
Earned income credit: $1,103 (reported on 2.7% of returns)
Here:
$1,103
State:
$1,796
Percentage of individuals using paid preparers for their 2004 taxes: 50.3%
Here:
50%
State:
57%
(% for various income ranges: 43.6% for AGIs below $10k, 48.9% for AGIs $10k-25k, 55.3% for AGIs $25k-50k, 53.7% for AGIs $50k-75k, 43.7% for AGIs $75k-100k, 53.6% for AGIs over 100k)
Likely homosexual households (counted as self-reported same-sex unmarried-partner households)
Lesbian couples: 0.2% of all households
Gay men: 0.2% of all households
Household received Food Stamps/SNAP in the past 12 months: 100 Household did not receive Food Stamps/SNAP in the past 12 months: 6,816
Women who had a birth in the past 12 months: 77 (94 now married, 0 unmarried) Women who did not have a birth in the past 12 months: 3,512 (2,006 now married, 1,470 unmarried)
Housing units in zip code 87122 with a mortgage: 4,349 (487 second mortgage, 405 both second mortgage and home equity loan) Houses without a mortgage: 93
Median monthly owner costs for units with a mortgage: $2,731 Median monthly owner costs for units without a mortgage: $798
Residents with income below the poverty level in 2022:
This zip code:
2.7%
Whole state:
17.6%
Residents with income below 50% of the poverty level in 2022:
This zip code:
1.5%
Whole state:
9.7%
Median number of rooms in houses and condos:
Here:
7.4
State:
5.9
Median number of rooms in apartments:
Here:
4.3
State:
4.2
Notable locations in this zip code not listed on our city pages
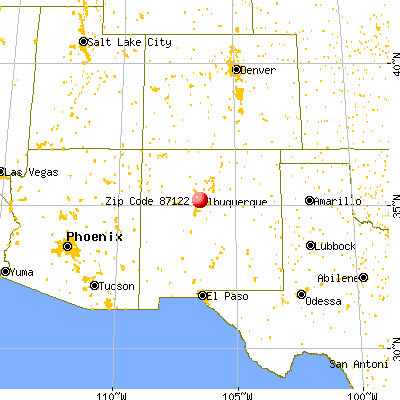
Notable locations in zip code 87122: The Tram Trailhead (A), La Cueva Trailhead (B), Tramway (C), Jaral Ranger Station (D), Juan Tabo Cabin (E), La Cueva Recreation Site (F), Sandia Resort and Casino (G), Bernalillo County Fire and Rescue Station 5 (H). Display/hide their locations on the map
Churches in zip code 87122 include: Albuquerque New Mexico Temple Church of Jesus Christ of Latter Day Saints (A), Sandia Presbyterian Church (B), Church of the Good Shepherd (C), Grace Lutheran Church (D), Covenant United Methodist Church (E), Bethal Heritage Church (F), Church of Saint Peter Anglican Catholic (G). Display/hide their locations on the map
Size of family households: 2,671 2-persons, 1,005 3-persons, 1,023 4-persons, 600 5-persons, 163 6-persons, 26 7-or-more-persons
Size of nonfamily households: 1,243 1-person, 235 2-persons, 10 6-persons
3,663 married couples with children.
560 single-parent households (288 men, 272 women).
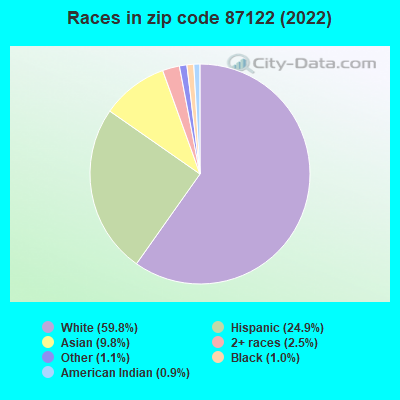
85.2% of residents of 87122 zip code speak English at home.
6.8% of residents speak Spanish at home (85% very well, 8% well, 5% not well, 2% not at all).
4.4% of residents speak other Indo-European language at home (79% very well, 20% well, 1% not well).
5.4% of residents speak Asian or Pacific Island language at home (79% very well, 10% well, 3% not well, 7% not at all).
0.4% of residents speak other language at home (89% very well, 11% well).
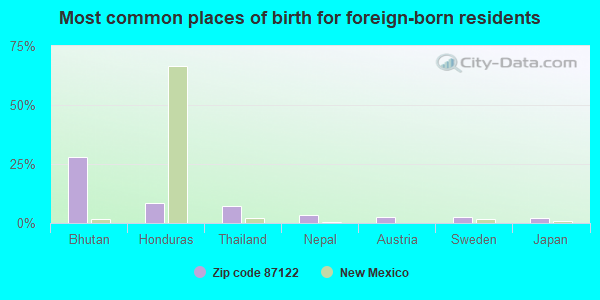
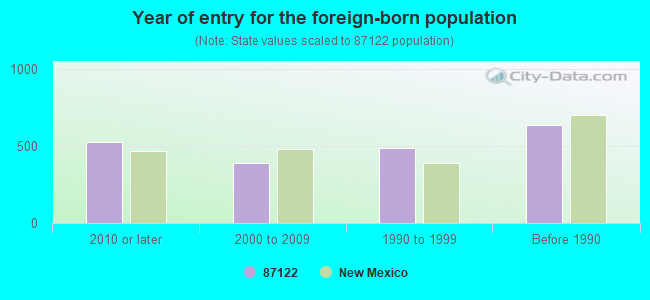
Foreign born population: 1,740 (9.4%) (63.9% of them are naturalized citizens)
Facilities with environmental interests located in this zip code:
ALBUQUERQUE PUBLIC SCHOOL DESERT RIDGE MIDDLE SCHOOL (8400 BARSTOW NORTHEAST in ALBUQUERQUE, NM)
AIR MINOR (AIRS/AFS) (National Center for Education Statistics) - STATE ID-01011430 Business SIC classification: ELEMENTARY AND SECONDARY SCHOOLS Organizations: ALBUQUERQUE PUBLIC SCHOOLS (SCHOOL DISTRICT)
Alternative names: APS DESERT RIDGE MIDDLE SCHOOL
LA CUEVA HIGH SCHOOL (7801 WILSHIRE NORTHEAST in ALBUQUERQUE, NM)
AIR MINOR (AIRS/AFS) (National Center for Education Statistics) - STATE ID-01011525 Business SIC classification: ELEMENTARY AND SECONDARY SCHOOLS Organizations: ALBUQUERQUE PUBLIC SCHOOLS (SCHOOL DISTRICT)
Alternative names: APS LA CUEVA HIGH SCHOOL
GEORGIA O'KEEFFE ELEM (11701 SAN VICTOR NE in ALBUQUERQUE, NM)
(National Center for Education Statistics) - STATE ID-01011328 Organizations: ALBUQUERQUE PUBLIC SCHOOLS (SCHOOL DISTRICT)
J & H SERVICES (CORNER OF ELENA AND BARSTOW NE in ALBUQUERQUE, NM)
AIR MINOR (AIRS/AFS) Business SIC classification: ASPHALT PAVING MIXTURES AND BLOCKS
ROBERTS OIL CO. (7843 TRAMWAY BLVD NE in ALBUQUERQUE, NM)
AIR MINOR (AIRS/AFS) Business SIC classification: GASOLINE SERVICE STATIONS
Housing units lacking complete plumbing facilities: 0.3% Housing units lacking complete kitchen facilities: 0.8%
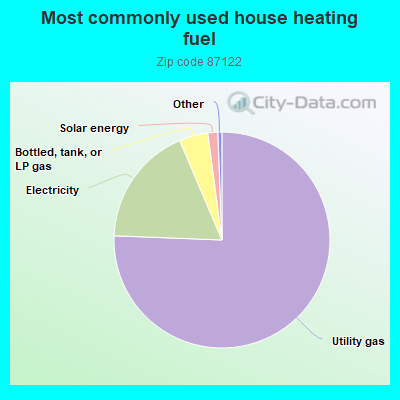
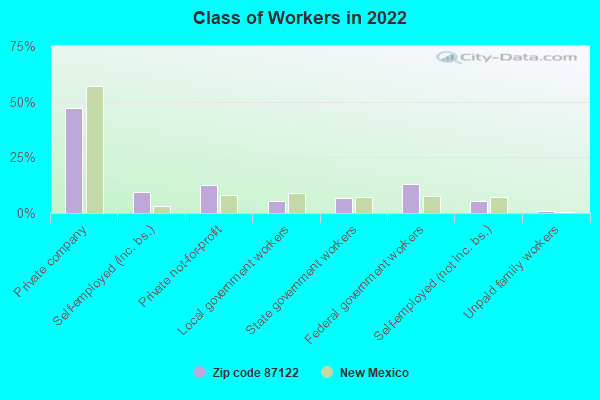
75.7%Utility gas
18.0%Electricity
4.3%Bottled, tank, or LP gas
1.5%Solar energy
Population in 1990: 6,127. Population change in the 1990s: +6,771 (+110.5%).
Place of birth for U.S.-born residents:
This state: 7,187
Northeast: 1,433
Midwest: 2,642
South: 2,240
West: 3,132
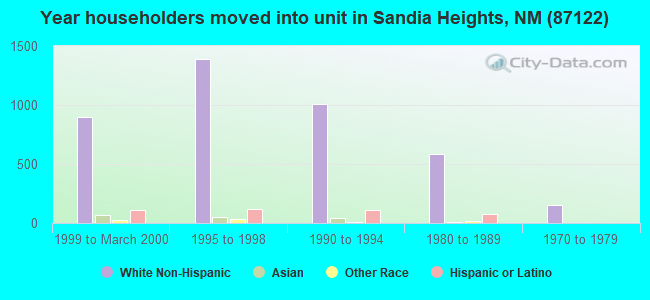
47% of the 87122 zip code residents lived in the same house 5 years ago. Out of people who lived in different houses, 54% lived in this county. Out of people who lived in different counties, 50% lived in New Mexico.
86% of the 87122 zip code residents lived in the same house 1 year ago. Out of people who lived in different houses, 53% moved from this county. Out of people who lived in different houses, 9% moved from different county within same state. Out of people who lived in different houses, 33% moved from different state. Out of people who lived in different houses, 5% moved from abroad.
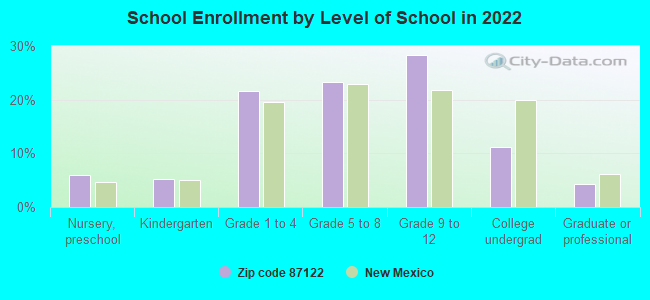
Private vs. public school enrollment:
Students in private schools in grades 1 to 8 (elementary and middle school): 466
Here:
23.3%
New Mexico:
10.2%
Students in private schools in grades 9 to 12 (high school): 315
Here:
24.7%
New Mexico:
10.0%
Students in private undergraduate colleges: 114
Here:
23.9%
New Mexico:
12.3%
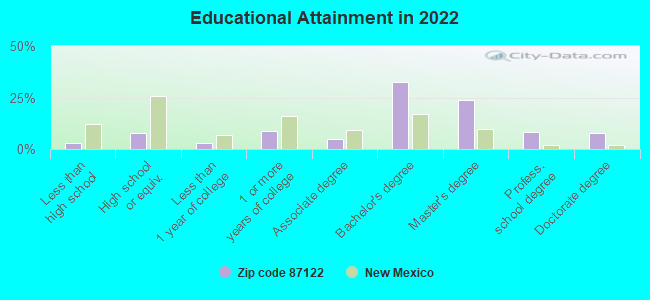
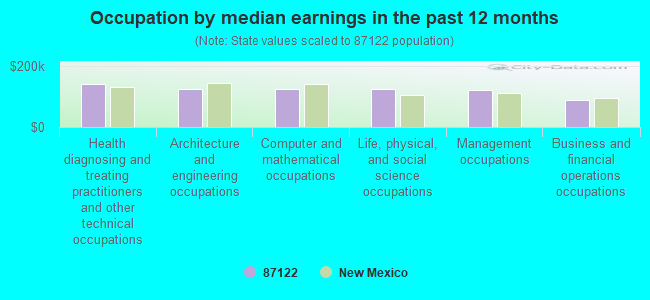
Occupation by median earnings in the past 12 months ($)
140,353Health diagnosing and treating practitioners and other technical occupations
126,029Architecture and engineering occupations
124,642Computer and mathematical occupations
123,554Life, physical, and social science occupations
121,324Management occupations
88,959Business and financial operations occupations
Companies with federal contracts located in this zip code (ALBUQUERQUE, NM):
DOMINCA (12111 RANCHITOS ROAD, NE; small business) : $2,295,852 in 11 contractsfrom 2000 to 2006
Contracts for Physical Sciences -- Management and Support (R&D), Other Medical -- Operational Systems Development (R&D), Ammunition -- Management and Support (R&D), Other Medical -- Basic Research (R&D), and moreby Air Force, Army Signed by year:2000: $81,514; 2001: $1,019,396; 2002: $0; 2003: $380,657; 2004: $0; 2005: $442,024; 2006: $372,261.
Biggest contracts:
$372,261 with Air Force for Physical Sciences -- Management and Support (R&D). Signed on 2006-02-09. Completion date: 2006-03-31.
$372,261, same as above.Signed on 2005-03-22. Completion date: 2006-03-31.
$365,639 with Army for Other Medical -- Operational Systems Development (R&D). Signed on 2001-09-26. Completion date: 2001-08-07.
$281,909, same as above.Signed on 2003-01-30. Completion date: 2001-08-07.
INTERNATIONAL PHOTONIC CONSULT (30 TIERRA MONTE ST NE; small business) : $1,598,239 in 16 contractsfrom 2001 to 2006
Contracts for Defense Missile and Space Systems -- Basic Research (R&D), Defense Missile and Space Systems -- Applied Research and Exploratory Development (R&D), Other Defense -- Advanced Development (R&D), Other Defense -- Basic Research (R&D), and moreby Air Force, Missile Defense Agency, Department of Defense Signed by year:2000: $0; 2001: $267,629; 2002: $284,142; 2003: $201,627; 2004: $744,955; 2005: $0; 2006: $99,886.
Biggest contracts:
$744,955 with Air Force for Defense Missile and Space Systems -- Basic Research (R&D). Taking place in CO. Signed on 2004-08-05. Completion date: 2006-09-29.
$141,335 with Air Force for Defense Missile and Space Systems -- Basic Research (R&D). Signed on 2002-09-18. Completion date: 2003-11-03.
$99,962 with Air Force for Defense Missile and Space Systems -- Applied Research and Exploratory Development (R&D). Signed on 2001-09-20. Completion date: 2002-12-15.
$99,886 with Missile Defense Agency for Defense Missile and Space Systems -- Basic Research (R&D). Signed on 2006-03-31. Completion date: 2006-10-02.
PULSE POWER PHYSICS, INC (1039 RED OAKS LP NE; small business) : $752,026 in 5 contractsfrom 1999 to 2003
Contracts for Weapons -- Advanced Development (R&D), Weapons -- Applied Research and Exploratory Development (R&D), Miscellaneous Defense Hard Goods -- Management and Support (R&D) by Air Force Signed by year:2000: $154,456; 2001: $0; 2002: $0; 2003: $297,775; 2004: $0; 2005: $0; 2006: $0.
Biggest contracts:
$297,775 with Air Force for Weapons -- Advanced Development (R&D). Signed on 2003-03-12. Completion date: 2004-12-10.
$224,795 with Air Force for Weapons -- Applied Research and Exploratory Development (R&D). Signed on 1999-12-21. Completion date: 2001-06-19.
$100,000 with Air Force for Miscellaneous Defense Hard Goods -- Management and Support (R&D). Signed on 2000-01-07. Completion date: 2001-06-01.
$75,000, same as above.Signed on 1999-10-26. Completion date: 2001-06-01.
R-CUBED INC (1028 TRAMWAY LN NE; small business) : $510,541 in 14 contractsfrom 2001 to 2006
Contracts for Weapons -- Applied Research and Exploratory Development (R&D), Weapons -- Basic Research (R&D), Weapons -- Advanced Development (R&D) by Air Force Signed by year:2000: $0; 2001: $26,087; 2002: $79,994; 2003: $70,235; 2004: $170,961; 2005: $94,750; 2006: $68,514.
Biggest contracts:
$96,018 with Air Force for Weapons -- Applied Research and Exploratory Development (R&D). Signed on 2004-08-24. Completion date: 2005-08-31.
$79,994 with Air Force for Weapons -- Basic Research (R&D). Signed on 2002-07-09. Completion date: 2003-06-30.
$74,943 with Air Force for Weapons -- Applied Research and Exploratory Development (R&D). Signed on 2004-09-27. Completion date: 2005-08-31.
$55,000, same as above.Signed on 2006-01-11. Completion date: 2005-08-31.
DNK, LLC (12300 CRESTED MOSS RD NE; small business) : $199,804 in 2 contractsin 2005
$100,527 with Air Force for Defense Electronics and Communication Equipment -- Applied Research and Exploratory Development (R&D). Signed on 2005-11-09. Completion date: 2006-03-08.
$99,277 with Air Force for Defense Electronics and Communication Equipment -- Applied Research and Exploratory Development (R&D). Taking place in MD. Signed on 2005-03-08. Completion date: 2005-12-07.
SHARRI L ROMERO (8428 WILSON HURLEY PL NE) : $144,975 in 2 contractsin 2002
$136,875 with Army for Lodging - Hotel/Motel. Signed on 2002-01-15. Completion date: 2003-01-14.
$8,100, same as above.Signed on 2002-06-19. Completion date: 2003-01-14.
SUSAN L WOOD (1220 ROCKROSE RD NE; small business) : -$2,550 in 2 contractsin 2004
$0 with Navy for Nursing Services. Signed on 2004-04-30. Completion date: 2001-09-30.
-$2,550, same as above.Signed on 2004-04-30. Completion date: 2001-09-30.
CYNTHIA A DORSCH (889 TRAMWAY LN NE; small business) : -$4,200 in 2 contractsin 2004
$0 with Navy for Nursing Services. Signed on 2004-04-30. Completion date: 2001-09-03.
-$4,200, same as above.Signed on 2004-04-30. Completion date: 2001-09-03.
Top industries in this zip code by the number of employees in 2005:
2004 - 2018 National Fire Incident Reporting System (NFIRS) incidents
Based on the data from the years 2004 - 2018 the average number of fire incidents per year is 25. The highest number of fire incidents - 54 took place in 2007, and the least - 15 in 2004. The data has an increasing trend.
When looking into fire subcategories, the most reports belonged to: Outside Fires (53.7%), and Structure Fires (25.9%).
Fire incident types reported to NFIRS in Zip Code 87122


 Nearest zip codes: 87111, 87109, 87112, 87113, 87043, 87110.
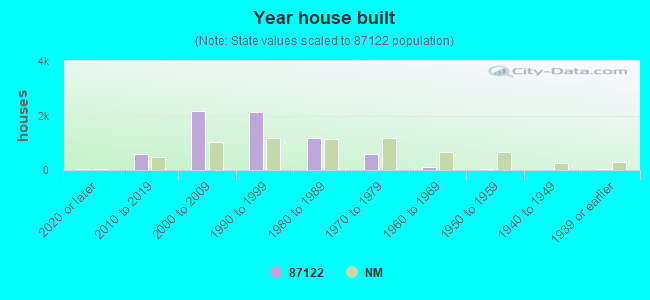


 Based on the data from the years 2004 - 2018 the average number of fire incidents per year is 25. The highest number of fire incidents - 54 took place in 2007, and the least - 15 in 2004. The data has an increasing trend.
 When looking into fire subcategories, the most reports belonged to: Outside Fires (53.7%), and Structure Fires (25.9%).