Estimated zip code population in 2022: 30,724 Zip code population in 2010: 28,714 Zip code population in 2000: 30,562
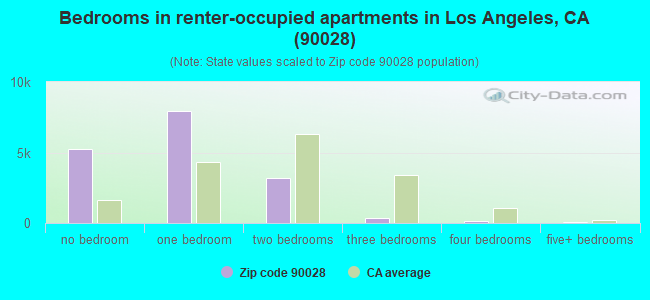
Houses and condos: 22,389 Renter-occupied apartments: 16,752
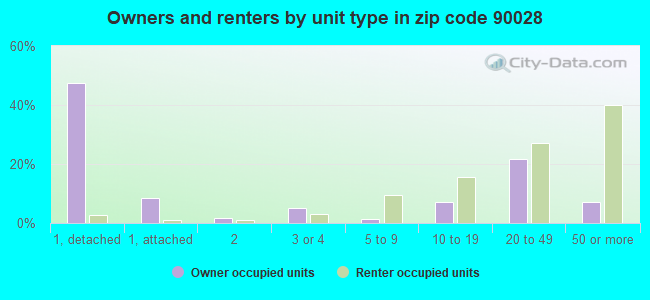
% of renters here:
96%
State:
44%
March 2022 cost of living index in zip code 90028: 147.0 (very high, U.S. average is 100)
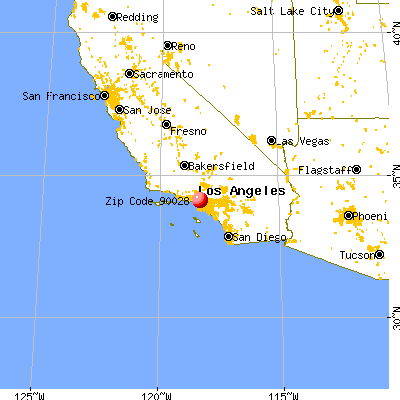
Land area: 1.5 sq. mi. Water area: 0.0 sq. mi.
Population density: 20,156 people per square mile
(very high).
OSM Map
General Map
Google Map
MSN Map
OSM Map
General Map
Google Map
MSN Map
OSM Map
General Map
Google Map
MSN Map
OSM Map
General Map
Google Map
MSN Map
Please wait while loading the map...
Real estate property taxes paid for housing units in 2022:
This zip code:
0.5% ($4,770)
California:
0.7% ($4,831)
Median real estate property taxes paid for housing units with mortgages in 2022: $5,089 (0.5%) Median real estate property taxes paid for housing units with no mortgage in 2022: $4,125 (0.5%)
Estimated median house/condo value in 2022: $954,570
90028:
$954,570
California:
$715,900
According to our research of California and other state lists, there were 40 registered sex offenders living in 90028 zip code as of April 27, 2024. The ratio of all residents to sex offenders in zip code 90028 is 789 to 1. The ratio of registered sex offenders to all residents in this zip code is near the state average.
Median resident age:
This zip code:
37.1 years
California median age:
37.9 years
Average household size:
This zip code:
1.6 people
California:
2.8 people
Averages for the 2020 tax year for zip code 90028, filed in 2021:
Average Adjusted Gross Income (AGI) in 2020: $54,950 (Individual Income Tax Returns)
Here:
$54,950
State:
$95,910
Salary/wage: $49,726 (reported on 80.9% of returns)
Here:
$49,726
State:
$77,331
(% of AGI for various income ranges: 992.7% for AGIs below $25k, 3982.1% for AGIs $25k-50k, 8022.3% for AGIs $50k-75k, 12244.0% for AGIs $75k-100k, 21301.0% for AGIs $100k-200k, 97720.6% for AGIs over 200k)
Taxable interest for individuals: $1,280 (reported on 16.4% of returns)
This zip code:
$1,280
California:
$2,294
(% of AGI for various income ranges: 6.3% for AGIs below $25k, 9.2% for AGIs $25k-50k, 22.2% for AGIs $50k-75k, 25.5% for AGIs $75k-100k, 82.1% for AGIs $100k-200k, 1135.9% for AGIs over 200k)
Ordinary dividends: $4,167 (reported on 12.9% of returns)
Here:
$4,167
State:
$10,949
(% of AGI for various income ranges: 16.9% for AGIs below $25k, 21.1% for AGIs $25k-50k, 39.6% for AGIs $50k-75k, 72.1% for AGIs $75k-100k, 180.8% for AGIs $100k-200k, 3160.0% for AGIs over 200k)
Net capital gain/loss in AGI: +$12,367 (reported on 14.0% of returns)
Here:
+$12,367
State:
+$49,306
(% of AGI for various income ranges: 10.6% for AGIs below $25k, 43.1% for AGIs $25k-50k, 88.1% for AGIs $50k-75k, 117.3% for AGIs $75k-100k, 542.9% for AGIs $100k-200k, 12792.9% for AGIs over 200k)
Profit/loss from business: +$9,151 (reported on 29.8% of returns)
Here:
+$9,151
State:
+$15,671
(% of AGI for various income ranges: 204.3% for AGIs below $25k, 339.9% for AGIs $25k-50k, 278.8% for AGIs $50k-75k, 861.6% for AGIs $75k-100k, 1126.9% for AGIs $100k-200k, 5332.9% for AGIs over 200k)
Taxable individual retirement arrangement distribution: $13,959 (reported on 2.0% of returns)
90028:
$13,959
California:
$23,505
(% of AGI for various income ranges: 11.1% for AGIs below $25k, 22.8% for AGIs $25k-50k, 38.6% for AGIs $50k-75k, 80.7% for AGIs $75k-100k, 152.4% for AGIs $100k-200k, 782.9% for AGIs over 200k)
Self-employed (Keogh) retirement plans: $32,967 (reported on 0.4% of returns)
90028:
$32,967
California:
$30,163
(% of AGI for various income ranges: 89.1% for AGIs $75k-100k, 812.4% for AGIs over 200k)
Total itemized deductions: $36,688 (reported on 4.7% of returns)
Here:
$36,688
State:
$39,517
(% of AGI for various income ranges: 23.3% for AGIs below $25k, 66.9% for AGIs $25k-50k, 167.6% for AGIs $50k-75k, 400.6% for AGIs $75k-100k, 841.9% for AGIs $100k-200k, 8811.8% for AGIs over 200k)
Charity contributions: $8,992 (reported on 3.7% of returns)
Here:
$8,992
State:
$12,598
(% of AGI for various income ranges: 0.8% for AGIs below $25k, 12.3% for AGIs $25k-50k, 29.9% for AGIs $50k-75k, 58.7% for AGIs $75k-100k, 142.2% for AGIs $100k-200k, 1992.9% for AGIs over 200k)
Taxes paid: $8,015 (reported on 4.7% of returns)
90028:
$8,015
State:
$8,807
(% of AGI for various income ranges: 3.9% for AGIs below $25k, 12.6% for AGIs $25k-50k, 41.9% for AGIs $50k-75k, 126.3% for AGIs $75k-100k, 298.5% for AGIs $100k-200k, 1306.5% for AGIs over 200k)
Earned income credit: $967 (reported on 17.7% of returns)
Here:
$967
State:
$2,074
(% of AGI for various income ranges: 44.5% for AGIs below $25k, 29.9% for AGIs $25k-50k)
Percentage of individuals using paid preparers for their 2020 taxes: 92.8%
Here:
93%
State:
92%
(% for various income ranges: 91.1% for AGIs below $25k, 93.5% for AGIs $25k-50k, 94.5% for AGIs $50k-75k, 94.6% for AGIs $75k-100k, 94.2% for AGIs $100k-200k, 94.4% for AGIs over 200k)
Averages for the 2012 tax year for zip code 90028, filed in 2013:
Average Adjusted Gross Income (AGI) in 2012: $39,151 (Individual Income Tax Returns)
Here:
$39,151
State:
$72,726
Salary/wage: $35,257 (reported on 86.1% of returns)
Here:
$35,257
State:
$59,079
(% of AGI for various income ranges: 77.6% for AGIs below $25k, 89.3% for AGIs $25k-50k, 88.8% for AGIs $50k-75k, 87.3% for AGIs $75k-100k, 84.2% for AGIs $100k-200k, 41.7% for AGIs over 200k)
Taxable interest for individuals: $1,207 (reported on 16.3% of returns)
This zip code:
$1,207
California:
$2,146
(% of AGI for various income ranges: 0.4% for AGIs below $25k, 0.2% for AGIs $25k-50k, 0.5% for AGIs $50k-75k, 0.3% for AGIs $75k-100k, 1.0% for AGIs $100k-200k, 0.8% for AGIs over 200k)
Ordinary dividends: $4,093 (reported on 8.4% of returns)
Here:
$4,093
State:
$9,308
(% of AGI for various income ranges: 0.6% for AGIs below $25k, 0.4% for AGIs $25k-50k, 0.3% for AGIs $50k-75k, 0.4% for AGIs $75k-100k, 1.0% for AGIs $100k-200k, 2.4% for AGIs over 200k)
Net capital gain/loss in AGI: +$14,240 (reported on 7.5% of returns)
Here:
+$14,240
State:
+$30,460
(% of AGI for various income ranges: 0.2% for AGIs $25k-50k, 0.5% for AGIs $50k-75k, 1.0% for AGIs $75k-100k, 1.1% for AGIs $100k-200k, 12.6% for AGIs over 200k)
Profit/loss from business: +$9,228 (reported on 26.7% of returns)
Here:
+$9,228
State:
+$17,064
(% of AGI for various income ranges: 14.7% for AGIs below $25k, 5.1% for AGIs $25k-50k, 4.0% for AGIs $50k-75k, 3.0% for AGIs $75k-100k, 4.3% for AGIs $100k-200k, 5.8% for AGIs over 200k)
Taxable individual retirement arrangement distribution: $14,773 (reported on 2.2% of returns)
90028:
$14,773
California:
$19,557
(% of AGI for various income ranges: 0.6% for AGIs below $25k, 0.7% for AGIs $25k-50k, 0.8% for AGIs $50k-75k, 0.9% for AGIs $75k-100k, 1.1% for AGIs $100k-200k, 1.0% for AGIs over 200k)
Self-employment retirement plans: $21,800 (reported on 0.3% of returns)
90028:
$21,800
California:
$24,530
Total itemized deductions: $24,094 (24% of AGI, reported on 18.9% of returns)
Here:
$24,094
State:
$34,004
Here:
24.2% of AGI
State:
22.7% of AGI
(% of AGI for various income ranges: 6.0% for AGIs below $25k, 6.7% for AGIs $25k-50k, 10.3% for AGIs $50k-75k, 14.1% for AGIs $75k-100k, 17.0% for AGIs $100k-200k, 18.8% for AGIs over 200k)
Charity contributions: $2,738 (reported on 13.6% of returns)
Here:
$2,738
State:
$4,659
(% of AGI for various income ranges: 0.4% for AGIs below $25k, 0.6% for AGIs $25k-50k, 0.9% for AGIs $50k-75k, 2.2% for AGIs $75k-100k, 0.9% for AGIs $100k-200k, 1.2% for AGIs over 200k)
Taxes paid: $8,451 (reported on 18.7% of returns)
90028:
$8,451
State:
$14,448
(% of AGI for various income ranges: 0.8% for AGIs below $25k, 1.3% for AGIs $25k-50k, 2.7% for AGIs $50k-75k, 5.1% for AGIs $75k-100k, 7.7% for AGIs $100k-200k, 8.1% for AGIs over 200k)
Earned income credit: $1,306 (reported on 23.7% of returns)
Here:
$1,306
State:
$2,286
(% of AGI for various income ranges: 4.1% for AGIs below $25k, 0.5% for AGIs $25k-50k)
Percentage of individuals using paid preparers for their 2012 taxes: 59.2%
Here:
59%
State:
64%
(% for various income ranges: 57.3% for AGIs below $25k, 59.0% for AGIs $25k-50k, 58.9% for AGIs $50k-75k, 65.7% for AGIs $75k-100k, 68.8% for AGIs $100k-200k, 85.7% for AGIs over 200k)
Averages for the 2004 tax year for zip code 90028, filed in 2005:
Average Adjusted Gross Income (AGI) in 2004: $27,522 (Individual Income Tax Returns)
Here:
$27,522
State:
$58,600
Salary/wage: $26,842 (reported on 87.1% of returns)
Here:
$26,842
State:
$49,455
(% of AGI for various income ranges: 143.2% for AGIs below $10k, 87.8% for AGIs $10k-25k, 92.4% for AGIs $25k-50k, 90.6% for AGIs $50k-75k, 81.9% for AGIs $75k-100k, 53.1% for AGIs over 100k)
Taxable interest for individuals: $1,270 (reported on 20.7% of returns)
This zip code:
$1,270
California:
$2,365
(% of AGI for various income ranges: 2.9% for AGIs below $10k, 0.6% for AGIs $10k-25k, 0.5% for AGIs $25k-50k, 0.4% for AGIs $50k-75k, 1.5% for AGIs $75k-100k, 2.3% for AGIs over 100k)
Taxable dividends: $1,972 (reported on 8.4% of returns)
Here:
$1,972
State:
$4,746
(% of AGI for various income ranges: 2.0% for AGIs below $10k, 0.4% for AGIs $10k-25k, 0.3% for AGIs $25k-50k, 0.4% for AGIs $50k-75k, 1.3% for AGIs $75k-100k, 1.2% for AGIs over 100k)
Net capital gain/loss: +$7,998 (reported on 7.9% of returns)
Here:
+$7,998
State:
+$23,418
(% of AGI for various income ranges: -0.4% for AGIs below $10k, 0.1% for AGIs $10k-25k, 0.2% for AGIs $25k-50k, 0.5% for AGIs $50k-75k, 1.8% for AGIs $75k-100k, 11.7% for AGIs over 100k)
Profit/loss from business: +$5,789 (reported on 25.3% of returns)
Here:
+$5,789
State:
+$16,826
(% of AGI for various income ranges: 21.1% for AGIs below $10k, 7.8% for AGIs $10k-25k, 3.1% for AGIs $25k-50k, 3.2% for AGIs $50k-75k, 6.4% for AGIs $75k-100k, 5.8% for AGIs over 100k)
IRA payment deduction: $2,331 (reported on 2.1% of returns)
90028:
$2,331
California:
$3,192
(% of AGI for various income ranges: 0.4% for AGIs below $10k, 0.2% for AGIs $10k-25k, 0.2% for AGIs $25k-50k, 0.2% for AGIs $50k-75k, 0.2% for AGIs $75k-100k, 0.1% for AGIs over 100k)
Self-employed pension: $14,333 (reported on 0.3% of returns)
Here:
$14,333
California:
$17,688
Total itemized deductions: $18,062 (28% of AGI, reported on 17.6% of returns)
Here:
$18,062
State:
$28,113
Here:
28.5% of AGI
State:
25.3% of AGI
(% of AGI for various income ranges: 9.6% for AGIs below $10k, 5.9% for AGIs $10k-25k, 9.5% for AGIs $25k-50k, 13.0% for AGIs $50k-75k, 18.0% for AGIs $75k-100k, 19.1% for AGIs over 100k)
Charity contributions deductions: $2,393 (4% of AGI, reported on 13.9% of returns)
Here:
$2,393
State:
$3,923
Here:
3.7% of AGI
State:
3.3% of AGI
(% of AGI for various income ranges: 0.4% for AGIs below $10k, 0.5% for AGIs $10k-25k, 1.1% for AGIs $25k-50k, 1.4% for AGIs $50k-75k, 2.4% for AGIs $75k-100k, 1.7% for AGIs over 100k)
Total tax: $4,013 (reported on 74.1% of returns)
90028:
$4,013
State:
$10,761
(% of AGI for various income ranges: 7.8% for AGIs below $10k, 5.1% for AGIs $10k-25k, 8.3% for AGIs $25k-50k, 12.2% for AGIs $50k-75k, 14.1% for AGIs $75k-100k, 21.1% for AGIs over 100k)
Earned income credit: $1,391 (reported on 23.0% of returns)
Here:
$1,391
State:
$1,763
Percentage of individuals using paid preparers for their 2004 taxes: 64.4%
Here:
64%
State:
66%
(% for various income ranges: 60.7% for AGIs below $10k, 65.9% for AGIs $10k-25k, 62.6% for AGIs $25k-50k, 66.7% for AGIs $50k-75k, 75.4% for AGIs $75k-100k, 83.7% for AGIs over 100k)
Likely homosexual households (counted as self-reported same-sex unmarried-partner households)
Lesbian couples: 0.1% of all households
Gay men: 0.7% of all households
Household received Food Stamps/SNAP in the past 12 months: 3,164 Household did not receive Food Stamps/SNAP in the past 12 months: 14,564
Women who had a birth in the past 12 months: 47 (29 now married, 18 unmarried) Women who did not have a birth in the past 12 months: 8,494 (1,695 now married, 6,868 unmarried)
Housing units in zip code 90028 with a mortgage: 384 (55 second mortgage, 57 both second mortgage and home equity loan) Median monthly owner costs for units with a mortgage: $3,209 Median monthly owner costs for units without a mortgage: $825
Residents with income below the poverty level in 2022:
This zip code:
20.0%
Whole state:
12.2%
Residents with income below 50% of the poverty level in 2022:
This zip code:
9.4%
Whole state:
6.2%
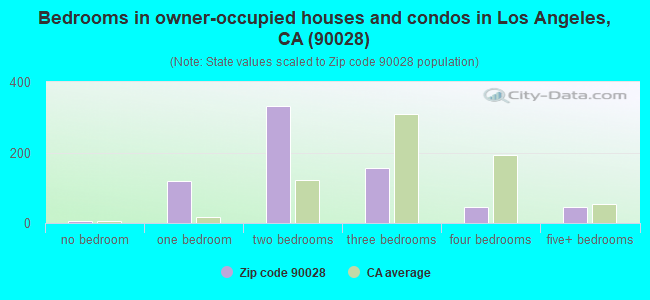
Median number of rooms in houses and condos:
Here:
4.8
State:
6.0
Median number of rooms in apartments:
Here:
2.5
State:
3.9
Notable locations in this zip code not listed on our city pages
Notable locations in zip code 90028: Larry King Square (A), Columbia Picture Studios (B), Goldwyn-Hollywood Regional Branch Los Angeles Public Library (C), Graumans Chinese Theatre (D), Columbia Square (E), Memorial Auditorium (F), Pacific Theatres Cinerama Dome (G), Hollywood Community Police Station (H), Pantages Theater (I), Stages Trilingual Theater (J), Henry Fonda Theater (K), James Doolittle Theater (L), Egyptian Theater (M), Hollywood History Museum (N), Pacific El Capitan Theater (O), Hollywood Entertainment Museum (P), City of Los Angeles Fire Department Station 82 (Q), City of Los Angeles Fire Department Station 27 (R). Display/hide their locations on the map
Churches in zip code 90028 include: First Baptist Church (A), Hollywood Christian Church (B), Country Church of Hollywood (C), First Presbyterian Church of Hollywood (D), First Southern Baptist Church (E), Saint Stephens Episcopal Church (F), Blessed Sacrament Church (G). Display/hide their locations on the map
Parks in zip code 90028 include: Las Palmas Playground (1), De Longpre Park (2), Rudolph Valentino Memorial (3), Hollywood Franklin Park (4). Display/hide their locations on the map
944 married couples with children.
937 single-parent households (246 men, 691 women).
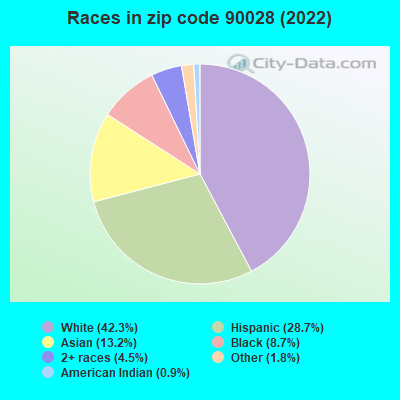
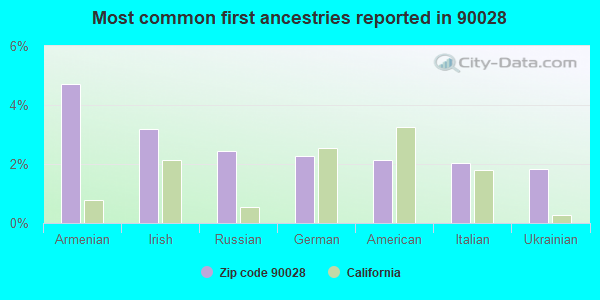
48.2% of residents of 90028 zip code speak English at home.
24.7% of residents speak Spanish at home (62% very well, 16% well, 19% not well, 3% not at all).
15.0% of residents speak other Indo-European language at home (42% very well, 23% well, 27% not well, 7% not at all).
10.6% of residents speak Asian or Pacific Island language at home (55% very well, 25% well, 13% not well, 7% not at all).
1.9% of residents speak other language at home (63% very well, 12% well, 15% not well, 11% not at all).
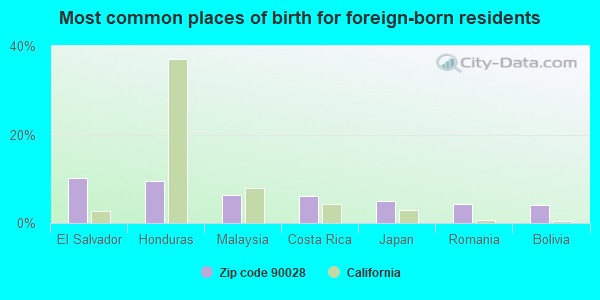
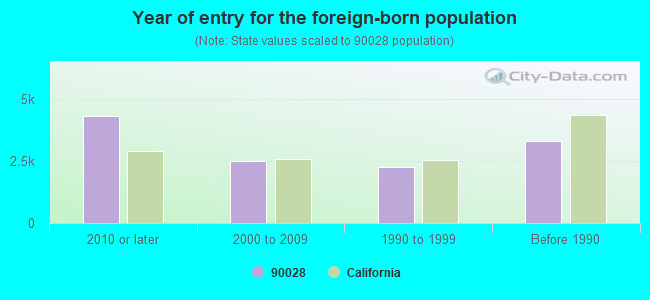
Foreign born population: 11,316 (36.8%) (49.5% of them are naturalized citizens)
Major facilities with environmental interests located in this zip code:
LAUSD HOLLYWOOD HIGH SCHOOL (1521 N HIGHLAND AVE in LOS ANGELES, CA)
STATE MASTER (California - Hazardous Waste Tracking) - HAZARDOU WASTE PROGRAM Large Quantity Generators, more that 1000 kg of hazardous waste/month (Resource Conservation and Recovery Act (tracking hazardous waste)) Alternative names: HOLLYWOOD SENIOR HIGH, LAUSD/ HOLLYWOOD HS
CENTRAL L A H S NO 1 (1309 WILTON PL in HOLLYWOOD, CA)
STATE MASTER (California - Hazardous Waste Tracking) - HAZARDOU WASTE PROGRAM Large Quantity Generators, more that 1000 kg of hazardous waste/month (Resource Conservation and Recovery Act (tracking hazardous waste)) - notification Organizations: L A UNIFIED SCHOOL DISTRICT (CONTACT/OWNER)
HOLLYWOOD NEW CONT H S NO 1 (5755 FOUNTAIN AVE in HOLLYWOOD, CA)
STATE MASTER (California - Hazardous Waste Tracking) - HAZARDOU WASTE PROGRAM Large Quantity Generators, more that 1000 kg of hazardous waste/month (Resource Conservation and Recovery Act (tracking hazardous waste)) - notification Organizations: L A UNIFIED SCHOOL DISTRICT (CONTACT/OWNER)
METROMEDIA TECHNOLOGIES INCORPORATED (1320 NORTH WILTON PLACE in LOS ANGELES, CA)
AIR MAJOR (AIRS/AFS) CRITERIA AND HAZARDOUS AIR POLLUTANT INVENTORY (Inventory of air pollution sources) AIR MAJOR ("Best Available" air pollution technologies tracking) HAZARDOUS WASTE BIENNIAL REPORTER (Resource Conservation and Recovery Act (tracking hazardous waste)) Large Quantity Generators, more that 1000 kg of hazardous waste/month (Resource Conservation and Recovery Act (tracking hazardous waste)) TRI REPORTER (Tracking of toxic chemicals releasing facilities) Business SIC and NAICS classification: COMMERCIAL PRINTING Organizations: METROMEDIA COMPANY (CONTACT/OWNER)
Alternative names: METROMEDIA TECHNOLOGIES - LOS ANGELES CA, METROMEDIA TECHNOLOGY
LA USD GRANT EL (1530 N WILTON PL in LOS ANGELES, CA)
STATE MASTER (California - Hazardous Waste Tracking) - HAZARDOU WASTE PROGRAM Small Quantity Generators, between 100 kg and 1000 kg of hazardous waste/month (Resource Conservation and Recovery Act (tracking hazardous waste)) - notification Alternative names: GRANT ELEMENTARY, LAUSD/GRANT ELEM
NETWORK AUTO BODY #2 (6161 HOLLYWOOD BLVD in LOS ANGELES, CA)
STATE MASTER (California - Hazardous Waste Tracking) - HAZARDOU WASTE PROGRAM CRITERIA AND HAZARDOUS AIR POLLUTANT INVENTORY (Inventory of air pollution sources) Small Quantity Generators, between 100 kg and 1000 kg of hazardous waste/month (Resource Conservation and Recovery Act (tracking hazardous waste)) Business SIC classification: TOP, BODY, AND UPHOLSTERY REPAIR SHOPS AND PAINT SHOPS Business NAICS classification: GENERAL AUTOMOTIVE REPAIR.; AUTOMOTIVE BODY, PAINT, AND INTERIOR REPAIR AND MAINTENANCE. Alternative names: NETWORK AUTO BODY INC
LOS ANGELES USD LE CONTE JUNIOR HG SCH (1316 N BRONSON AVE in HOLLYWOOD, CA)
STATE MASTER (California - Hazardous Waste Tracking) - HAZARDOU WASTE PROGRAM Small Quantity Generators, between 100 kg and 1000 kg of hazardous waste/month (Resource Conservation and Recovery Act (tracking hazardous waste)) - notification Organizations: LOS ANGELES UNIFIED SCHOOL DISTRICT (CONTACT/OWNER)
Alternative names: LAUSD/ LE CONTE JH
FOUR SEASONS CLEANERS (8042 SANTA MONICA BOULEVARD in HOLLYWOOD, CA)
STATE MASTER (California - Hazardous Waste Tracking) - HAZARDOU WASTE PROGRAM CRITERIA AND HAZARDOUS AIR POLLUTANT INVENTORY (Inventory of air pollution sources) Small Quantity Generators, between 100 kg and 1000 kg of hazardous waste/month (Resource Conservation and Recovery Act (tracking hazardous waste)) Business SIC classification: DRYCLEANING PLANTS, EXCEPT RUG CLEANING
LOS ANGELES USD CHEREMOYA ELEM SCHOOL (6017 FRANKLIN AVE in LOS ANGELES, CA)
STATE MASTER (California - Hazardous Waste Tracking) - HAZARDOU WASTE PROGRAM Small Quantity Generators, between 100 kg and 1000 kg of hazardous waste/month (Resource Conservation and Recovery Act (tracking hazardous waste)) - notification Organizations: LOS ANGELES UNIFIED SCHOOL DISTRICT (CONTACT/OWNER)
Alternative names: CHEREMOYA AVENUE ELEMENTARY, LAUSD/ CHEREMOYA AVE ELEM
LA HOLLYWOOD MUNI BUILDING (6501 FOUNTAIN AVE in HOLLYWOOD, CA)
STATE MASTER (California - Hazardous Waste Tracking) - HAZARDOU WASTE PROGRAM Small Quantity Generators, between 100 kg and 1000 kg of hazardous waste/month (Resource Conservation and Recovery Act (tracking hazardous waste)) - notification Organizations: CITY OF LOS ANGELES (CONTACT/OWNER)
Alternative names: CITY OF LA GENERAL SERVICES
MOVIE TOWN CLEANERS (6051 HOLLYWOOD BLVD #103 in HOLLYWOOD, CA)
STATE MASTER (California - Hazardous Waste Tracking) - HAZARDOU WASTE PROGRAM Small Quantity Generators, between 100 kg and 1000 kg of hazardous waste/month (Resource Conservation and Recovery Act (tracking hazardous waste)) - notification Organizations: HYUN BUM SHIN (CONTACT/OWNER)
EQUILON ENTERPRISES (6420 FRANKLIN in HOLLYWOOD, CA) . Federal Facility
STATE MASTER (California - Hazardous Waste Tracking) - HAZARDOU WASTE PROGRAM Small Quantity Generators, between 100 kg and 1000 kg of hazardous waste/month (Resource Conservation and Recovery Act (tracking hazardous waste)) - notification Organizations: EQUILON ENTERPRISES, LLC (CONTACT/OWNER)
Alternative names: SHELL OIL CO
EQUILON ENTERPRISES LLC (5657 SUNSET BLVD in LOS ANGELES, CA) . Federal Facility
STATE MASTER (California - Hazardous Waste Tracking) - HAZARDOU WASTE PROGRAM Small Quantity Generators, between 100 kg and 1000 kg of hazardous waste/month (Resource Conservation and Recovery Act (tracking hazardous waste)) - notification Organizations: EQUILON ENT LLC DBA SHELL OIL PRODS (CONTACT/OWNER)
Alternative names: SHELL OIL CO, SHELL SERVICE STATION
Housing units lacking complete plumbing facilities: 0.3% Housing units lacking complete kitchen facilities: 2.6%
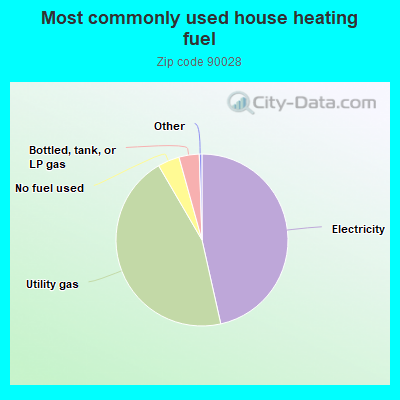
46.5%Electricity
45.1%Utility gas
4.1%No fuel used
3.8%Bottled, tank, or LP gas
Population in 1990: 30,152. Population change in the 1990s: +410 (+1.4%).
Place of birth for U.S.-born residents:
This state: 9,625
Northeast: 2,962
Midwest: 2,170
South: 2,573
West: 1,217
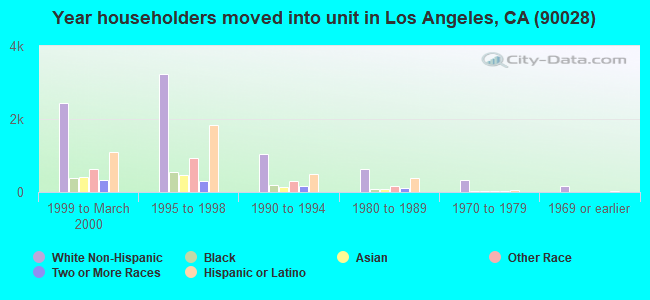
40% of the 90028 zip code residents lived in the same house 5 years ago. Out of people who lived in different houses, 72% lived in this county. Out of people who lived in different counties, 50% lived in California.
83% of the 90028 zip code residents lived in the same house 1 year ago. Out of people who lived in different houses, 64% moved from this county. Out of people who lived in different houses, 7% moved from different county within same state. Out of people who lived in different houses, 19% moved from different state. Out of people who lived in different houses, 9% moved from abroad.
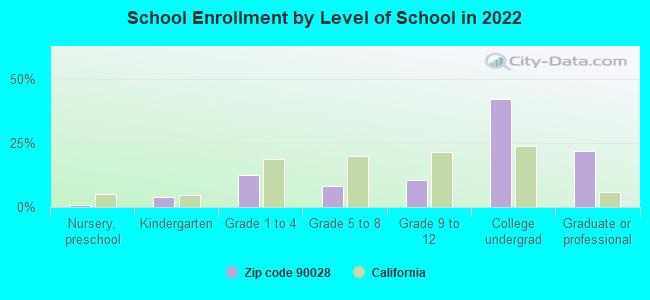
Private vs. public school enrollment:
Students in private schools in grades 1 to 8 (elementary and middle school): 80
Here:
8.0%
California:
10.5%
Students in private schools in grades 9 to 12 (high school): 24
Here:
4.8%
California:
8.5%
Students in private undergraduate colleges: 856
Here:
41.2%
California:
15.9%
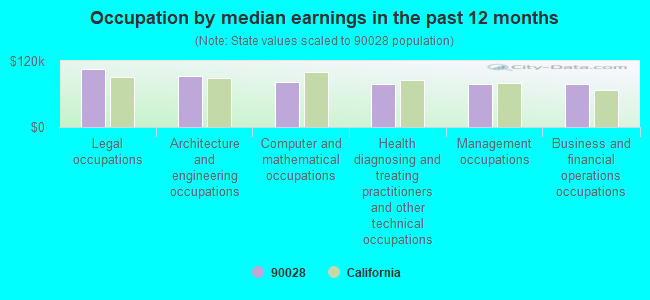
Occupation by median earnings in the past 12 months ($)
104,778Legal occupations
92,930Architecture and engineering occupations
81,107Computer and mathematical occupations
78,862Health diagnosing and treating practitioners and other technical occupations
78,459Management occupations
77,479Business and financial operations occupations
Companies with federal contracts located in this zip code (LOS ANGELES, CA):
AMETRON/AMERICAN ELECTRONIC SU (1546 ARGYLE AVE) : $7,935,808 in 164 contractsfrom 1999 to 2002
Contracts for Maintenance, Repair or Alteration of Real Property -- Miscellaneous Buildings by Navy Signed by year:2000: $3,980,591; 2001: $2,723,517; 2002: $263,458; 2003: $0; 2004: $0; 2005: $0; 2006: $0.
Biggest contracts:
$1,591,105 with Navy for Maintenance, Repair or Alteration of Real Property -- Miscellaneous Buildings. Taking place in VA. Signed on 2001-05-24. Completion date: 2001-11-05.
$428,827, same as above.Signed on 2000-10-01. Completion date: 2000-12-15.
$359,577, same as above.Signed on 1999-10-01. Completion date: 2000-06-27.
$349,923, same as above.Signed on 2000-10-01. Completion date: 2000-12-21.
TRIBUNE ENTERTAINMENT PRODUCTI (5800 SUNSET BOULEVARD BLDG) : $153,736 in 3 contractsfrom 2002 to 2004
$57,024 with Department of Defense for Miscellaneous Items. Signed on 2002-02-25. Completion date: 2002-06-01.
$49,324 with American Forces Information Service for Miscellaneous Items. Signed on 2004-11-17. Completion date: 2004-11-22.
$47,388 with Department of Defense for Other Photographic, Mapping, Printing, and Publication Services. Signed on 2003-05-13. Completion date: 2003-06-01.
ANIMACTION AMERICA INC (1680 VINE ST STE 920; small business)
$33,777 with Air Force for Educational Services. Taking place in TX. Signed on 2005-09-17. Completion date: 2006-08-30.
MS E INC (5800 SUNSET BLVD BDG 11 ST; small business)
$10,000 with Army for Other Social Services. Signed on 2005-08-18. Completion date: 2005-08-24.
IMAGIC (1545 WILCOX AVENUE; small business)
$3,850 with Army for Signs, Advertising Displays, and Identification Plates. Signed on 2004-09-20. Completion date: 2004-10-20.
DEEN & BLACK PUBLIC RELATIONS (12424 WILSHIRE BLVD; small business) : -$92,069 in 3 contractsin 2003
$0 with U.S. Army Corps of Engineers - civil program financing only for Public Relations Services(includes writing services, event planning and management, media relations, radio and television analysis, and press services). Taking place in WA. Signed on 2003-09-25. Completion date: 2002-02-04.
-$6,188, same as above.Signed on 2003-09-25. Completion date: 2002-02-04.
-$85,881 with U.S. Army Corps of Engineers - civil program financing only for Public Relations Services(includes writing services, event planning and management, media relations, radio and television analysis, and press services). Taking place in OR. Signed on 2003-06-18. Completion date: 2002-01-31.
Top industries in this zip code by the number of employees in 2005:
Administrative and Support and Waste Management and Remediation Services: Security Guards and Patrol Services (over 1000 employees: 2 establishments, 250-499 employees: 1 establishment, 50-99 employees: 1 establishment, 10-19 employees: 1 establishment, 1-4 employees: 1 establishment)
Other Services (except Public Administration): Religious Organizations (over 1000: 1, 250-499: 1, 100-249: 1, 20-49: 2, 10-19: 4, 5-9: 1, 1-4: 4)
2005 - 2018 National Fire Incident Reporting System (NFIRS) incidents
According to the data from the years 2005 - 2018 the average number of fires per year is 145. The highest number of reported fires - 218 took place in 2017, and the least - 68 in 2012. The data has an increasing trend.
When looking into fire subcategories, the most incidents belonged to: Structure Fires (47.1%), and Outside Fires (32.1%).
Fire incident types reported to NFIRS in Zip Code 90028


 Nearest zip codes: 90038, 90004, 90068, 90029, 90046, 90020.
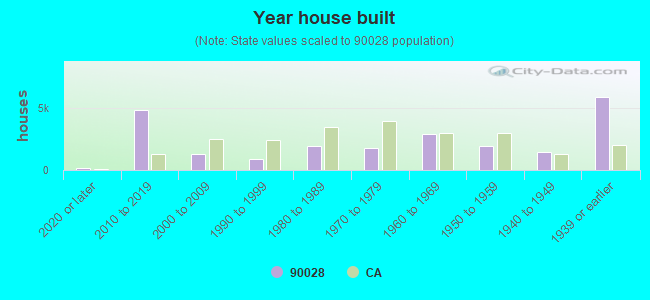


 According to the data from the years 2005 - 2018 the average number of fires per year is 145. The highest number of reported fires - 218 took place in 2017, and the least - 68 in 2012. The data has an increasing trend.
 When looking into fire subcategories, the most incidents belonged to: Structure Fires (47.1%), and Outside Fires (32.1%).