Estimated zip code population in 2022: 35,521 Zip code population in 2010: 35,482 Zip code population in 2000: 33,520
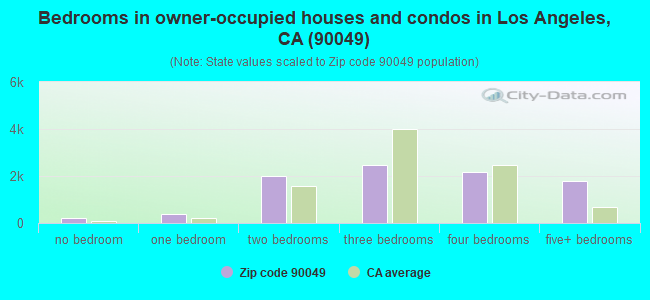
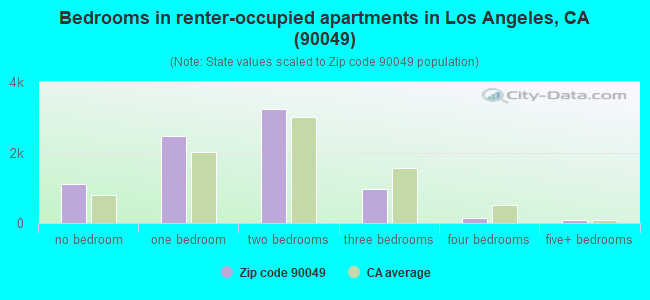
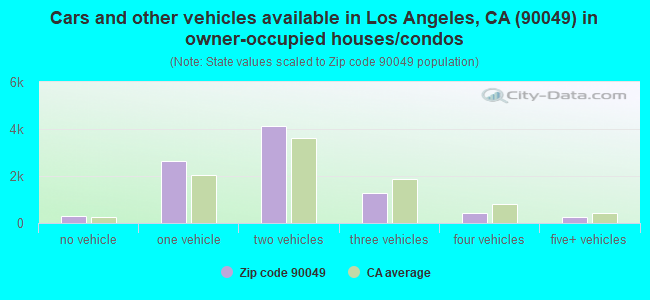
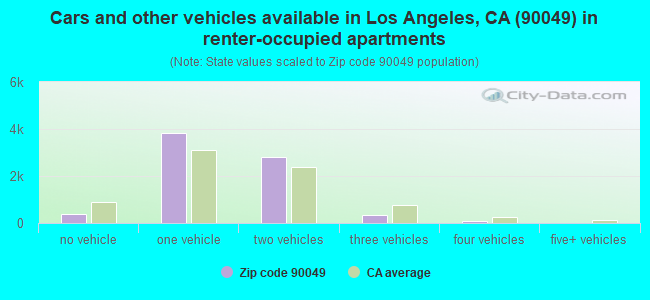
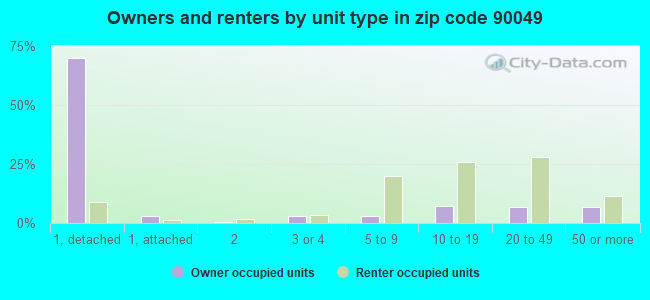
Houses and condos: 18,578 Renter-occupied apartments: 7,453
% of renters here:
45%
State:
44%
March 2022 cost of living index in zip code 90049: 145.3 (very high, U.S. average is 100)
Land area: 15.0 sq. mi. Water area: 0.0 sq. mi.
Population density: 2,365 people per square mile
(low).
OSM Map
General Map
Google Map
MSN Map
OSM Map
General Map
Google Map
MSN Map
OSM Map
General Map
Google Map
MSN Map
OSM Map
General Map
Google Map
MSN Map
Please wait while loading the map...
Real estate property taxes paid for housing units in 2022:
This zip code:
0.5% ($10,292)
California:
0.7% ($4,831)
Median real estate property taxes paid for housing units with mortgages in 2022: $10,330 (0.5%) Median real estate property taxes paid for housing units with no mortgage in 2022: $10,572 (0.5%)
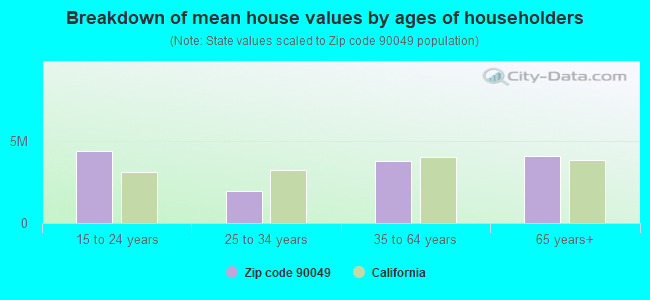
Estimated median house/condo value in 2022: $2,171,698
90049:
$2,171,698
California:
$715,900
According to our research of California and other state lists, there were 3 registered sex offenders living in 90049 zip code as of April 27, 2024. The ratio of all residents to sex offenders in zip code 90049 is 12,030 to 1. The ratio of registered sex offenders to all residents in this zip code is much lower than the state average.
Median resident age:
This zip code:
40.0 years
California median age:
37.9 years
Average household size:
This zip code:
2.1 people
California:
2.8 people
Averages for the 2020 tax year for zip code 90049, filed in 2021:
Average Adjusted Gross Income (AGI) in 2020: $433,042 (Individual Income Tax Returns)
Here:
$433,042
State:
$95,910
Salary/wage: $227,287 (reported on 70.3% of returns)
Here:
$227,287
State:
$77,331
(% of AGI for various income ranges: 1319.2% for AGIs below $25k, 4322.8% for AGIs $25k-50k, 7742.0% for AGIs $50k-75k, 12094.4% for AGIs $75k-100k, 22808.0% for AGIs $100k-200k, 258400.2% for AGIs over 200k)
Taxable interest for individuals: $22,887 (reported on 58.5% of returns)
This zip code:
$22,887
California:
$2,294
(% of AGI for various income ranges: 119.3% for AGIs below $25k, 178.3% for AGIs $25k-50k, 227.5% for AGIs $50k-75k, 325.6% for AGIs $75k-100k, 691.9% for AGIs $100k-200k, 24653.7% for AGIs over 200k)
Ordinary dividends: $50,864 (reported on 54.4% of returns)
Here:
$50,864
State:
$10,949
(% of AGI for various income ranges: 282.4% for AGIs below $25k, 367.3% for AGIs $25k-50k, 569.8% for AGIs $50k-75k, 847.8% for AGIs $75k-100k, 1974.0% for AGIs $100k-200k, 49816.4% for AGIs over 200k)
Net capital gain/loss in AGI: +$226,954 (reported on 53.0% of returns)
Here:
+$226,954
State:
+$49,306
(% of AGI for various income ranges: 172.2% for AGIs below $25k, 399.8% for AGIs $25k-50k, 464.8% for AGIs $50k-75k, 870.7% for AGIs $75k-100k, 2039.5% for AGIs $100k-200k, 233886.0% for AGIs over 200k)
Profit/loss from business: +$39,926 (reported on 26.3% of returns)
Here:
+$39,926
State:
+$15,671
(% of AGI for various income ranges: 334.7% for AGIs below $25k, 766.1% for AGIs $25k-50k, 738.8% for AGIs $50k-75k, 1064.9% for AGIs $75k-100k, 2004.7% for AGIs $100k-200k, 14809.9% for AGIs over 200k)
Taxable individual retirement arrangement distribution: $57,145 (reported on 9.5% of returns)
90049:
$57,145
California:
$23,505
(% of AGI for various income ranges: 42.8% for AGIs below $25k, 142.5% for AGIs $25k-50k, 264.1% for AGIs $50k-75k, 413.2% for AGIs $75k-100k, 1231.7% for AGIs $100k-200k, 8147.3% for AGIs over 200k)
Self-employed (Keogh) retirement plans: $40,585 (reported on 4.6% of returns)
90049:
$40,585
California:
$30,163
(% of AGI for various income ranges: 29.4% for AGIs $25k-50k, 28.3% for AGIs $50k-75k, 92.3% for AGIs $75k-100k, 184.6% for AGIs $100k-200k, 3289.7% for AGIs over 200k)
Total itemized deductions: $98,775 (reported on 34.1% of returns)
Here:
$98,775
State:
$39,517
(% of AGI for various income ranges: 540.4% for AGIs below $25k, 818.9% for AGIs $25k-50k, 1048.0% for AGIs $50k-75k, 1709.5% for AGIs $75k-100k, 3743.9% for AGIs $100k-200k, 57041.7% for AGIs over 200k)
Charity contributions: $61,096 (reported on 30.3% of returns)
Here:
$61,096
State:
$12,598
(% of AGI for various income ranges: 27.7% for AGIs below $25k, 80.6% for AGIs $25k-50k, 101.8% for AGIs $50k-75k, 211.9% for AGIs $75k-100k, 543.8% for AGIs $100k-200k, 35515.6% for AGIs over 200k)
Taxes paid: $9,320 (reported on 34.0% of returns)
90049:
$9,320
State:
$8,807
(% of AGI for various income ranges: 106.4% for AGIs below $25k, 159.4% for AGIs $25k-50k, 218.2% for AGIs $50k-75k, 376.8% for AGIs $75k-100k, 866.7% for AGIs $100k-200k, 4137.8% for AGIs over 200k)
Earned income credit: $1,010 (reported on 4.0% of returns)
Here:
$1,010
State:
$2,074
(% of AGI for various income ranges: 39.3% for AGIs below $25k, 16.9% for AGIs $25k-50k)
Percentage of individuals using paid preparers for their 2020 taxes: 93.7%
Here:
94%
State:
92%
(% for various income ranges: 90.8% for AGIs below $25k, 93.6% for AGIs $25k-50k, 93.8% for AGIs $50k-75k, 94.1% for AGIs $75k-100k, 93.8% for AGIs $100k-200k, 95.4% for AGIs over 200k)
Averages for the 2012 tax year for zip code 90049, filed in 2013:
Average Adjusted Gross Income (AGI) in 2012: $317,803 (Individual Income Tax Returns)
Here:
$317,803
State:
$72,726
Salary/wage: $172,194 (reported on 70.9% of returns)
Here:
$172,194
State:
$59,079
(% of AGI for various income ranges: 58.2% for AGIs below $25k, 71.0% for AGIs $25k-50k, 69.1% for AGIs $50k-75k, 67.5% for AGIs $75k-100k, 57.5% for AGIs $100k-200k, 34.2% for AGIs over 200k)
Taxable interest for individuals: $22,775 (reported on 60.7% of returns)
This zip code:
$22,775
California:
$2,146
(% of AGI for various income ranges: 5.3% for AGIs below $25k, 3.6% for AGIs $25k-50k, 2.0% for AGIs $50k-75k, 2.3% for AGIs $75k-100k, 2.5% for AGIs $100k-200k, 4.6% for AGIs over 200k)
Ordinary dividends: $42,793 (reported on 50.1% of returns)
Here:
$42,793
State:
$9,308
(% of AGI for various income ranges: 10.4% for AGIs below $25k, 4.2% for AGIs $25k-50k, 4.1% for AGIs $50k-75k, 4.8% for AGIs $75k-100k, 5.4% for AGIs $100k-200k, 7.0% for AGIs over 200k)
Net capital gain/loss in AGI: +$116,289 (reported on 48.3% of returns)
Here:
+$116,289
State:
+$30,460
(% of AGI for various income ranges: 1.6% for AGIs below $25k, 1.4% for AGIs $25k-50k, 1.5% for AGIs $50k-75k, 2.5% for AGIs $75k-100k, 2.6% for AGIs $100k-200k, 20.4% for AGIs over 200k)
Profit/loss from business: +$55,329 (reported on 26.7% of returns)
Here:
+$55,329
State:
+$17,064
(% of AGI for various income ranges: 19.7% for AGIs below $25k, 10.2% for AGIs $25k-50k, 6.2% for AGIs $50k-75k, 5.6% for AGIs $75k-100k, 6.7% for AGIs $100k-200k, 4.1% for AGIs over 200k)
Taxable individual retirement arrangement distribution: $50,767 (reported on 13.8% of returns)
90049:
$50,767
California:
$19,557
(% of AGI for various income ranges: 3.5% for AGIs below $25k, 2.6% for AGIs $25k-50k, 3.1% for AGIs $50k-75k, 2.9% for AGIs $75k-100k, 5.1% for AGIs $100k-200k, 1.9% for AGIs over 200k)
Self-employment retirement plans: $36,040 (reported on 4.7% of returns)
90049:
$36,040
California:
$24,530
(% of AGI for various income ranges: 0.4% for AGIs $25k-50k, 0.5% for AGIs $50k-75k, 0.3% for AGIs $75k-100k, 0.9% for AGIs $100k-200k, 0.5% for AGIs over 200k)
Total itemized deductions: $103,006 (21% of AGI, reported on 60.4% of returns)
Here:
$103,006
State:
$34,004
Here:
20.5% of AGI
State:
22.7% of AGI
(% of AGI for various income ranges: 35.6% for AGIs below $25k, 18.0% for AGIs $25k-50k, 18.6% for AGIs $50k-75k, 23.0% for AGIs $75k-100k, 23.9% for AGIs $100k-200k, 19.0% for AGIs over 200k)
Charity contributions: $23,616 (reported on 51.6% of returns)
Here:
$23,616
State:
$4,659
(% of AGI for various income ranges: 1.7% for AGIs below $25k, 1.4% for AGIs $25k-50k, 1.9% for AGIs $50k-75k, 1.9% for AGIs $75k-100k, 2.3% for AGIs $100k-200k, 4.1% for AGIs over 200k)
Taxes paid: $56,367 (reported on 60.2% of returns)
90049:
$56,367
State:
$14,448
(% of AGI for various income ranges: 9.6% for AGIs below $25k, 4.9% for AGIs $25k-50k, 5.4% for AGIs $50k-75k, 8.3% for AGIs $75k-100k, 10.0% for AGIs $100k-200k, 11.1% for AGIs over 200k)
Earned income credit: $889 (reported on 4.4% of returns)
Here:
$889
State:
$2,286
(% of AGI for various income ranges: 1.4% for AGIs below $25k, 0.1% for AGIs $25k-50k)
Percentage of individuals using paid preparers for their 2012 taxes: 73.2%
Here:
73%
State:
64%
(% for various income ranges: 67.7% for AGIs below $25k, 61.8% for AGIs $25k-50k, 63.4% for AGIs $50k-75k, 68.1% for AGIs $75k-100k, 76.9% for AGIs $100k-200k, 89.2% for AGIs over 200k)
Averages for the 2004 tax year for zip code 90049, filed in 2005:
Average Adjusted Gross Income (AGI) in 2004: $213,438 (Individual Income Tax Returns)
Here:
$213,438
State:
$58,600
Salary/wage: $146,502 (reported on 69.0% of returns)
Here:
$146,502
State:
$49,455
(% of AGI for various income ranges: 61.4% for AGIs $10k-25k, 72.3% for AGIs $25k-50k, 68.2% for AGIs $50k-75k, 62.7% for AGIs $75k-100k, 40.2% for AGIs over 100k)
Taxable interest for individuals: $26,420 (reported on 68.0% of returns)
This zip code:
$26,420
California:
$2,365
(% of AGI for various income ranges: 7.9% for AGIs $10k-25k, 3.7% for AGIs $25k-50k, 3.9% for AGIs $50k-75k, 4.3% for AGIs $75k-100k, 7.8% for AGIs over 100k)
Taxable dividends: $20,583 (reported on 55.2% of returns)
Here:
$20,583
State:
$4,746
(% of AGI for various income ranges: 6.8% for AGIs $10k-25k, 4.0% for AGIs $25k-50k, 4.0% for AGIs $50k-75k, 4.3% for AGIs $75k-100k, 4.7% for AGIs over 100k)
Net capital gain/loss: +$109,199 (reported on 52.6% of returns)
Here:
+$109,199
State:
+$23,418
(% of AGI for various income ranges: 2.1% for AGIs $10k-25k, 1.5% for AGIs $25k-50k, 1.9% for AGIs $50k-75k, 2.3% for AGIs $75k-100k, 26.7% for AGIs over 100k)
Profit/loss from business: +$36,593 (reported on 27.0% of returns)
Here:
+$36,593
State:
+$16,826
(% of AGI for various income ranges: 16.2% for AGIs $10k-25k, 8.0% for AGIs $25k-50k, 7.1% for AGIs $50k-75k, 6.8% for AGIs $75k-100k, 3.8% for AGIs over 100k)
IRA payment deduction: $3,607 (reported on 4.3% of returns)
90049:
$3,607
California:
$3,192
(% of AGI for various income ranges: 0.5% for AGIs $10k-25k, 0.4% for AGIs $25k-50k, 0.2% for AGIs $50k-75k, 0.2% for AGIs $75k-100k, 0.0% for AGIs over 100k)
Self-employed pension: $26,394 (reported on 5.2% of returns)
Here:
$26,394
California:
$17,688
(% of AGI for various income ranges: 0.7% for AGIs $10k-25k, 0.4% for AGIs $25k-50k, 0.6% for AGIs $50k-75k, 0.5% for AGIs $75k-100k, 0.6% for AGIs over 100k)
Total itemized deductions: $73,688 (19% of AGI, reported on 58.2% of returns)
Here:
$73,688
State:
$28,113
Here:
19.3% of AGI
State:
25.3% of AGI
(% of AGI for various income ranges: 29.1% for AGIs $10k-25k, 20.0% for AGIs $25k-50k, 23.4% for AGIs $50k-75k, 26.3% for AGIs $75k-100k, 17.6% for AGIs over 100k)
Charity contributions deductions: $16,571 (4% of AGI, reported on 52.9% of returns)
Here:
$16,571
State:
$3,923
Here:
4.0% of AGI
State:
3.3% of AGI
(% of AGI for various income ranges: 2.3% for AGIs $10k-25k, 2.0% for AGIs $25k-50k, 2.4% for AGIs $50k-75k, 2.9% for AGIs $75k-100k, 3.9% for AGIs over 100k)
Total tax: $64,201 (reported on 85.4% of returns)
90049:
$64,201
State:
$10,761
(% of AGI for various income ranges: 6.8% for AGIs $10k-25k, 9.8% for AGIs $25k-50k, 12.5% for AGIs $50k-75k, 13.2% for AGIs $75k-100k, 24.7% for AGIs over 100k)
Earned income credit: $750 (reported on 3.6% of returns)
Here:
$750
State:
$1,763
Percentage of individuals using paid preparers for their 2004 taxes: 75.6%
Here:
76%
State:
66%
(% for various income ranges: 74.1% for AGIs below $10k, 66.0% for AGIs $10k-25k, 65.8% for AGIs $25k-50k, 69.9% for AGIs $50k-75k, 75.2% for AGIs $75k-100k, 87.1% for AGIs over 100k)
Likely homosexual households (counted as self-reported same-sex unmarried-partner households)
Lesbian couples: 0.1% of all households
Gay men: 0.0% of all households
Household received Food Stamps/SNAP in the past 12 months: 283 Household did not receive Food Stamps/SNAP in the past 12 months: 15,766
Women who had a birth in the past 12 months: 430 (404 now married, 24 unmarried) Women who did not have a birth in the past 12 months: 8,926 (3,100 now married, 5,843 unmarried)
Housing units in zip code 90049 with a mortgage: 5,678 (618 second mortgage, 23 home equity loan, 507 both second mortgage and home equity loan) Houses without a mortgage: 120
Median monthly owner costs for units with a mortgage: $3,876 Median monthly owner costs for units without a mortgage: $1,556
Residents with income below the poverty level in 2022:
This zip code:
5.8%
Whole state:
12.2%
Residents with income below 50% of the poverty level in 2022:
This zip code:
2.3%
Whole state:
6.2%
Median number of rooms in houses and condos:
Here:
6.9
State:
6.0
Median number of rooms in apartments:
Here:
3.7
State:
3.9
Notable locations in this zip code not listed on our city pages
Notable locations in zip code 90049: United States Veterans Administration (A), Brentwood Country Club (B), Brentwood Branch Los Angeles Public Library (C), Rossiter Hall (D), Drudis-Biada Art Gallery And Fine Arts Building (E), Coe Memorial Library (F), Carondelet Hall (G), Brady Hall (H), City of Los Angeles Fire Department Station 109 (I), City of Los Angeles Fire Department Station 19 (J). Display/hide their locations on the map
Churches in zip code 90049 include: Mary Chapel (A), Village Church of Westwood (B), University Synagogue (C), Saint Martin of Tours Church (D), Leo Baeck Temple (E). Display/hide their locations on the map
Parks in zip code 90049 include: Jackie Robinson Stadium (1), Barrington Recreation Center (2), Crestwood Hills Park (3), Brentwood Park (4), Sulivan Canyon Park (5). Display/hide their locations on the map
4,762 married couples with children.
578 single-parent households (199 men, 379 women).
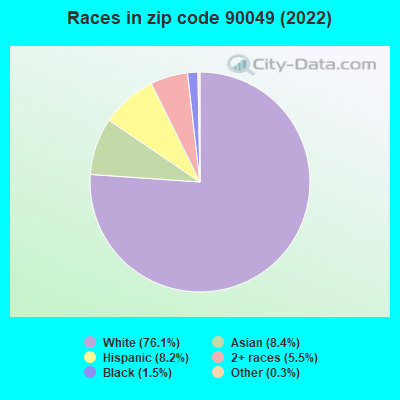
78.3% of residents of 90049 zip code speak English at home.
4.2% of residents speak Spanish at home (81% very well, 16% well, 3% not well).
12.9% of residents speak other Indo-European language at home (82% very well, 14% well, 4% not well).
3.7% of residents speak Asian or Pacific Island language at home (75% very well, 21% well, 4% not well).
1.2% of residents speak other language at home (97% very well, 3% well).
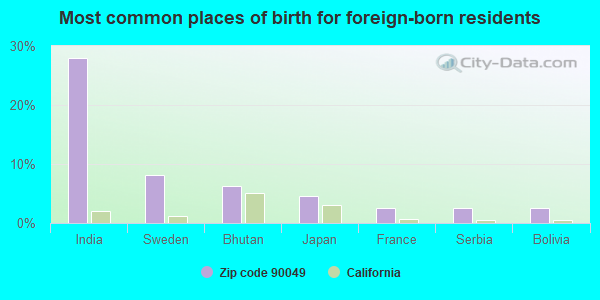
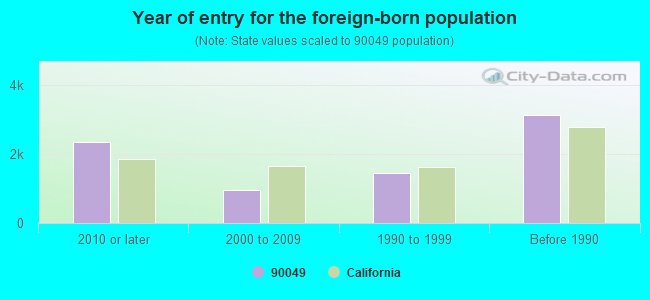
Foreign born population: 7,125 (20.1%) (70.6% of them are naturalized citizens)
Major facilities with environmental interests located in this zip code:
KENTER CANYON ELEMENTARY (CHAR) (645 N. KENTER AVE. in LOS ANGELES, CA)
(National Center for Education Statistics) - STATE ID-6017701 HAZARDOUS WASTE BIENNIAL REPORTER (Resource Conservation and Recovery Act (tracking hazardous waste)) Large Quantity Generators, more that 1000 kg of hazardous waste/month (Resource Conservation and Recovery Act (tracking hazardous waste)) Organizations: LOS ANGELES UNIFIED (SCHOOL DISTRICT)
Alternative names: LAUSD-KENTER CANYON ELEMENTARY
MARYMOUNT HIGH SCHOOL (10643 SUNSET BLVD in LOS ANGELES, CA)
STATE MASTER (California - Hazardous Waste Tracking) - HAZARDOU WASTE PROGRAM Large Quantity Generators, more that 1000 kg of hazardous waste/month (Resource Conservation and Recovery Act (tracking hazardous waste)) Organizations: SANDY SMITH (CONTACT/OPERATOR)
, RSHM (CONTACT/OWNER)
FLAIR CLEANERS (11702 SAN VICENTE BOULEVARD in LOS ANGELES, CA)
STATE MASTER (California - Hazardous Waste Tracking) - HAZARDOU WASTE PROGRAM CRITERIA AND HAZARDOUS AIR POLLUTANT INVENTORY (Inventory of air pollution sources) Small Quantity Generators, between 100 kg and 1000 kg of hazardous waste/month (Resource Conservation and Recovery Act (tracking hazardous waste)) - notification Business SIC classification: DRYCLEANING PLANTS, EXCEPT RUG CLEANING Organizations: FLAIR INC (CONTACT/OWNER)
Alternative names: FLAIR INC DBA FAZIO CLEANERS
MT ST MARYS COLLEGE (12001 CHALON RD in LOS ANGELES, CA)
STATE MASTER (California - Hazardous Waste Tracking) - HAZARDOU WASTE PROGRAM Small Quantity Generators, between 100 kg and 1000 kg of hazardous waste/month (Resource Conservation and Recovery Act (tracking hazardous waste)) - notification Organizations: SISTERS OF ST JOSEPH CARONDELET OF CA (CONTACT/OWNER)
CHEVRON STATION 9 9528 (670 N SEPULVEDA in LOS ANGELES, CA)
STATE MASTER (California - Hazardous Waste Tracking) - HAZARDOU WASTE PROGRAM Small Quantity Generators, between 100 kg and 1000 kg of hazardous waste/month (Resource Conservation and Recovery Act (tracking hazardous waste)) - notification Organizations: CHEVRON PRODUCTS CO (CONTACT/OWNER)
Alternative names: CHEVRON STATION NO 99528
CHEVRON STATION NO 93050 (110 S BARRINGTON AVE in LOS ANGELES, CA)
STATE MASTER (California - Hazardous Waste Tracking) - HAZARDOU WASTE PROGRAM Small Quantity Generators, between 100 kg and 1000 kg of hazardous waste/month (Resource Conservation and Recovery Act (tracking hazardous waste)) - notification Organizations: CHEVRON PRODUCTS CO (CONTACT/OWNER)
CHEVRON STATION NO 99623 (11852 SAN VICENTE BLVD in LOS ANGELES, CA)
STATE MASTER (California - Hazardous Waste Tracking) - HAZARDOU WASTE PROGRAM Small Quantity Generators, between 100 kg and 1000 kg of hazardous waste/month (Resource Conservation and Recovery Act (tracking hazardous waste)) - notification Organizations: CHEVRON PRODUCTS CO (CONTACT/OWNER)
LEGEND CLEANERS (641 N SEPULVEDA in LOS ANGELES, CA)
Small Quantity Generators, between 100 kg and 1000 kg of hazardous waste/month (Resource Conservation and Recovery Act (tracking hazardous waste)) - notification (Resource Conservation and Recovery Act (tracking hazardous waste)) Organizations: SAMIR OUEIDA (CONTACT/OWNER)
, BONG WOO LEE (CONTACT/OWNER)
GSF ENERGY LLC (1901 NORTH SEPULVEDA BOULEVARD in LOS ANGELES, CA)
CRITERIA AND HAZARDOUS AIR POLLUTANT INVENTORY (Inventory of air pollution sources) HAZARDOUS WASTE BIENNIAL REPORTER (Resource Conservation and Recovery Act (tracking hazardous waste)) Small Quantity Generators, between 100 kg and 1000 kg of hazardous waste/month (Resource Conservation and Recovery Act (tracking hazardous waste)) Business SIC classification: REFUSE SYSTEMS Organizations: SCS RENEWABLE ENERGY MOUNTAINGATE (CONTACT/OPERATOR)
, SCS RENVEWABLE ENERGY MOUNTAINGATE (CONTACT/OWNER)
Alternative names: GSF ENERGY INC, GSF ENERGY LIMITED LIABILITY COMPANY MOUNTAIN GATE FACILITY
LA BRENTWOOD LIBRARY (11820 SAN VICENTE BLVD in BRENTWOOD, CA)
Small Quantity Generators, between 100 kg and 1000 kg of hazardous waste/month (Resource Conservation and Recovery Act (tracking hazardous waste)) - notification Organizations: CITY OF LOS ANGELES (CONTACT/OWNER)
LA FIRE STATION 19 (12229 SUNSET BLVD in BRENTWOOD, CA)
Small Quantity Generators, between 100 kg and 1000 kg of hazardous waste/month (Resource Conservation and Recovery Act (tracking hazardous waste)) - notification Organizations: CITY OF LA (CONTACT/OWNER)
LA SAN VICENTE PEAK (17460 MULHOLLAND DR in LOS ANGELES, CA)
Small Quantity Generators, between 100 kg and 1000 kg of hazardous waste/month (Resource Conservation and Recovery Act (tracking hazardous waste)) - notification Organizations: CITY OF LOS ANGELES (CONTACT/OWNER)
LONG CLEANERS (142 S BARRINGTON PL in LOS ANGELES, CA)
Small Quantity Generators, between 100 kg and 1000 kg of hazardous waste/month (Resource Conservation and Recovery Act (tracking hazardous waste)) - notification Organizations: LEE JOUNG UOONG (CONTACT/OWNER)
Housing units lacking complete plumbing facilities: 0.8% Housing units lacking complete kitchen facilities: 1.7%
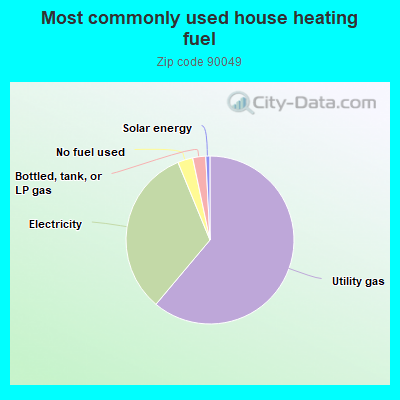
61.0%Utility gas
32.6%Electricity
2.9%No fuel used
2.5%Bottled, tank, or LP gas
0.8%Solar energy
Population in 1990: 35,507.
Place of birth for U.S.-born residents:
This state: 16,171
Northeast: 5,138
Midwest: 2,407
South: 2,422
West: 1,391
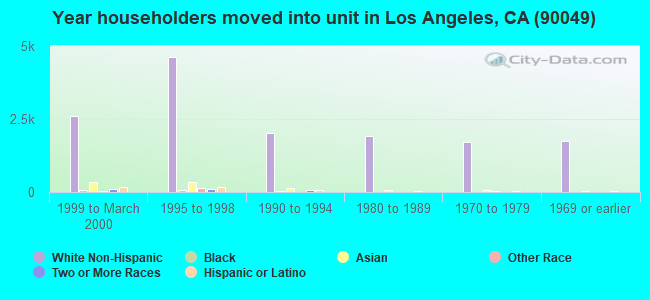
54% of the 90049 zip code residents lived in the same house 5 years ago. Out of people who lived in different houses, 67% lived in this county. Out of people who lived in different counties, 50% lived in California.
86% of the 90049 zip code residents lived in the same house 1 year ago. Out of people who lived in different houses, 62% moved from this county. Out of people who lived in different houses, 13% moved from different county within same state. Out of people who lived in different houses, 15% moved from different state. Out of people who lived in different houses, 8% moved from abroad.
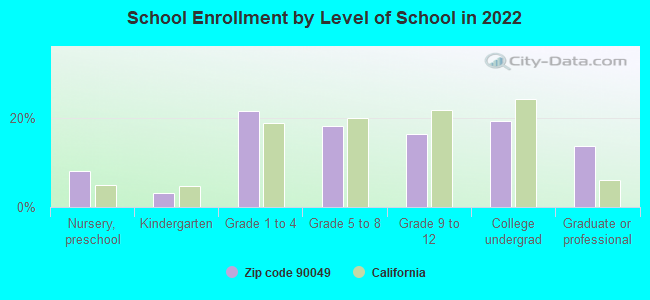
Private vs. public school enrollment:
Students in private schools in grades 1 to 8 (elementary and middle school): 1,529
Here:
51.4%
California:
10.5%
Students in private schools in grades 9 to 12 (high school): 694
Here:
58.7%
California:
8.5%
Students in private undergraduate colleges: 668
Here:
47.3%
California:
15.9%
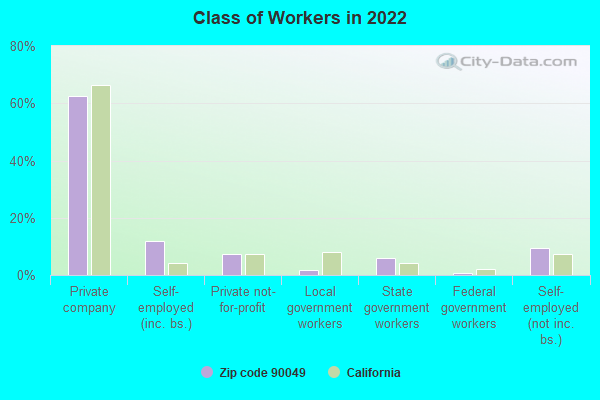
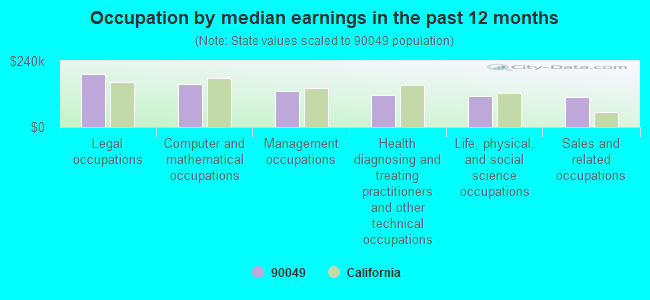
Occupation by median earnings in the past 12 months ($)
191,820Legal occupations
154,904Computer and mathematical occupations
130,774Management occupations
116,986Health diagnosing and treating practitioners and other technical occupations
110,979Life, physical, and social science occupations
110,503Sales and related occupations
Companies with biggest federal contracts located in this zip code:
BLACKSTONE CONSULTING INC (11726 SAN VICENTE BLVD STE in LOS ANGELES, CA; small business) : $45,952,001 in 463 contractsfrom 1999 to 2006
Contracts for Custodial Janitorial Services, Food Services, Other Professional Services, Gas Services, and moreby Army, Air Force, Defense Logistics Agency, Navy, and others Signed by year:2000: $5,695,169; 2001: $5,227,639; 2002: $10,294,558; 2003: $9,644,539; 2004: $6,280,698; 2005: $5,493,529; 2006: $2,100,592.
Biggest contracts:
$2,994,488 with Army for Custodial Janitorial Services. Taking place in IL. Signed on 2002-12-31. Completion date: 2004-09-30.
$2,185,557, same as above.Signed on 2001-10-22. Completion date: 2002-09-30.
$2,149,067 with Army for Food Services. Taking place in HI. Signed on 2003-10-10. Completion date: 2004-09-30.
$1,686,486 with Army for Custodial Janitorial Services. Taking place in IL. Signed on 2000-09-28. Completion date: 2001-09-30.
IRI COMPUTER COMMUNICATIONS CO (11950 SAN VICENTE BLVD in LOS ANGELES, CA; small business) : $1,586,944 in 10 contractsfrom 2000 to 2006
Contracts for Defense Electronics and Communication Equipment -- Basic Research (R&D), Other Defense -- Management and Support (R&D), Other Defense -- Operational Systems Development (R&D), Mathematical and Computer Sciences -- Basic Research (R&D), and moreby Navy, Army Signed by year:2000: $73,353; 2001: $144,591; 2002: $70,000; 2003: $330,000; 2004: $270,000; 2005: $449,000; 2006: $250,000.
Biggest contracts:
$350,000 with Navy for Defense Electronics and Communication Equipment -- Basic Research (R&D). Signed on 2005-10-21. Completion date: 2005-10-31.
$300,000 with Navy for Other Defense -- Management and Support (R&D). Signed on 2003-06-27. Completion date: 2004-12-27.
$250,000 with Navy for Defense Electronics and Communication Equipment -- Basic Research (R&D). Signed on 2006-05-24. Completion date: 2007-10-31.
$200,000 with Navy for Other Defense -- Operational Systems Development (R&D). Signed on 2004-08-30. Completion date: 2005-06-01.
SCANLAN KEMPER BARD ( in Los Angeles, CA; small business) : $1,381,794 in 68 contractsfrom 1999 to 2006
Contracts for Lease or Rental of Facilities -- Office Buildings by Public Buildings Service Signed by year:2000: $128,000; 2001: $128,000; 2002: $198,216; 2003: $431,812; 2004: $40,139; 2005: $141,931; 2006: $281,696.
Biggest contracts:
$45,336 with Public Buildings Service for Lease or Rental of Facilities -- Office Buildings. Taking place in NV. Signed on 2006-04-01. Completion date: 2006-09-30.
$45,336, same as above.Signed on 2006-07-01. Completion date: 2006-09-30.
$45,336, same as above.Signed on 2006-04-01. Completion date: 2006-09-30.
$45,336, same as above.Signed on 2006-04-01. Completion date: 2006-09-30.
ROBERT GOLD COMM SYSTEMS, INC (12251 RICHWOOD DRIVE in LOS ANGELES, CA; small business) : $626,177 in 2 contractsfrom 2001 to 2002
$348,467 with Air Force for Defense Electronics and Communication Equipment -- Management and Support (R&D). Signed on 2001-03-12. Completion date: 2003-03-19.
$277,710, same as above.Signed on 2002-08-26. Completion date: 2003-08-29.
SOLUTIONZ VIDEOCONFERENCING IN (901 BRINGHAM AVE in BRENTWOOD, CA; small business) : $369,737 in 23 contractsfrom 2002 to 2006
Contracts for Miscellaneous Electrical and Electronic Components, Video Recording and Reproducing Equipment, ADP Input/Output and Storage Devices, Miscellaneous Communication Equipment, and moreby Army, Federal Technology Service, Air Force, Public Buildings Service, and others Signed by year:2000: $0; 2001: $0; 2002: $15,436; 2003: $40,868; 2004: $144,774; 2005: $101,175; 2006: $67,484.
Biggest contracts:
$64,277 with Army for Miscellaneous Electrical and Electronic Components. Signed on 2004-09-23. Completion date: 2004-10-23.
$53,308 with Army for Video Recording and Reproducing Equipment. Taking place in NY. Signed on 2004-09-09. Completion date: 2004-10-05.
$50,485 with Federal Technology Service for ADP Input/Output and Storage Devices. Signed on 2005-02-03. Completion date: 2006-02-06.
$38,360 with Air Force for Miscellaneous Communication Equipment. Signed on 2002-05-24. Completion date: 2002-05-20.
INERT SYSTEMS LLC (291 LINDA FLORA DR in LOS ANGELES, CA; small business)
$248,342 with Air Force for Defense Electronics and Communication Equipment -- Management and Support (R&D). Signed on 1999-12-29. Completion date: 2001-06-14.
ADAMS INDUSTRIES, INC (711 LINDA FLORA DRIVE in LOS ANGELES, CA; small business) : $119,957 in 8 contractsfrom 2003 to 2006
Contracts for Headsets, Handsets, Microphones and Speakers, Electric Portable and Hand Lighting Equipment, Stimulated Coherent Radiation Devices, Components and Accessories, Optical Instruments, Test Equipment, Components and Accessories, and moreby Air Force, Navy, U.S. Special Operations Command Signed by year:2000: $0; 2001: $0; 2002: $0; 2003: $105,035; 2004: $0; 2005: $0; 2006: $14,922.
Biggest contracts:
$117,040 with Air Force for Headsets, Handsets, Microphones and Speakers. Signed on 2005-09-28. Completion date: 2005-10-28.
$33,376 with Air Force for Electric Portable and Hand Lighting Equipment. Signed on 2003-08-01. Completion date: 2003-08-01.
$32,037 with Air Force for Stimulated Coherent Radiation Devices, Components and Accessories. Signed on 2003-08-28. Completion date: 2003-10-19.
$26,899 with Air Force for Optical Instruments, Test Equipment, Components and Accessories. Signed on 2003-09-04. Completion date: 2003-10-03.
ROBERT GOLD ASSOCIATES (12251 RICHWOOD DRIVE in LOS ANGELES, CA; small business)
$99,565 with Air Force for Defense Electronics and Communication Equipment -- Management and Support (R&D). Signed on 2000-04-11. Completion date: 2001-01-18.
VISTALLER TECHNOLOGIES, INC (1231 NORMAN PL in LOS ANGELES, CA; small business)
$69,894 with Army for Other Defense -- Basic Research (R&D). Signed on 2006-02-13. Completion date: 2006-08-30.
MOUNT ST MARY'S COLLEGE (12001 CHALON RD in LOS ANGELES, CA) : $58,881 in 3 contractsin 2005
$22,761 with Air Force for Tuition, Registration, and Membership Fees. Signed on 2005-03-23. Completion date: 2005-09-30.
$22,330, same as above.Signed on 2005-08-17. Completion date: 2005-09-30.
$13,790, same as above.Signed on 2005-10-31. Completion date: 2005-10-31.
Top industries in this zip code by the number of employees in 2005:
2005 - 2018 National Fire Incident Reporting System (NFIRS) incidents
Based on the data from the years 2005 - 2018 the average number of fire incidents per year is 72. The highest number of fire incidents - 122 took place in 2005, and the least - 44 in 2012. The data has a dropping trend.
When looking into fire subcategories, the most reports belonged to: Structure Fires (43.6%), and Mobile Property/Vehicle Fires (33.3%).
Fire incident types reported to NFIRS in Zip Code 90049


 Nearest zip codes: 90077, 90073, 90095, 90272, 91436, 90402.


 Based on the data from the years 2005 - 2018 the average number of fire incidents per year is 72. The highest number of fire incidents - 122 took place in 2005, and the least - 44 in 2012. The data has a dropping trend.
 When looking into fire subcategories, the most reports belonged to: Structure Fires (43.6%), and Mobile Property/Vehicle Fires (33.3%).