Estimated zip code population in 2022: 16,055 Zip code population in 2010: 14,372 Zip code population in 2000: 13,109
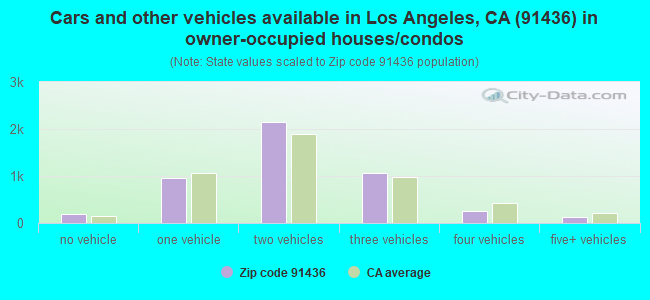
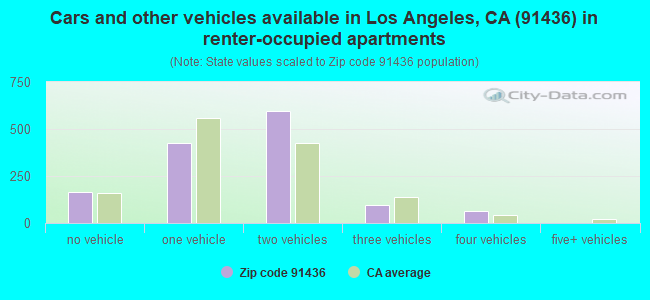
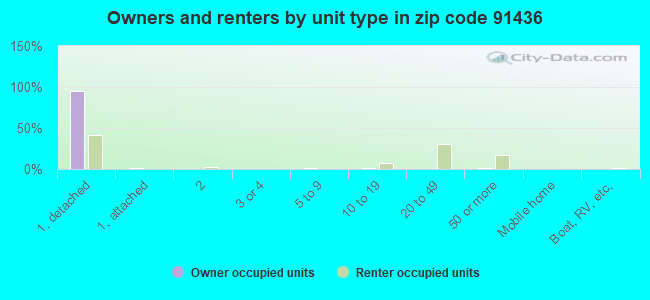
Houses and condos: 6,290 Renter-occupied apartments: 1,358
% of renters here:
22%
State:
44%
March 2022 cost of living index in zip code 91436: 144.5 (very high, U.S. average is 100)
Land area: 5.7 sq. mi. Water area: 0.1 sq. mi.
Population density: 2,819 people per square mile
(average).
OSM Map
General Map
Google Map
MSN Map
OSM Map
General Map
Google Map
MSN Map
OSM Map
General Map
Google Map
MSN Map
OSM Map
General Map
Google Map
MSN Map
Please wait while loading the map...
Real estate property taxes paid for housing units in 2022:
This zip code:
0.5% ($10,292)
California:
0.7% ($4,831)
Median real estate property taxes paid for housing units with mortgages in 2022: $10,330 (0.5%) Median real estate property taxes paid for housing units with no mortgage in 2022: $8,317 (0.5%)
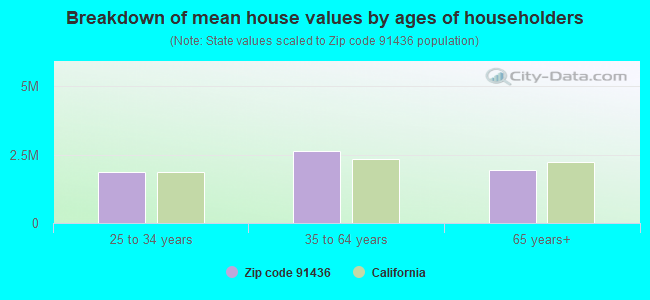
Estimated median house/condo value in 2022: $1,887,313
91436:
$1,887,313
California:
$715,900
According to our research of California and other state lists, there were 3 registered sex offenders living in 91436 zip code as of April 27, 2024. The ratio of all residents to sex offenders in zip code 91436 is 4,853 to 1. The ratio of registered sex offenders to all residents in this zip code is much lower than the state average.
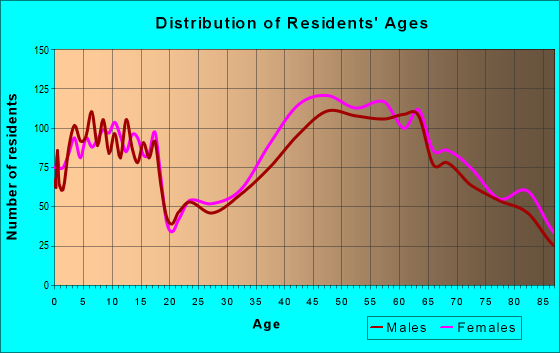
Median resident age:
This zip code:
47.8 years
California median age:
37.9 years
Average household size:
This zip code:
2.6 people
California:
2.8 people
Averages for the 2020 tax year for zip code 91436, filed in 2021:
Average Adjusted Gross Income (AGI) in 2020: $559,044 (Individual Income Tax Returns)
Here:
$559,044
State:
$95,910
Salary/wage: $316,107 (reported on 69.9% of returns)
Here:
$316,107
State:
$77,331
(% of AGI for various income ranges: 1727.7% for AGIs below $25k, 4328.4% for AGIs $25k-50k, 8260.0% for AGIs $50k-75k, 12863.6% for AGIs $75k-100k, 24258.9% for AGIs $100k-200k, 304172.6% for AGIs over 200k)
Taxable interest for individuals: $14,244 (reported on 65.7% of returns)
This zip code:
$14,244
California:
$2,294
(% of AGI for various income ranges: 106.1% for AGIs below $25k, 295.5% for AGIs $25k-50k, 479.4% for AGIs $50k-75k, 448.6% for AGIs $75k-100k, 1176.1% for AGIs $100k-200k, 12623.3% for AGIs over 200k)
Ordinary dividends: $47,119 (reported on 55.9% of returns)
Here:
$47,119
State:
$10,949
(% of AGI for various income ranges: 356.0% for AGIs below $25k, 486.6% for AGIs $25k-50k, 896.6% for AGIs $50k-75k, 1331.4% for AGIs $75k-100k, 2637.6% for AGIs $100k-200k, 36437.4% for AGIs over 200k)
Net capital gain/loss in AGI: +$235,477 (reported on 55.5% of returns)
Here:
+$235,477
State:
+$49,306
(% of AGI for various income ranges: 237.7% for AGIs below $25k, 391.6% for AGIs $25k-50k, 872.8% for AGIs $50k-75k, 982.3% for AGIs $75k-100k, 2748.9% for AGIs $100k-200k, 195395.2% for AGIs over 200k)
Profit/loss from business: +$87,625 (reported on 29.7% of returns)
Here:
+$87,625
State:
+$15,671
(% of AGI for various income ranges: 425.3% for AGIs below $25k, 829.3% for AGIs $25k-50k, 1123.8% for AGIs $50k-75k, 1932.7% for AGIs $75k-100k, 3619.1% for AGIs $100k-200k, 34600.3% for AGIs over 200k)
Taxable individual retirement arrangement distribution: $43,013 (reported on 10.6% of returns)
91436:
$43,013
California:
$23,505
(% of AGI for various income ranges: 112.7% for AGIs below $25k, 218.6% for AGIs $25k-50k, 441.2% for AGIs $50k-75k, 1070.9% for AGIs $75k-100k, 1642.2% for AGIs $100k-200k, 4782.0% for AGIs over 200k)
Self-employed (Keogh) retirement plans: $38,348 (reported on 5.2% of returns)
91436:
$38,348
California:
$30,163
(% of AGI for various income ranges: 160.0% for AGIs $50k-75k, 432.6% for AGIs $100k-200k, 2607.4% for AGIs over 200k)
Total itemized deductions: $88,203 (reported on 43.8% of returns)
Here:
$88,203
State:
$39,517
(% of AGI for various income ranges: 761.3% for AGIs below $25k, 1365.0% for AGIs $25k-50k, 2283.8% for AGIs $50k-75k, 3652.7% for AGIs $75k-100k, 6385.2% for AGIs $100k-200k, 49616.9% for AGIs over 200k)
Charity contributions: $52,658 (reported on 38.1% of returns)
Here:
$52,658
State:
$12,598
(% of AGI for various income ranges: 28.7% for AGIs below $25k, 106.4% for AGIs $25k-50k, 236.9% for AGIs $50k-75k, 324.5% for AGIs $75k-100k, 831.3% for AGIs $100k-200k, 29584.9% for AGIs over 200k)
Taxes paid: $9,464 (reported on 43.5% of returns)
91436:
$9,464
State:
$8,807
(% of AGI for various income ranges: 191.8% for AGIs below $25k, 276.4% for AGIs $25k-50k, 488.1% for AGIs $50k-75k, 779.5% for AGIs $75k-100k, 1538.5% for AGIs $100k-200k, 4176.4% for AGIs over 200k)
Earned income credit: $1,147 (reported on 3.9% of returns)
Here:
$1,147
State:
$2,074
(% of AGI for various income ranges: 45.2% for AGIs below $25k, 30.2% for AGIs $25k-50k)
Percentage of individuals using paid preparers for their 2020 taxes: 94.0%
Here:
94%
State:
92%
(% for various income ranges: 91.2% for AGIs below $25k, 93.9% for AGIs $25k-50k, 92.4% for AGIs $50k-75k, 95.2% for AGIs $75k-100k, 94.9% for AGIs $100k-200k, 95.1% for AGIs over 200k)
Averages for the 2012 tax year for zip code 91436, filed in 2013:
Average Adjusted Gross Income (AGI) in 2012: $412,030 (Individual Income Tax Returns)
Here:
$412,030
State:
$72,726
Salary/wage: $280,480 (reported on 70.5% of returns)
Here:
$280,480
State:
$59,079
(% of AGI for various income ranges: 57.4% for AGIs below $25k, 55.8% for AGIs $25k-50k, 52.7% for AGIs $50k-75k, 49.9% for AGIs $75k-100k, 50.4% for AGIs $100k-200k, 47.5% for AGIs over 200k)
Taxable interest for individuals: $12,732 (reported on 66.2% of returns)
This zip code:
$12,732
California:
$2,146
(% of AGI for various income ranges: 5.0% for AGIs below $25k, 3.0% for AGIs $25k-50k, 3.3% for AGIs $50k-75k, 3.1% for AGIs $75k-100k, 2.3% for AGIs $100k-200k, 2.0% for AGIs over 200k)
Ordinary dividends: $31,145 (reported on 53.1% of returns)
Here:
$31,145
State:
$9,308
(% of AGI for various income ranges: 8.7% for AGIs below $25k, 5.0% for AGIs $25k-50k, 4.4% for AGIs $50k-75k, 4.1% for AGIs $75k-100k, 4.6% for AGIs $100k-200k, 3.9% for AGIs over 200k)
Net capital gain/loss in AGI: +$120,165 (reported on 51.5% of returns)
Here:
+$120,165
State:
+$30,460
(% of AGI for various income ranges: 0.7% for AGIs below $25k, 0.5% for AGIs $25k-50k, 1.4% for AGIs $50k-75k, 2.7% for AGIs $75k-100k, 2.2% for AGIs $100k-200k, 16.6% for AGIs over 200k)
Profit/loss from business: +$60,876 (reported on 30.8% of returns)
Here:
+$60,876
State:
+$17,064
(% of AGI for various income ranges: 21.5% for AGIs below $25k, 14.6% for AGIs $25k-50k, 12.2% for AGIs $50k-75k, 11.8% for AGIs $75k-100k, 9.7% for AGIs $100k-200k, 3.7% for AGIs over 200k)
Taxable individual retirement arrangement distribution: $45,220 (reported on 15.5% of returns)
91436:
$45,220
California:
$19,557
(% of AGI for various income ranges: 5.1% for AGIs below $25k, 4.0% for AGIs $25k-50k, 4.8% for AGIs $50k-75k, 4.6% for AGIs $75k-100k, 5.6% for AGIs $100k-200k, 1.3% for AGIs over 200k)
Self-employment retirement plans: $32,032 (reported on 5.4% of returns)
91436:
$32,032
California:
$24,530
(% of AGI for various income ranges: 1.2% for AGIs $50k-75k, 0.8% for AGIs $75k-100k, 0.8% for AGIs $100k-200k, 0.4% for AGIs over 200k)
Total itemized deductions: $120,284 (20% of AGI, reported on 67.2% of returns)
Here:
$120,284
State:
$34,004
Here:
20.2% of AGI
State:
22.7% of AGI
(% of AGI for various income ranges: 41.9% for AGIs below $25k, 29.9% for AGIs $25k-50k, 28.8% for AGIs $50k-75k, 28.7% for AGIs $75k-100k, 26.6% for AGIs $100k-200k, 18.6% for AGIs over 200k)
Charity contributions: $20,036 (reported on 58.0% of returns)
Here:
$20,036
State:
$4,659
(% of AGI for various income ranges: 1.7% for AGIs below $25k, 1.9% for AGIs $25k-50k, 2.0% for AGIs $50k-75k, 2.4% for AGIs $75k-100k, 2.3% for AGIs $100k-200k, 2.9% for AGIs over 200k)
Taxes paid: $67,341 (reported on 66.8% of returns)
91436:
$67,341
State:
$14,448
(% of AGI for various income ranges: 9.6% for AGIs below $25k, 7.6% for AGIs $25k-50k, 8.0% for AGIs $50k-75k, 9.3% for AGIs $75k-100k, 10.1% for AGIs $100k-200k, 11.1% for AGIs over 200k)
Earned income credit: $1,134 (reported on 4.8% of returns)
Here:
$1,134
State:
$2,286
(% of AGI for various income ranges: 1.8% for AGIs below $25k, 0.3% for AGIs $25k-50k)
Percentage of individuals using paid preparers for their 2012 taxes: 84.2%
Here:
84%
State:
64%
(% for various income ranges: 78.2% for AGIs below $25k, 78.8% for AGIs $25k-50k, 81.0% for AGIs $50k-75k, 82.6% for AGIs $75k-100k, 85.2% for AGIs $100k-200k, 91.5% for AGIs over 200k)
Averages for the 2004 tax year for zip code 91436, filed in 2005:
Average Adjusted Gross Income (AGI) in 2004: $277,413 (Individual Income Tax Returns)
Here:
$277,413
State:
$58,600
Salary/wage: $222,502 (reported on 66.4% of returns)
Here:
$222,502
State:
$49,455
(% of AGI for various income ranges: 50.6% for AGIs $10k-25k, 53.7% for AGIs $25k-50k, 49.7% for AGIs $50k-75k, 48.6% for AGIs $75k-100k, 51.8% for AGIs over 100k)
Taxable interest for individuals: $11,571 (reported on 74.9% of returns)
This zip code:
$11,571
California:
$2,365
(% of AGI for various income ranges: 9.1% for AGIs $10k-25k, 6.3% for AGIs $25k-50k, 5.3% for AGIs $50k-75k, 4.5% for AGIs $75k-100k, 2.8% for AGIs over 100k)
Taxable dividends: $13,231 (reported on 60.7% of returns)
Here:
$13,231
State:
$4,746
(% of AGI for various income ranges: 6.6% for AGIs $10k-25k, 4.6% for AGIs $25k-50k, 4.7% for AGIs $50k-75k, 3.8% for AGIs $75k-100k, 2.6% for AGIs over 100k)
Net capital gain/loss: +$55,597 (reported on 57.0% of returns)
Here:
+$55,597
State:
+$23,418
(% of AGI for various income ranges: 0.9% for AGIs $10k-25k, 0.8% for AGIs $25k-50k, 3.8% for AGIs $50k-75k, 2.1% for AGIs $75k-100k, 11.6% for AGIs over 100k)
Profit/loss from business: +$42,993 (reported on 29.2% of returns)
Here:
+$42,993
State:
+$16,826
(% of AGI for various income ranges: 16.7% for AGIs $10k-25k, 13.4% for AGIs $25k-50k, 12.6% for AGIs $50k-75k, 11.0% for AGIs $75k-100k, 3.8% for AGIs over 100k)
IRA payment deduction: $4,045 (reported on 4.3% of returns)
91436:
$4,045
California:
$3,192
(% of AGI for various income ranges: 0.4% for AGIs $10k-25k, 0.4% for AGIs $25k-50k, 0.4% for AGIs $50k-75k, 0.3% for AGIs $75k-100k, 0.0% for AGIs over 100k)
Self-employed pension: $27,335 (reported on 6.3% of returns)
Here:
$27,335
California:
$17,688
(% of AGI for various income ranges: 0.5% for AGIs $25k-50k, 0.8% for AGIs $50k-75k, 1.4% for AGIs $75k-100k, 0.6% for AGIs over 100k)
Total itemized deductions: $73,686 (17% of AGI, reported on 64.8% of returns)
Here:
$73,686
State:
$28,113
Here:
17.3% of AGI
State:
25.3% of AGI
(% of AGI for various income ranges: 41.5% for AGIs $10k-25k, 30.6% for AGIs $25k-50k, 31.5% for AGIs $50k-75k, 30.5% for AGIs $75k-100k, 15.7% for AGIs over 100k)
Charity contributions deductions: $13,487 (3% of AGI, reported on 58.7% of returns)
Here:
$13,487
State:
$3,923
Here:
3.0% of AGI
State:
3.3% of AGI
(% of AGI for various income ranges: 2.4% for AGIs $10k-25k, 2.2% for AGIs $25k-50k, 2.9% for AGIs $50k-75k, 3.1% for AGIs $75k-100k, 2.8% for AGIs over 100k)
Total tax: $81,813 (reported on 83.5% of returns)
91436:
$81,813
State:
$10,761
(% of AGI for various income ranges: 6.7% for AGIs $10k-25k, 9.1% for AGIs $25k-50k, 10.6% for AGIs $50k-75k, 11.5% for AGIs $75k-100k, 25.0% for AGIs over 100k)
Earned income credit: $943 (reported on 4.0% of returns)
Here:
$943
State:
$1,763
Percentage of individuals using paid preparers for their 2004 taxes: 85.3%
Here:
85%
State:
66%
(% for various income ranges: 81.0% for AGIs below $10k, 78.6% for AGIs $10k-25k, 79.5% for AGIs $25k-50k, 85.8% for AGIs $50k-75k, 86.2% for AGIs $75k-100k, 90.4% for AGIs over 100k)
Likely homosexual households (counted as self-reported same-sex unmarried-partner households)
Lesbian couples: 0.0% of all households
Gay men: 0.3% of all households
Household received Food Stamps/SNAP in the past 12 months: 250 Household did not receive Food Stamps/SNAP in the past 12 months: 5,708
Women who had a birth in the past 12 months: 170 (169 now married, 0 unmarried) Women who did not have a birth in the past 12 months: 3,062 (1,423 now married, 1,629 unmarried)
Housing units in zip code 91436 with a mortgage: 3,204 (639 second mortgage, 634 both second mortgage and home equity loan) Houses without a mortgage: 12
Median monthly owner costs for units with a mortgage: $3,876 Median monthly owner costs for units without a mortgage: $1,556
Residents with income below the poverty level in 2022:
This zip code:
6.6%
Whole state:
12.2%
Residents with income below 50% of the poverty level in 2022:
This zip code:
2.8%
Whole state:
6.2%
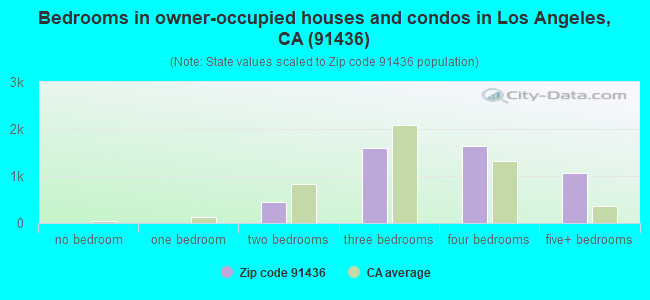
Median number of rooms in houses and condos:
Here:
7.3
State:
6.0
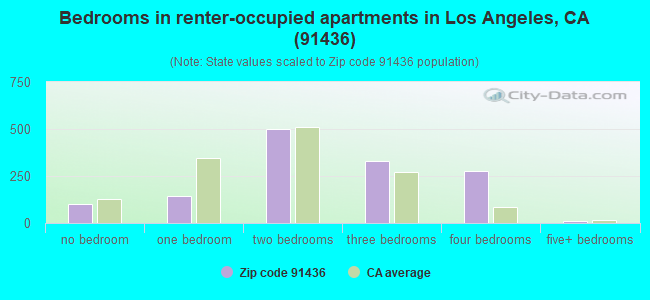
Median number of rooms in apartments:
Here:
4.5
State:
3.9
Notable locations in this zip code not listed on our city pages
Notable locations in zip code 91436: Encino Municipal Golf Course (A), Balboa Municipal Golf Course (B), City of Los Angeles Fire Department Station 83 (C). Display/hide their locations on the map
2,713 married couples with children.
355 single-parent households (55 men, 300 women).
67.8% of residents of 91436 zip code speak English at home.
6.1% of residents speak Spanish at home (73% very well, 13% well, 14% not well).
20.4% of residents speak other Indo-European language at home (63% very well, 27% well, 7% not well, 3% not at all).
2.6% of residents speak Asian or Pacific Island language at home (69% very well, 22% well, 8% not well, 1% not at all).
4.0% of residents speak other language at home (98% very well, 2% well).
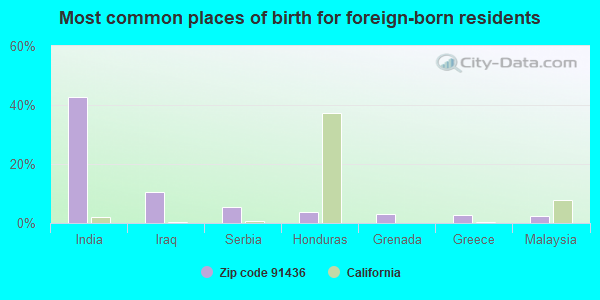
Foreign born population: 3,982 (24.8%) (79.1% of them are naturalized citizens)
This zip code:
24.8%
Whole state:
26.7%
43%India
11%Iraq
5%Serbia
4%Honduras
3%Grenada
3%Greece
3%Malaysia
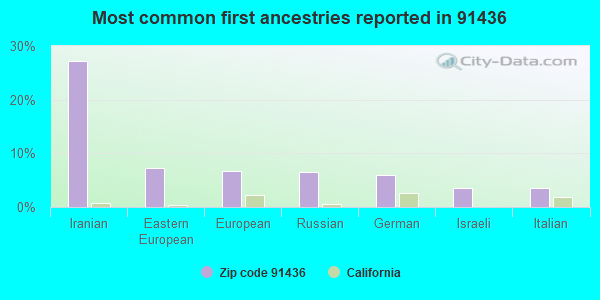
27%Iranian
7%Eastern European
7%European
6%Russian
6%German
4%Israeli
4%Italian
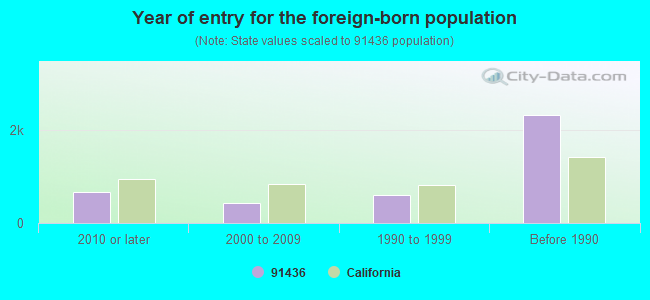
Year of entry for the foreign-born population
6652010 or later
4352000 to 2009
6111990 to 1999
2,330Before 1990
Facilities with environmental interests located in this zip code:
ENCINO HOSPITAL (16237 VENTURA BLVD in ENCINO, CA)
STATE MASTER (California - Hazardous Waste Tracking) - HAZARDOU WASTE PROGRAM Small Quantity Generators, between 100 kg and 1000 kg of hazardous waste/month (Resource Conservation and Recovery Act (tracking hazardous waste)) Alternative names: ENCINO-TARZANA REGIONAL MEDICAL CENTER
LOS ANGELES KNEE AND SPORTS (16030 VENTURA BLVD 100 in ENCINO, CA)
STATE MASTER (California - Hazardous Waste Tracking) - HAZARDOU WASTE PROGRAM Small Quantity Generators, between 100 kg and 1000 kg of hazardous waste/month (Resource Conservation and Recovery Act (tracking hazardous waste)) - notification Organizations: MICHAEL SHAPIRO M D (CONTACT/OWNER)
Alternative names: L A KNEE AND SPORTS MEDICINE CLINIC
LANAI ROAD ELEMENTARY (4241 LANAI ROAD in ENCINO, CA)
(National Center for Education Statistics) - STATE ID-6017768 Organizations: LOS ANGELES UNIFIED (SCHOOL DISTRICT)
HASKELL STA (4722 HASKELL AVE in ENCINO, CA)
Large Quantity Generators, more that 1000 kg of hazardous waste/month (Resource Conservation and Recovery Act (tracking hazardous waste)) Organizations: SOUTHERN CALIFORNIA GAS CO. (CONTACT/OPERATOR)
LANDS S CLEANERS (16573 VENTURA BLVD in ENCINO, CA)
Small Quantity Generators, between 100 kg and 1000 kg of hazardous waste/month (Resource Conservation and Recovery Act (tracking hazardous waste)) Organizations: SHIRLEY COLTEN (CONTACT/OWNER)
LIBBIT AUTOMOTIVE INC (16306 VENTURA BLVD in ENCINO, CA)
Small Quantity Generators, between 100 kg and 1000 kg of hazardous waste/month (Resource Conservation and Recovery Act (tracking hazardous waste)) - notification Business NAICS classification: GENERAL AUTOMOTIVE REPAIR.
ENCINO CENTER CLEANERS (16342 VENTURA BLVD in ENCINO, CA)
Small Quantity Generators, between 100 kg and 1000 kg of hazardous waste/month (Resource Conservation and Recovery Act (tracking hazardous waste)) - notification Organizations: CALVIN LEE (CONTACT/OWNER)
FRANK MCLAIN (15631 VENTURA BVLD in ENCINO, CA)
Small Quantity Generators, between 100 kg and 1000 kg of hazardous waste/month (Resource Conservation and Recovery Act (tracking hazardous waste))
FRONTIER CLEANERS (15605 VENTURA BLVD in ENCINO, CA)
Small Quantity Generators, between 100 kg and 1000 kg of hazardous waste/month (Resource Conservation and Recovery Act (tracking hazardous waste)) - notification Organizations: WILLIAM B KOH (CONTACT/OWNER)
CHARLES D STEWART DMD (15720 VENTURA BLVD NO 300 in ENCINO, CA)
Small Quantity Generators, between 100 kg and 1000 kg of hazardous waste/month (Resource Conservation and Recovery Act (tracking hazardous waste)) - notification
CHONG MATZNER AND CHING MDS (16030 VENTURA BLVD STE 440 in ENCINO, CA)
Small Quantity Generators, between 100 kg and 1000 kg of hazardous waste/month (Resource Conservation and Recovery Act (tracking hazardous waste)) - notification Organizations: CHONG MATZNER CHING MDS INC (CONTACT/OWNER)
ESSCO (16400 VENTURA BLVD STE 337 in ENCINO, CA)
COMPLIANCE ACTIVITY (Tracking inspections of insecticide, fungicide, and rodenticide, and toxic substances)
Housing units lacking complete plumbing facilities: 0.3% Housing units lacking complete kitchen facilities: 1.4%
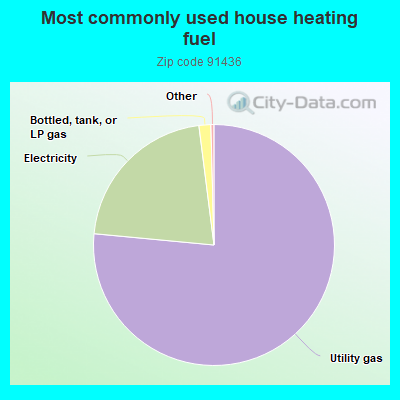
76.5%Utility gas
21.5%Electricity
1.6%Bottled, tank, or LP gas
Population in 1990: 13,605.
Place of birth for U.S.-born residents:
This state: 8,343
Northeast: 1,768
Midwest: 878
South: 650
West: 277
64% of the 91436 zip code residents lived in the same house 5 years ago. Out of people who lived in different houses, 87% lived in this county. Out of people who lived in different counties, 50% lived in California.
89% of the 91436 zip code residents lived in the same house 1 year ago. Out of people who lived in different houses, 79% moved from this county. Out of people who lived in different houses, 3% moved from different county within same state. Out of people who lived in different houses, 10% moved from different state. Out of people who lived in different houses, 5% moved from abroad.
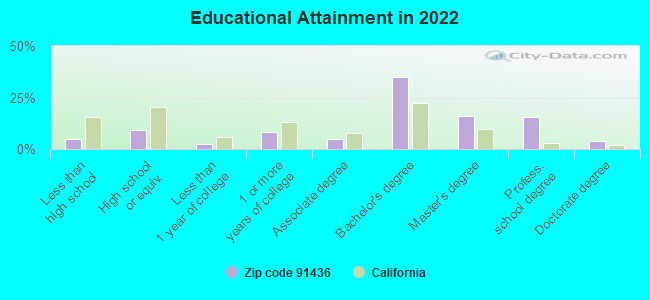
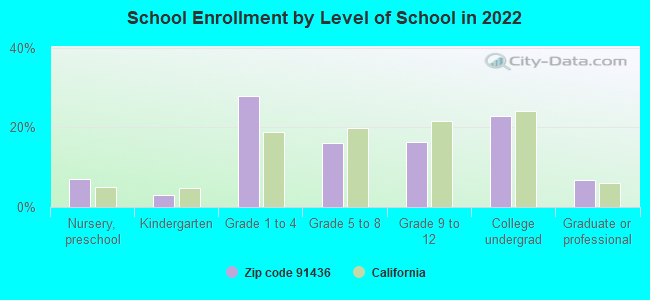
Private vs. public school enrollment:
Students in private schools in grades 1 to 8 (elementary and middle school): 775
Here:
42.6%
California:
10.5%
Students in private schools in grades 9 to 12 (high school): 335
Here:
51.3%
California:
8.5%
Students in private undergraduate colleges: 76
Here:
8.4%
California:
15.9%
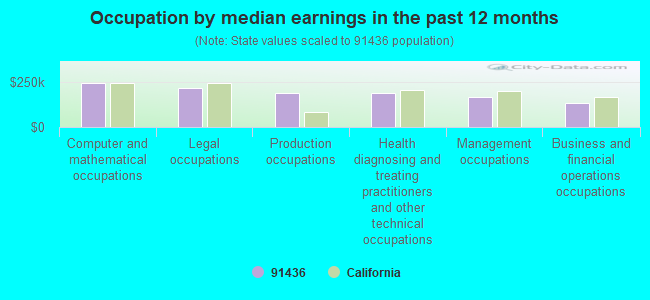
Occupation by median earnings in the past 12 months ($)
240,611Computer and mathematical occupations
190,338Legal occupations
184,488Health diagnosing and treating practitioners and other technical occupations
163,056Management occupations
126,864Arts, design, entertainment, sports, and media occupations
126,592Business and financial operations occupations
Companies with federal contracts located in this zip code:
KHANDABI, PEGA (3862 KIM LN in ENCINO, CA; small business) : $804,007 in 3 contractsfrom 2003 to 2005
$404,536 with Army for Other Defense -- Applied Research and Exploratory Development (R&D). Signed on 2005-03-10. Completion date: 2006-03-31.
$300,644, same as above.Signed on 2004-08-18. Completion date: 2005-11-25.
$98,827, same as above.Signed on 2003-12-08. Completion date: 2004-08-05.
PULSAR COMMUNACITIONS SYSTEM (3862 KIM LN in ENCINO, CA; small business) : $169,506 in 3 contractsfrom 2004 to 2005
$69,912 with Navy for Other Defense -- Operational Systems Development (R&D). Signed on 2004-05-17. Completion date: 2005-02-23.
$69,615, same as above.Signed on 2004-05-17. Completion date: 2005-02-23.
$29,979, same as above.Signed on 2005-01-14. Completion date: 2005-04-30.
david paster (16060 Venture Blvd. in Encino, ca; small business) : $73,400 in 2 contractsin 2004
$40,800 with Offices, Boards and Divisions (includes Attorney General, Deputy Attorney General, etc.) for Expert Witness. Signed on 2004-03-15. Completion date: 2004-07-20.
$32,600, same as above.Signed on 2004-06-18. Effective on 2004-06-14. Completion date: 2005-12-30.
H&H TOURING COMPANY, INC (116830 VENTURA BLVD in ENCINO, CA; small business)
$48,250 with Army for ADP Facility Operation and Maintenance Services. Signed on 2002-07-18. Completion date: 2002-07-27.
JAMES E ROSENBERG (16000 VENTURA BLVD in ENCINO, CA; small business)
$28,275 with Offices, Boards and Divisions (includes Attorney General, Deputy Attorney General, etc.) for Legal Services. Taking place in DC. Signed on 2005-03-30. Completion date: 2005-12-31.
INSIGHT MANAGEMENT SYSTEMS, IN (16161 VENTURA BLVD in ENCINO, CA; small business)
$3,500 with Air Force for ADP Software. Signed on 2004-01-05. Completion date: 2004-01-30.
SAXE CLIFFORD, SUSAN PHD INC (16530 VENTURA BLVD STE 203 in ENCINO, CA; small business) : $1,625 in 2 contractsfrom 2004 to 2005
$6,500 with Air Force for Mental Health -- Management and Support (R&D). Signed on 2004-12-20. Completion date: 2005-12-20.
-$4,875 with Air Force for Medical/Psychiatric Consultation Services. Signed on 2005-09-13. Completion date: 2005-12-20.
Top industries in this zip code by the number of employees in 2005:
2005 - 2018 National Fire Incident Reporting System (NFIRS) incidents
Based on the data from the years 2005 - 2018 the average number of fire incidents per year is 32. The highest number of reported fires - 55 took place in 2007, and the least - 9 in 2018. The data has a declining trend.
When looking into fire subcategories, the most reports belonged to: Mobile Property/Vehicle Fires (34.6%), and Structure Fires (34.4%).
Fire incident types reported to NFIRS in Zip Code 91436


 Nearest zip codes: 91316, 91403, 91411, 91406, 90077, 91356.
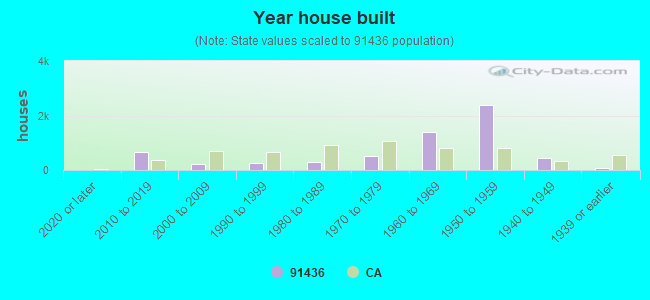


 Based on the data from the years 2005 - 2018 the average number of fire incidents per year is 32. The highest number of reported fires - 55 took place in 2007, and the least - 9 in 2018. The data has a declining trend.
 When looking into fire subcategories, the most reports belonged to: Mobile Property/Vehicle Fires (34.6%), and Structure Fires (34.4%).