Estimated zip code population in 2022: 28,260 Zip code population in 2010: 26,898 Zip code population in 2000: 27,595
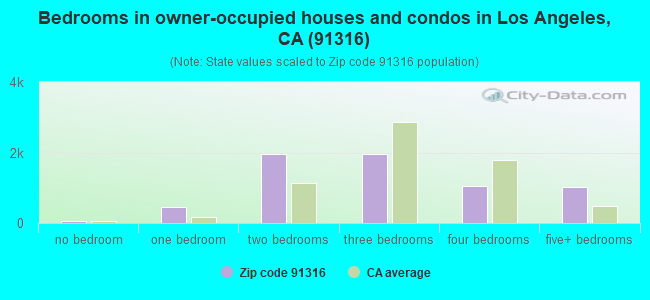
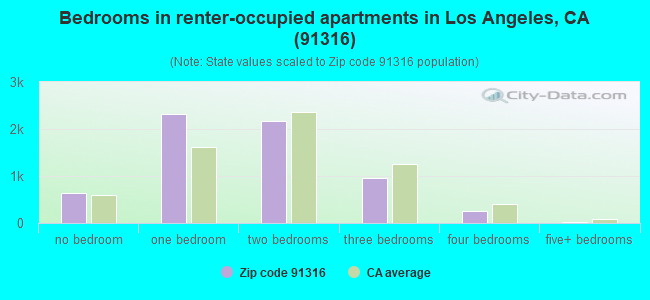
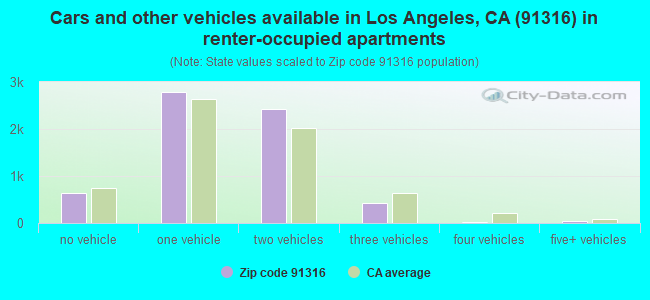
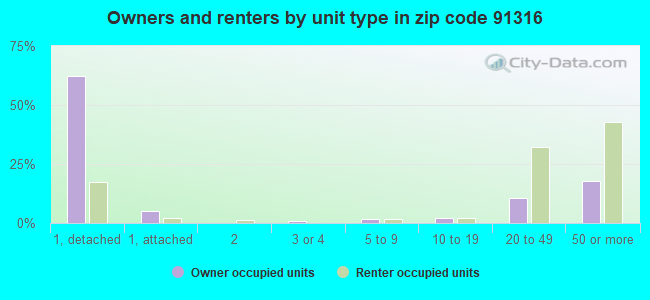
Houses and condos: 13,578 Renter-occupied apartments: 6,335
% of renters here:
49%
State:
44%
March 2022 cost of living index in zip code 91316: 138.6 (high, U.S. average is 100)
Land area: 5.0 sq. mi. Water area: 0.3 sq. mi.
Population density: 5,644 people per square mile
(average).
OSM Map
General Map
Google Map
MSN Map
OSM Map
General Map
Google Map
MSN Map
OSM Map
General Map
Google Map
MSN Map
OSM Map
General Map
Google Map
MSN Map
Please wait while loading the map...
Real estate property taxes paid for housing units in 2022:
This zip code:
0.7% ($6,464)
California:
0.7% ($4,831)
Median real estate property taxes paid for housing units with mortgages in 2022: $6,723 (0.7%) Median real estate property taxes paid for housing units with no mortgage in 2022: $6,120 (0.6%)
Estimated median house/condo value in 2022: $930,898
91316:
$930,898
California:
$715,900
According to our research of California and other state lists, there were 12 registered sex offenders living in 91316 zip code as of April 26, 2024. The ratio of all residents to sex offenders in zip code 91316 is 2,492 to 1. The ratio of registered sex offenders to all residents in this zip code is much lower than the state average.
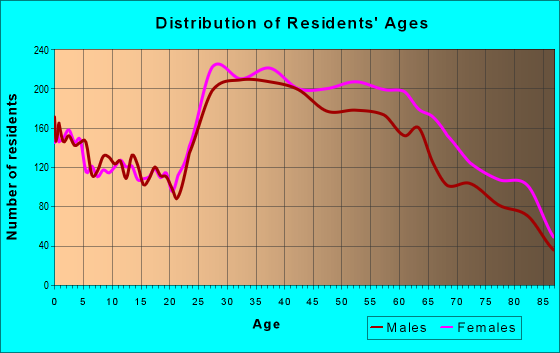
Median resident age:
This zip code:
45.7 years
California median age:
37.9 years
Average household size:
This zip code:
2.2 people
California:
2.8 people
Averages for the 2020 tax year for zip code 91316, filed in 2021:
Average Adjusted Gross Income (AGI) in 2020: $144,784 (Individual Income Tax Returns)
Here:
$144,784
State:
$95,910
Salary/wage: $108,847 (reported on 73.1% of returns)
Here:
$108,847
State:
$77,331
(% of AGI for various income ranges: 1200.0% for AGIs below $25k, 4290.0% for AGIs $25k-50k, 8176.6% for AGIs $50k-75k, 12576.7% for AGIs $75k-100k, 22709.2% for AGIs $100k-200k, 146057.0% for AGIs over 200k)
Taxable interest for individuals: $4,542 (reported on 42.3% of returns)
This zip code:
$4,542
California:
$2,294
(% of AGI for various income ranges: 61.9% for AGIs below $25k, 80.1% for AGIs $25k-50k, 156.3% for AGIs $50k-75k, 247.7% for AGIs $75k-100k, 395.2% for AGIs $100k-200k, 3926.0% for AGIs over 200k)
Ordinary dividends: $14,020 (reported on 29.0% of returns)
Here:
$14,020
State:
$10,949
(% of AGI for various income ranges: 75.0% for AGIs below $25k, 93.6% for AGIs $25k-50k, 177.0% for AGIs $50k-75k, 356.8% for AGIs $75k-100k, 811.6% for AGIs $100k-200k, 9466.2% for AGIs over 200k)
Net capital gain/loss in AGI: +$42,567 (reported on 30.5% of returns)
Here:
+$42,567
State:
+$49,306
(% of AGI for various income ranges: 33.7% for AGIs below $25k, 121.3% for AGIs $25k-50k, 205.0% for AGIs $50k-75k, 321.9% for AGIs $75k-100k, 1093.3% for AGIs $100k-200k, 36682.6% for AGIs over 200k)
Profit/loss from business: +$21,074 (reported on 29.5% of returns)
Here:
+$21,074
State:
+$15,671
(% of AGI for various income ranges: 366.2% for AGIs below $25k, 560.6% for AGIs $25k-50k, 696.6% for AGIs $50k-75k, 647.8% for AGIs $75k-100k, 1621.4% for AGIs $100k-200k, 10095.7% for AGIs over 200k)
Taxable individual retirement arrangement distribution: $26,783 (reported on 7.5% of returns)
91316:
$26,783
California:
$23,505
(% of AGI for various income ranges: 60.0% for AGIs below $25k, 106.0% for AGIs $25k-50k, 208.1% for AGIs $50k-75k, 340.9% for AGIs $75k-100k, 780.2% for AGIs $100k-200k, 3102.6% for AGIs over 200k)
Self-employed (Keogh) retirement plans: $36,259 (reported on 1.9% of returns)
91316:
$36,259
California:
$30,163
(% of AGI for various income ranges: 9.5% for AGIs below $25k, 43.6% for AGIs $50k-75k, 103.0% for AGIs $100k-200k, 1743.8% for AGIs over 200k)
Total itemized deductions: $41,863 (reported on 22.6% of returns)
Here:
$41,863
State:
$39,517
(% of AGI for various income ranges: 251.7% for AGIs below $25k, 402.2% for AGIs $25k-50k, 847.7% for AGIs $50k-75k, 1525.4% for AGIs $75k-100k, 3113.9% for AGIs $100k-200k, 16633.6% for AGIs over 200k)
Charity contributions: $11,739 (reported on 18.9% of returns)
Here:
$11,739
State:
$12,598
(% of AGI for various income ranges: 9.1% for AGIs below $25k, 30.0% for AGIs $25k-50k, 80.6% for AGIs $50k-75k, 156.2% for AGIs $75k-100k, 410.9% for AGIs $100k-200k, 5517.9% for AGIs over 200k)
Taxes paid: $8,944 (reported on 22.4% of returns)
91316:
$8,944
State:
$8,807
(% of AGI for various income ranges: 59.0% for AGIs below $25k, 87.1% for AGIs $25k-50k, 202.5% for AGIs $50k-75k, 436.7% for AGIs $75k-100k, 875.2% for AGIs $100k-200k, 2868.3% for AGIs over 200k)
Earned income credit: $1,432 (reported on 11.3% of returns)
Here:
$1,432
State:
$2,074
(% of AGI for various income ranges: 74.7% for AGIs below $25k, 48.9% for AGIs $25k-50k)
Percentage of individuals using paid preparers for their 2020 taxes: 92.7%
Here:
93%
State:
92%
(% for various income ranges: 90.5% for AGIs below $25k, 92.3% for AGIs $25k-50k, 92.1% for AGIs $50k-75k, 94.0% for AGIs $75k-100k, 94.2% for AGIs $100k-200k, 96.1% for AGIs over 200k)
Averages for the 2012 tax year for zip code 91316, filed in 2013:
Average Adjusted Gross Income (AGI) in 2012: $113,953 (Individual Income Tax Returns)
Here:
$113,953
State:
$72,726
Salary/wage: $82,711 (reported on 75.3% of returns)
Here:
$82,711
State:
$59,079
(% of AGI for various income ranges: 60.9% for AGIs below $25k, 73.1% for AGIs $25k-50k, 75.2% for AGIs $50k-75k, 74.1% for AGIs $75k-100k, 68.8% for AGIs $100k-200k, 43.5% for AGIs over 200k)
Taxable interest for individuals: $4,956 (reported on 44.8% of returns)
This zip code:
$4,956
California:
$2,146
(% of AGI for various income ranges: 2.7% for AGIs below $25k, 1.6% for AGIs $25k-50k, 1.3% for AGIs $50k-75k, 1.7% for AGIs $75k-100k, 1.8% for AGIs $100k-200k, 2.1% for AGIs over 200k)
Ordinary dividends: $11,455 (reported on 27.7% of returns)
Here:
$11,455
State:
$9,308
(% of AGI for various income ranges: 3.2% for AGIs below $25k, 1.7% for AGIs $25k-50k, 1.8% for AGIs $50k-75k, 1.5% for AGIs $75k-100k, 2.2% for AGIs $100k-200k, 3.3% for AGIs over 200k)
Net capital gain/loss in AGI: +$42,054 (reported on 26.3% of returns)
Here:
+$42,054
State:
+$30,460
(% of AGI for various income ranges: 0.1% for AGIs $25k-50k, 0.3% for AGIs $50k-75k, 1.0% for AGIs $75k-100k, 1.6% for AGIs $100k-200k, 15.8% for AGIs over 200k)
Profit/loss from business: +$19,578 (reported on 28.1% of returns)
Here:
+$19,578
State:
+$17,064
(% of AGI for various income ranges: 20.8% for AGIs below $25k, 8.9% for AGIs $25k-50k, 5.9% for AGIs $50k-75k, 4.5% for AGIs $75k-100k, 4.9% for AGIs $100k-200k, 3.3% for AGIs over 200k)
Taxable individual retirement arrangement distribution: $29,565 (reported on 10.5% of returns)
91316:
$29,565
California:
$19,557
(% of AGI for various income ranges: 3.6% for AGIs below $25k, 2.1% for AGIs $25k-50k, 2.9% for AGIs $50k-75k, 2.5% for AGIs $75k-100k, 3.8% for AGIs $100k-200k, 2.4% for AGIs over 200k)
Self-employment retirement plans: $30,492 (reported on 1.9% of returns)
91316:
$30,492
California:
$24,530
(% of AGI for various income ranges: 0.4% for AGIs below $25k, 0.5% for AGIs $50k-75k, 0.4% for AGIs $100k-200k, 0.7% for AGIs over 200k)
Total itemized deductions: $45,597 (22% of AGI, reported on 45.8% of returns)
Here:
$45,597
State:
$34,004
Here:
21.5% of AGI
State:
22.7% of AGI
(% of AGI for various income ranges: 19.2% for AGIs below $25k, 17.1% for AGIs $25k-50k, 17.8% for AGIs $50k-75k, 21.2% for AGIs $75k-100k, 22.1% for AGIs $100k-200k, 17.1% for AGIs over 200k)
Charity contributions: $5,966 (reported on 38.1% of returns)
Here:
$5,966
State:
$4,659
(% of AGI for various income ranges: 0.7% for AGIs below $25k, 1.2% for AGIs $25k-50k, 1.4% for AGIs $50k-75k, 1.7% for AGIs $75k-100k, 2.1% for AGIs $100k-200k, 2.2% for AGIs over 200k)
Taxes paid: $21,409 (reported on 45.7% of returns)
91316:
$21,409
State:
$14,448
(% of AGI for various income ranges: 3.8% for AGIs below $25k, 3.8% for AGIs $25k-50k, 5.0% for AGIs $50k-75k, 7.4% for AGIs $75k-100k, 8.7% for AGIs $100k-200k, 10.0% for AGIs over 200k)
Earned income credit: $1,613 (reported on 13.7% of returns)
Here:
$1,613
State:
$2,286
(% of AGI for various income ranges: 4.5% for AGIs below $25k, 0.6% for AGIs $25k-50k)
Percentage of individuals using paid preparers for their 2012 taxes: 72.9%
Here:
73%
State:
64%
(% for various income ranges: 68.9% for AGIs below $25k, 69.9% for AGIs $25k-50k, 70.8% for AGIs $50k-75k, 72.9% for AGIs $75k-100k, 76.9% for AGIs $100k-200k, 90.3% for AGIs over 200k)
Averages for the 2004 tax year for zip code 91316, filed in 2005:
Average Adjusted Gross Income (AGI) in 2004: $98,627 (Individual Income Tax Returns)
Here:
$98,627
State:
$58,600
Salary/wage: $72,229 (reported on 74.5% of returns)
Here:
$72,229
State:
$49,455
(% of AGI for various income ranges: 64.4% for AGIs $10k-25k, 76.1% for AGIs $25k-50k, 75.6% for AGIs $50k-75k, 71.1% for AGIs $75k-100k, 45.4% for AGIs over 100k)
Taxable interest for individuals: $5,348 (reported on 56.6% of returns)
This zip code:
$5,348
California:
$2,365
(% of AGI for various income ranges: 4.9% for AGIs $10k-25k, 3.0% for AGIs $25k-50k, 2.6% for AGIs $50k-75k, 2.3% for AGIs $75k-100k, 2.8% for AGIs over 100k)
Taxable dividends: $5,428 (reported on 33.9% of returns)
Here:
$5,428
State:
$4,746
(% of AGI for various income ranges: 2.9% for AGIs $10k-25k, 1.8% for AGIs $25k-50k, 1.5% for AGIs $50k-75k, 2.0% for AGIs $75k-100k, 1.7% for AGIs over 100k)
Net capital gain/loss: +$37,210 (reported on 32.8% of returns)
Here:
+$37,210
State:
+$23,418
(% of AGI for various income ranges: -0.1% for AGIs $10k-25k, 0.5% for AGIs $25k-50k, 0.3% for AGIs $50k-75k, 1.8% for AGIs $75k-100k, 16.1% for AGIs over 100k)
Profit/loss from business: +$20,199 (reported on 27.1% of returns)
Here:
+$20,199
State:
+$16,826
(% of AGI for various income ranges: 15.5% for AGIs $10k-25k, 8.5% for AGIs $25k-50k, 6.3% for AGIs $50k-75k, 6.8% for AGIs $75k-100k, 4.3% for AGIs over 100k)
IRA payment deduction: $3,550 (reported on 4.3% of returns)
91316:
$3,550
California:
$3,192
(% of AGI for various income ranges: 0.4% for AGIs $10k-25k, 0.4% for AGIs $25k-50k, 0.3% for AGIs $50k-75k, 0.3% for AGIs $75k-100k, 0.1% for AGIs over 100k)
Self-employed pension: $23,434 (reported on 2.8% of returns)
Here:
$23,434
California:
$17,688
(% of AGI for various income ranges: 0.1% for AGIs $10k-25k, 0.2% for AGIs $25k-50k, 0.2% for AGIs $50k-75k, 0.6% for AGIs $75k-100k, 0.8% for AGIs over 100k)
Total itemized deductions: $55,093 (30% of AGI, reported on 48.9% of returns)
Here:
$55,093
State:
$28,113
Here:
30.3% of AGI
State:
25.3% of AGI
(% of AGI for various income ranges: 20.6% for AGIs $10k-25k, 20.6% for AGIs $25k-50k, 22.1% for AGIs $50k-75k, 24.3% for AGIs $75k-100k, 28.0% for AGIs over 100k)
Charity contributions deductions: $6,245 (3% of AGI, reported on 43.4% of returns)
Here:
$6,245
State:
$3,923
Here:
3.2% of AGI
State:
3.3% of AGI
(% of AGI for various income ranges: 1.4% for AGIs $10k-25k, 1.8% for AGIs $25k-50k, 2.1% for AGIs $50k-75k, 2.6% for AGIs $75k-100k, 2.9% for AGIs over 100k)
Total tax: $23,373 (reported on 81.8% of returns)
91316:
$23,373
State:
$10,761
(% of AGI for various income ranges: 5.9% for AGIs $10k-25k, 8.4% for AGIs $25k-50k, 10.6% for AGIs $50k-75k, 11.6% for AGIs $75k-100k, 22.2% for AGIs over 100k)
Earned income credit: $1,254 (reported on 9.8% of returns)
Here:
$1,254
State:
$1,763
Percentage of individuals using paid preparers for their 2004 taxes: 75.7%
Here:
76%
State:
66%
(% for various income ranges: 73.1% for AGIs below $10k, 71.9% for AGIs $10k-25k, 71.6% for AGIs $25k-50k, 74.3% for AGIs $50k-75k, 78.8% for AGIs $75k-100k, 87.1% for AGIs over 100k)
Likely homosexual households (counted as self-reported same-sex unmarried-partner households)
Lesbian couples: 0.1% of all households
Gay men: 0.1% of all households
Household received Food Stamps/SNAP in the past 12 months: 1,454 Household did not receive Food Stamps/SNAP in the past 12 months: 11,354
Women who had a birth in the past 12 months: 238 (153 now married, 85 unmarried) Women who did not have a birth in the past 12 months: 5,793 (2,892 now married, 2,875 unmarried)
Housing units in zip code 91316 with a mortgage: 4,368 (520 second mortgage, 480 both second mortgage and home equity loan) Houses without a mortgage: 85
Median monthly owner costs for units with a mortgage: $3,484 Median monthly owner costs for units without a mortgage: $1,229
Residents with income below the poverty level in 2022:
This zip code:
8.6%
Whole state:
12.2%
Residents with income below 50% of the poverty level in 2022:
This zip code:
4.1%
Whole state:
6.2%
Median number of rooms in houses and condos:
Here:
5.5
State:
6.0
Median number of rooms in apartments:
Here:
3.5
State:
3.9
Notable locations in this zip code not listed on our city pages
Shopping Centers: Plaza De Oro Shopping Center (1), Encino Town Center Shopping Center (2), Encino Oaks Shopping Center (3), Encino Junior Shopping Center (4), Courtyard Shops of Encino Shopping Center (5). Display/hide their locations on the map
Churches in zip code 91316 include: Bethel Lutheran Church (A), First Presbyterian Church (B), Holy Martyrs Armenian Apostolic Church (C), Our Lady of Grace Church (D), Saint Nicholas Episcopal Church (E). Display/hide their locations on the map
In group quarters: 89 (-1 institutionalized population)
Size of family households: 3,299 2-persons, 1,849 3-persons, 1,509 4-persons, 578 5-persons, 36 6-persons
Size of nonfamily households: 4,779 1-person, 838 2-persons, 20 3-persons
4,033 married couples with children.
851 single-parent households (311 men, 540 women).
56.7% of residents of 91316 zip code speak English at home.
9.8% of residents speak Spanish at home (64% very well, 31% well, 5% not well).
27.7% of residents speak other Indo-European language at home (58% very well, 29% well, 10% not well, 3% not at all).
3.8% of residents speak Asian or Pacific Island language at home (65% very well, 33% well, 1% not well).
3.3% of residents speak other language at home (67% very well, 25% well, 6% not well, 2% not at all).
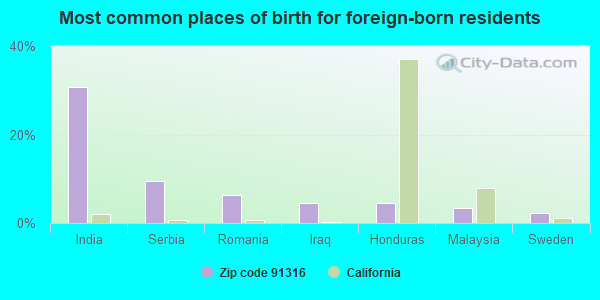
Foreign born population: 9,871 (34.9%) (69.2% of them are naturalized citizens)
This zip code:
34.9%
Whole state:
26.7%
31%India
9%Serbia
6%Romania
4%Iraq
4%Honduras
3%Malaysia
2%Sweden
15%Iranian
7%Armenian
6%Russian
6%American
3%Italian
3%European
3%Irish
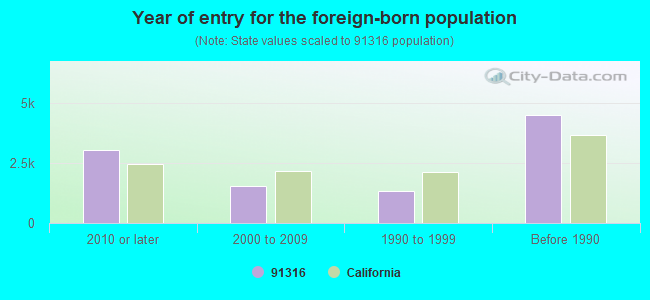
Year of entry for the foreign-born population
3,0522010 or later
1,5532000 to 2009
1,3481990 to 1999
4,515Before 1990
Major facilities with environmental interests located in this zip code:
LA FIRE STA 83 (5001 BALBOA BLV in ENCINO, CA)
STATE MASTER (California - Hazardous Waste Tracking) - HAZARDOU WASTE PROGRAM Small Quantity Generators, between 100 kg and 1000 kg of hazardous waste/month (Resource Conservation and Recovery Act (tracking hazardous waste)) - notification Organizations: CITY OF LOS ANGELES (CONTACT/OWNER)
Alternative names: CITY OF LA GENERAL SERVICES
EQUILON ENTERPRISES (16801 VENTURA BLVD in ENCINO, CA) . Federal Facility
STATE MASTER (California - Hazardous Waste Tracking) - HAZARDOU WASTE PROGRAM Small Quantity Generators, between 100 kg and 1000 kg of hazardous waste/month (Resource Conservation and Recovery Act (tracking hazardous waste)) - notification Organizations: EQUILON ENTERPRISES, LLC (CONTACT/OWNER)
Alternative names: SHELL OIL CO
EQUILON ENTERPRISES (17660 BURBANK in ENCINO, CA) . Federal Facility
STATE MASTER (California - Hazardous Waste Tracking) - HAZARDOU WASTE PROGRAM Small Quantity Generators, between 100 kg and 1000 kg of hazardous waste/month (Resource Conservation and Recovery Act (tracking hazardous waste)) - notification Organizations: EQUILON ENTERPRISES, LLC (CONTACT/OWNER)
Alternative names: SHELL OIL CO
EMELITA STREET ELEMENTARY (17931 HATTERAS ST. in ENCINO, CA)
(National Center for Education Statistics) - STATE ID-6016901 Organizations: LOS ANGELES UNIFIED (SCHOOL DISTRICT)
ENCINO ELEMENTARY (16941 ADDISON ST. in ENCINO, CA)
(National Center for Education Statistics) - STATE ID-6016935 Organizations: LOS ANGELES UNIFIED (SCHOOL DISTRICT)
LULL (FRED E.) SPECIAL ED. CENTER (17551 MIRANDA ST. in ENCINO, CA)
(National Center for Education Statistics) - STATE ID-6018865 Organizations: LOS ANGELES UNIFIED (SCHOOL DISTRICT)
EXXON MOBIL OIL CORP (5553 WHITE OAK AVE in ENCINO, CA)
HAZARDOUS WASTE BIENNIAL REPORTER (Resource Conservation and Recovery Act (tracking hazardous waste)) Large Quantity Generators, more that 1000 kg of hazardous waste/month (Resource Conservation and Recovery Act (tracking hazardous waste))
AMI RANCHO ENCINO HOSPITAL (5333 BALBOA BLVD in ENCINO, CA)
Small Quantity Generators, between 100 kg and 1000 kg of hazardous waste/month (Resource Conservation and Recovery Act (tracking hazardous waste)) - notification Organizations: AMERICAN MEDICAL INT (CONTACT/OWNER)
ELLIOTS DRY CLEANERS (17259 VENTURA BLVD in ENCINO, CA)
Small Quantity Generators, between 100 kg and 1000 kg of hazardous waste/month (Resource Conservation and Recovery Act (tracking hazardous waste)) Organizations: ELLIOT ROTTMAN (CONTACT/OWNER)
EMERY CLEANERS (17314 VENTURA BLVD in ENCINO, CA)
Small Quantity Generators, between 100 kg and 1000 kg of hazardous waste/month (Resource Conservation and Recovery Act (tracking hazardous waste)) - notification Organizations: SOON KANG KOO (CONTACT/OWNER)
ENCINO DRY CLEANERS (16946 VENTURA BLVD in ENCINO, CA)
Small Quantity Generators, between 100 kg and 1000 kg of hazardous waste/month (Resource Conservation and Recovery Act (tracking hazardous waste)) Organizations: RICHARD WINTERS (CONTACT/OWNER)
ENCINO MOTOR WORK (18066 VENTURA in ENCINO, CA)
Small Quantity Generators, between 100 kg and 1000 kg of hazardous waste/month (Resource Conservation and Recovery Act (tracking hazardous waste)) - notification Business NAICS classification: GENERAL AUTOMOTIVE REPAIR. Organizations: ENCINO MOTOR WORKS (CONTACT/OWNER)
ENCINO MOTORS BODY & PAINT, INC (17554 VENTURA BLVD in ENCINO, CA)
Small Quantity Generators, between 100 kg and 1000 kg of hazardous waste/month (Resource Conservation and Recovery Act (tracking hazardous waste)) - notification Organizations: ENCINO MOTORS B&P, INC (CONTACT/OWNER)
Housing units lacking complete plumbing facilities: 0.9% Housing units lacking complete kitchen facilities: 3.1%
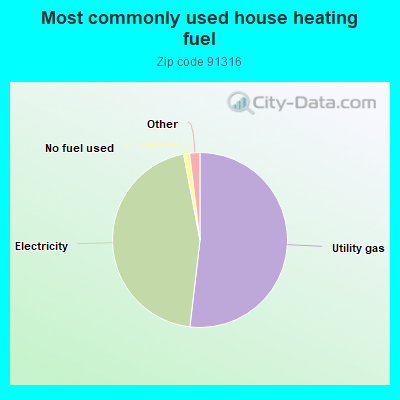
51.9%Utility gas
45.2%Electricity
1.1%No fuel used
0.7%Bottled, tank, or LP gas
0.7%Solar energy
Population in 1990: 24,538. Population change in the 1990s: +3,057 (+12.5%).
Place of birth for U.S.-born residents:
This state: 12,024
Northeast: 1,819
Midwest: 1,888
South: 1,175
West: 916
52% of the 91316 zip code residents lived in the same house 5 years ago. Out of people who lived in different houses, 79% lived in this county. Out of people who lived in different counties, 50% lived in California.
90% of the 91316 zip code residents lived in the same house 1 year ago. Out of people who lived in different houses, 79% moved from this county. Out of people who lived in different houses, 5% moved from different county within same state. Out of people who lived in different houses, 9% moved from different state. Out of people who lived in different houses, 5% moved from abroad.
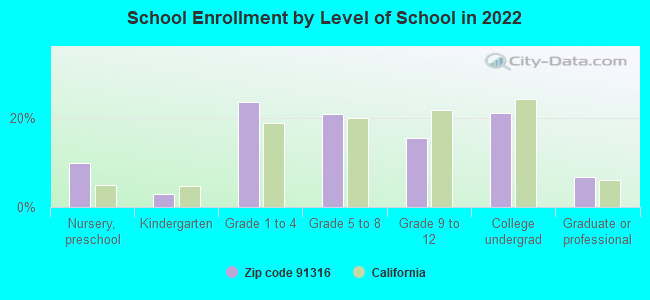
Private vs. public school enrollment:
Students in private schools in grades 1 to 8 (elementary and middle school): 745
Here:
30.0%
California:
10.5%
Students in private schools in grades 9 to 12 (high school): 274
Here:
32.2%
California:
8.5%
Students in private undergraduate colleges: 277
Here:
23.9%
California:
15.9%
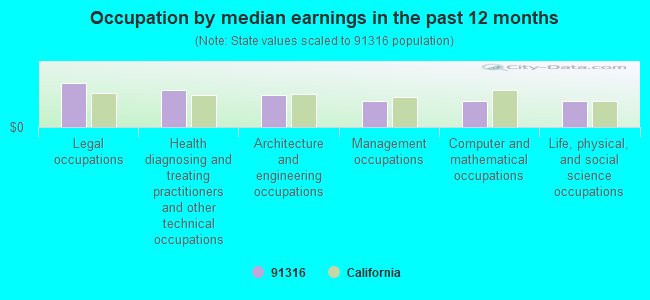
Occupation by median earnings in the past 12 months ($)
132,701Legal occupations
112,346Health diagnosing and treating practitioners and other technical occupations
96,904Architecture and engineering occupations
79,466Management occupations
79,363Computer and mathematical occupations
79,221Life, physical, and social science occupations
Companies with federal contracts located in this zip code:
SPIRAL ENGINEERING,INC (17800 BROMLEY CT in ENCINO, CA; small business) : $560,024 in 12 contractsin 2004
Contracts for Bushings, Rings, Shims, and Spacers, Airframe Structural Components, Hardware, Commercial, Aircraft Landing Gear Components by Defense Logistics Agency Signed by year:2000: $0; 2001: $0; 2002: $0; 2003: $0; 2004: $560,024; 2005: $0; 2006: $0.
Biggest contracts:
$97,995 with Defense Logistics Agency for Bushings, Rings, Shims, and Spacers. Signed on 2004-06-03. Completion date: 2004-09-01.
$76,965 with Defense Logistics Agency for Airframe Structural Components. Signed on 2004-06-14. Completion date: 2004-11-11.
$71,258 with Defense Logistics Agency for Hardware, Commercial. Signed on 2004-05-18. Completion date: 2004-08-01.
$58,731 with Defense Logistics Agency for Bushings, Rings, Shims, and Spacers. Signed on 2004-03-31. Completion date: 2004-06-19.
RUBICON CO (5168 YARMOUTH AVE , #21 in ENCINO, CA; small business)
$50,000 with Army for Technology Sharing/Utilization Services. Taking place in MD. Signed on 2005-06-08. Completion date: 2006-06-07.
Top industries in this zip code by the number of employees in 2005:
Health Care and Social Assistance: Home Health Care Services (over 1000 employees: 1 establishment, 20-49 employees: 1 establishment)
2005 - 2018 National Fire Incident Reporting System (NFIRS) incidents
Based on the data from the years 2005 - 2018 the average number of fires per year is 40. The highest number of reported fires - 56 took place in 2016, and the least - 19 in 2012. The data has a dropping trend.
When looking into fire subcategories, the most reports belonged to: Structure Fires (54.6%), and Outside Fires (23.4%).
Fire incident types reported to NFIRS in Zip Code 91316
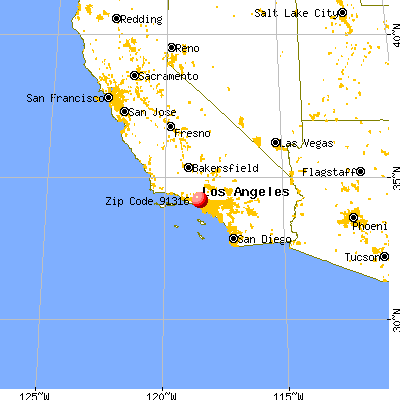


 Nearest zip codes: 91436, 91356, 91406, 91335, 91403, 91411.
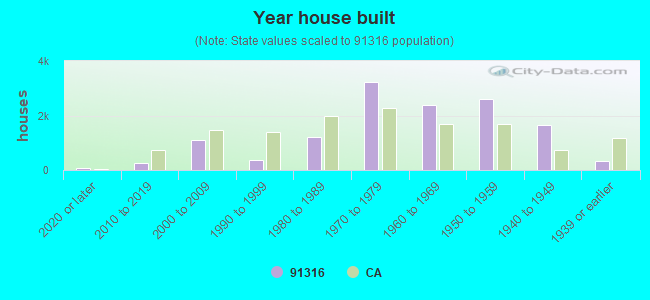


 Based on the data from the years 2005 - 2018 the average number of fires per year is 40. The highest number of reported fires - 56 took place in 2016, and the least - 19 in 2012. The data has a dropping trend.
 When looking into fire subcategories, the most reports belonged to: Structure Fires (54.6%), and Outside Fires (23.4%).