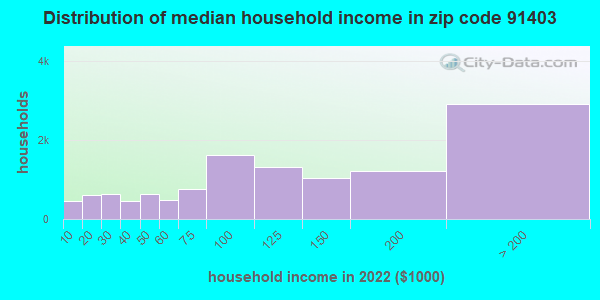
Estimated zip code population in 2022: 25,672 Zip code population in 2010: 23,484 Zip code population in 2000: 22,079
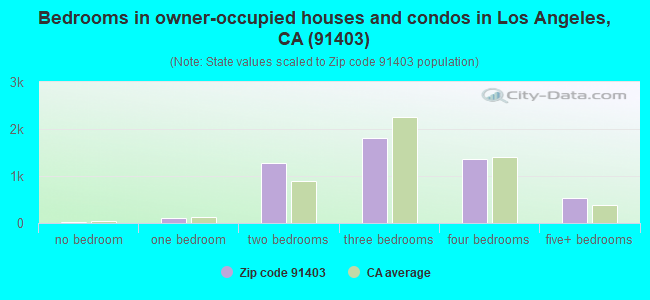
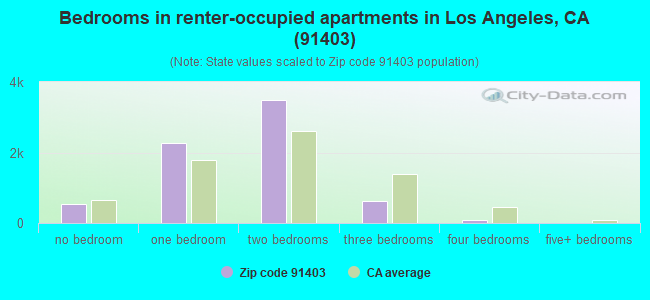
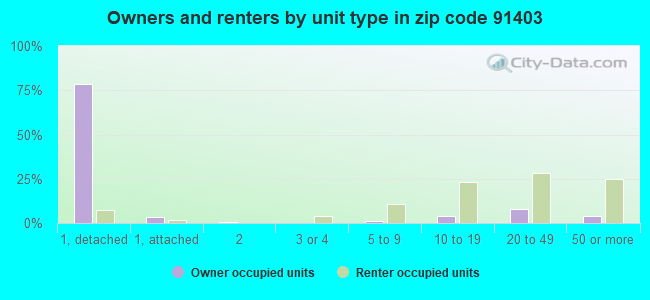
Houses and condos: 13,170 Renter-occupied apartments: 7,012
% of renters here:
58%
State:
44%
March 2022 cost of living index in zip code 91403: 143.4 (very high, U.S. average is 100)
Land area: 3.6 sq. mi. Water area: 0.0 sq. mi.
Population density: 7,069 people per square mile
(high).
OSM Map
General Map
Google Map
MSN Map
OSM Map
General Map
Google Map
MSN Map
OSM Map
General Map
Google Map
MSN Map
OSM Map
General Map
Google Map
MSN Map
Please wait while loading the map...
Real estate property taxes paid for housing units in 2022:
This zip code:
0.6% ($9,173)
California:
0.7% ($4,831)
Median real estate property taxes paid for housing units with mortgages in 2022: $9,744 (0.7%) Median real estate property taxes paid for housing units with no mortgage in 2022: $7,045 (0.5%)
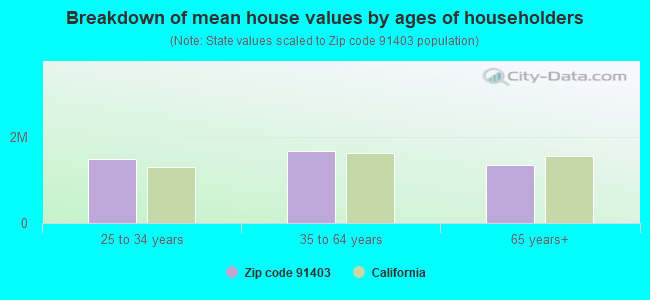
Estimated median house/condo value in 2022: $1,429,411
91403:
$1,429,411
California:
$715,900
According to our research of California and other state lists, there were 11 registered sex offenders living in 91403 zip code as of April 26, 2024. The ratio of all residents to sex offenders in zip code 91403 is 2,266 to 1. The ratio of registered sex offenders to all residents in this zip code is much lower than the state average.
Median resident age:
This zip code:
40.0 years
California median age:
37.9 years
Average household size:
This zip code:
2.1 people
California:
2.8 people
Averages for the 2020 tax year for zip code 91403, filed in 2021:
Average Adjusted Gross Income (AGI) in 2020: $164,076 (Individual Income Tax Returns)
Here:
$164,076
State:
$95,910
Salary/wage: $128,247 (reported on 75.8% of returns)
Here:
$128,247
State:
$77,331
(% of AGI for various income ranges: 1097.7% for AGIs below $25k, 4057.0% for AGIs $25k-50k, 8171.9% for AGIs $50k-75k, 11789.7% for AGIs $75k-100k, 22336.1% for AGIs $100k-200k, 158391.8% for AGIs over 200k)
Taxable interest for individuals: $5,126 (reported on 42.9% of returns)
This zip code:
$5,126
California:
$2,294
(% of AGI for various income ranges: 47.7% for AGIs below $25k, 84.6% for AGIs $25k-50k, 87.2% for AGIs $50k-75k, 122.3% for AGIs $75k-100k, 408.6% for AGIs $100k-200k, 4079.1% for AGIs over 200k)
Ordinary dividends: $11,297 (reported on 34.5% of returns)
Here:
$11,297
State:
$10,949
(% of AGI for various income ranges: 93.4% for AGIs below $25k, 119.0% for AGIs $25k-50k, 225.0% for AGIs $50k-75k, 322.3% for AGIs $75k-100k, 862.5% for AGIs $100k-200k, 6740.4% for AGIs over 200k)
Net capital gain/loss in AGI: +$50,149 (reported on 34.7% of returns)
Here:
+$50,149
State:
+$49,306
(% of AGI for various income ranges: 52.5% for AGIs below $25k, 160.7% for AGIs $25k-50k, 203.9% for AGIs $50k-75k, 279.4% for AGIs $75k-100k, 1111.8% for AGIs $100k-200k, 40448.6% for AGIs over 200k)
Profit/loss from business: +$19,713 (reported on 31.5% of returns)
Here:
+$19,713
State:
+$15,671
(% of AGI for various income ranges: 327.2% for AGIs below $25k, 578.0% for AGIs $25k-50k, 722.5% for AGIs $50k-75k, 704.9% for AGIs $75k-100k, 1482.3% for AGIs $100k-200k, 8031.4% for AGIs over 200k)
Taxable individual retirement arrangement distribution: $27,275 (reported on 7.1% of returns)
91403:
$27,275
California:
$23,505
(% of AGI for various income ranges: 50.0% for AGIs below $25k, 102.1% for AGIs $25k-50k, 220.9% for AGIs $50k-75k, 334.6% for AGIs $75k-100k, 719.4% for AGIs $100k-200k, 2235.2% for AGIs over 200k)
Self-employed (Keogh) retirement plans: $28,936 (reported on 2.3% of returns)
91403:
$28,936
California:
$30,163
(% of AGI for various income ranges: 65.2% for AGIs $50k-75k, 125.9% for AGIs $100k-200k, 1341.1% for AGIs over 200k)
Total itemized deductions: $43,873 (reported on 24.1% of returns)
Here:
$43,873
State:
$39,517
(% of AGI for various income ranges: 220.8% for AGIs below $25k, 391.7% for AGIs $25k-50k, 812.4% for AGIs $50k-75k, 1311.4% for AGIs $75k-100k, 2952.1% for AGIs $100k-200k, 16101.1% for AGIs over 200k)
Charity contributions: $11,197 (reported on 20.4% of returns)
Here:
$11,197
State:
$12,598
(% of AGI for various income ranges: 10.8% for AGIs below $25k, 21.4% for AGIs $25k-50k, 58.5% for AGIs $50k-75k, 103.5% for AGIs $75k-100k, 376.9% for AGIs $100k-200k, 4710.9% for AGIs over 200k)
Taxes paid: $9,084 (reported on 24.1% of returns)
91403:
$9,084
State:
$8,807
(% of AGI for various income ranges: 43.4% for AGIs below $25k, 78.6% for AGIs $25k-50k, 179.9% for AGIs $50k-75k, 365.1% for AGIs $75k-100k, 821.5% for AGIs $100k-200k, 2808.6% for AGIs over 200k)
Earned income credit: $1,163 (reported on 8.4% of returns)
Here:
$1,163
State:
$2,074
(% of AGI for various income ranges: 48.3% for AGIs below $25k, 34.9% for AGIs $25k-50k)
Percentage of individuals using paid preparers for their 2020 taxes: 93.4%
Here:
93%
State:
92%
(% for various income ranges: 90.8% for AGIs below $25k, 94.0% for AGIs $25k-50k, 93.3% for AGIs $50k-75k, 93.8% for AGIs $75k-100k, 94.4% for AGIs $100k-200k, 95.8% for AGIs over 200k)
Averages for the 2012 tax year for zip code 91403, filed in 2013:
Average Adjusted Gross Income (AGI) in 2012: $132,718 (Individual Income Tax Returns)
Here:
$132,718
State:
$72,726
Salary/wage: $106,921 (reported on 77.6% of returns)
Here:
$106,921
State:
$59,079
(% of AGI for various income ranges: 62.2% for AGIs below $25k, 74.8% for AGIs $25k-50k, 76.9% for AGIs $50k-75k, 71.7% for AGIs $75k-100k, 68.0% for AGIs $100k-200k, 57.7% for AGIs over 200k)
Taxable interest for individuals: $4,863 (reported on 45.3% of returns)
This zip code:
$4,863
California:
$2,146
(% of AGI for various income ranges: 2.4% for AGIs below $25k, 1.3% for AGIs $25k-50k, 1.1% for AGIs $50k-75k, 1.0% for AGIs $75k-100k, 1.5% for AGIs $100k-200k, 1.8% for AGIs over 200k)
Ordinary dividends: $13,934 (reported on 30.6% of returns)
Here:
$13,934
State:
$9,308
(% of AGI for various income ranges: 4.0% for AGIs below $25k, 1.7% for AGIs $25k-50k, 1.5% for AGIs $50k-75k, 2.1% for AGIs $75k-100k, 2.4% for AGIs $100k-200k, 3.8% for AGIs over 200k)
Net capital gain/loss in AGI: +$22,974 (reported on 29.1% of returns)
Here:
+$22,974
State:
+$30,460
(% of AGI for various income ranges: 0.2% for AGIs $25k-50k, 0.4% for AGIs $50k-75k, 1.5% for AGIs $75k-100k, 1.9% for AGIs $100k-200k, 7.3% for AGIs over 200k)
Profit/loss from business: +$35,382 (reported on 30.7% of returns)
Here:
+$35,382
State:
+$17,064
(% of AGI for various income ranges: 20.4% for AGIs below $25k, 10.9% for AGIs $25k-50k, 7.8% for AGIs $50k-75k, 7.0% for AGIs $75k-100k, 6.5% for AGIs $100k-200k, 8.0% for AGIs over 200k)
Taxable individual retirement arrangement distribution: $26,443 (reported on 9.7% of returns)
91403:
$26,443
California:
$19,557
(% of AGI for various income ranges: 3.3% for AGIs below $25k, 2.6% for AGIs $25k-50k, 2.1% for AGIs $50k-75k, 2.5% for AGIs $75k-100k, 3.3% for AGIs $100k-200k, 1.4% for AGIs over 200k)
Self-employment retirement plans: $29,040 (reported on 2.2% of returns)
91403:
$29,040
California:
$24,530
(% of AGI for various income ranges: 0.2% for AGIs $25k-50k, 0.3% for AGIs $50k-75k, 0.3% for AGIs $75k-100k, 0.5% for AGIs $100k-200k, 0.6% for AGIs over 200k)
Total itemized deductions: $51,689 (22% of AGI, reported on 48.8% of returns)
Here:
$51,689
State:
$34,004
Here:
21.8% of AGI
State:
22.7% of AGI
(% of AGI for various income ranges: 21.0% for AGIs below $25k, 15.0% for AGIs $25k-50k, 17.8% for AGIs $50k-75k, 20.4% for AGIs $75k-100k, 22.8% for AGIs $100k-200k, 18.3% for AGIs over 200k)
Charity contributions: $5,733 (reported on 41.0% of returns)
Here:
$5,733
State:
$4,659
(% of AGI for various income ranges: 0.8% for AGIs below $25k, 1.0% for AGIs $25k-50k, 1.4% for AGIs $50k-75k, 1.5% for AGIs $75k-100k, 1.8% for AGIs $100k-200k, 1.9% for AGIs over 200k)
Taxes paid: $26,328 (reported on 48.7% of returns)
91403:
$26,328
State:
$14,448
(% of AGI for various income ranges: 4.5% for AGIs below $25k, 3.3% for AGIs $25k-50k, 4.8% for AGIs $50k-75k, 7.1% for AGIs $75k-100k, 8.8% for AGIs $100k-200k, 11.4% for AGIs over 200k)
Earned income credit: $1,290 (reported on 10.2% of returns)
Here:
$1,290
State:
$2,286
(% of AGI for various income ranges: 3.1% for AGIs below $25k, 0.4% for AGIs $25k-50k)
Percentage of individuals using paid preparers for their 2012 taxes: 70.1%
Here:
70%
State:
64%
(% for various income ranges: 64.3% for AGIs below $25k, 61.4% for AGIs $25k-50k, 66.5% for AGIs $50k-75k, 72.0% for AGIs $75k-100k, 79.1% for AGIs $100k-200k, 89.2% for AGIs over 200k)
Averages for the 2004 tax year for zip code 91403, filed in 2005:
Average Adjusted Gross Income (AGI) in 2004: $110,509 (Individual Income Tax Returns)
Here:
$110,509
State:
$58,600
Salary/wage: $93,538 (reported on 77.0% of returns)
Here:
$93,538
State:
$49,455
(% of AGI for various income ranges: 68.6% for AGIs $10k-25k, 77.3% for AGIs $25k-50k, 76.2% for AGIs $50k-75k, 71.1% for AGIs $75k-100k, 59.9% for AGIs over 100k)
Taxable interest for individuals: $4,568 (reported on 57.1% of returns)
This zip code:
$4,568
California:
$2,365
(% of AGI for various income ranges: 4.0% for AGIs $10k-25k, 2.2% for AGIs $25k-50k, 2.1% for AGIs $50k-75k, 2.5% for AGIs $75k-100k, 2.1% for AGIs over 100k)
Taxable dividends: $5,745 (reported on 37.5% of returns)
Here:
$5,745
State:
$4,746
(% of AGI for various income ranges: 3.5% for AGIs $10k-25k, 1.6% for AGIs $25k-50k, 1.8% for AGIs $50k-75k, 1.9% for AGIs $75k-100k, 1.8% for AGIs over 100k)
Net capital gain/loss: +$24,838 (reported on 35.6% of returns)
Here:
+$24,838
State:
+$23,418
(% of AGI for various income ranges: 0.2% for AGIs $10k-25k, 0.8% for AGIs $25k-50k, 1.3% for AGIs $50k-75k, 1.9% for AGIs $75k-100k, 9.8% for AGIs over 100k)
Profit/loss from business: +$27,007 (reported on 30.1% of returns)
Here:
+$27,007
State:
+$16,826
(% of AGI for various income ranges: 14.7% for AGIs $10k-25k, 8.6% for AGIs $25k-50k, 6.6% for AGIs $50k-75k, 8.2% for AGIs $75k-100k, 6.7% for AGIs over 100k)
IRA payment deduction: $3,297 (reported on 4.2% of returns)
91403:
$3,297
California:
$3,192
(% of AGI for various income ranges: 0.3% for AGIs $10k-25k, 0.3% for AGIs $25k-50k, 0.3% for AGIs $50k-75k, 0.3% for AGIs $75k-100k, 0.1% for AGIs over 100k)
Self-employed pension: $19,436 (reported on 3.2% of returns)
Here:
$19,436
California:
$17,688
(% of AGI for various income ranges: 0.3% for AGIs $10k-25k, 0.2% for AGIs $25k-50k, 0.3% for AGIs $50k-75k, 0.6% for AGIs $75k-100k, 0.6% for AGIs over 100k)
Total itemized deductions: $40,861 (21% of AGI, reported on 51.2% of returns)
Here:
$40,861
State:
$28,113
Here:
20.9% of AGI
State:
25.3% of AGI
(% of AGI for various income ranges: 28.1% for AGIs $10k-25k, 18.4% for AGIs $25k-50k, 22.8% for AGIs $50k-75k, 23.9% for AGIs $75k-100k, 17.1% for AGIs over 100k)
Charity contributions deductions: $5,788 (3% of AGI, reported on 45.5% of returns)
Here:
$5,788
State:
$3,923
Here:
2.8% of AGI
State:
3.3% of AGI
(% of AGI for various income ranges: 1.6% for AGIs $10k-25k, 1.8% for AGIs $25k-50k, 2.3% for AGIs $50k-75k, 2.2% for AGIs $75k-100k, 2.4% for AGIs over 100k)
Total tax: $26,950 (reported on 84.8% of returns)
91403:
$26,950
State:
$10,761
(% of AGI for various income ranges: 6.4% for AGIs $10k-25k, 9.3% for AGIs $25k-50k, 11.4% for AGIs $50k-75k, 12.7% for AGIs $75k-100k, 23.2% for AGIs over 100k)
Earned income credit: $1,052 (reported on 8.2% of returns)
Here:
$1,052
State:
$1,763
Percentage of individuals using paid preparers for their 2004 taxes: 73.2%
Here:
73%
State:
66%
(% for various income ranges: 69.2% for AGIs below $10k, 69.7% for AGIs $10k-25k, 65.9% for AGIs $25k-50k, 73.6% for AGIs $50k-75k, 76.6% for AGIs $75k-100k, 84.8% for AGIs over 100k)
Likely homosexual households (counted as self-reported same-sex unmarried-partner households)
Lesbian couples: 0.1% of all households
Gay men: 0.7% of all households
Household received Food Stamps/SNAP in the past 12 months: 810 Household did not receive Food Stamps/SNAP in the past 12 months: 11,166
Women who had a birth in the past 12 months: 317 (315 now married, 0 unmarried) Women who did not have a birth in the past 12 months: 6,767 (2,394 now married, 4,385 unmarried)
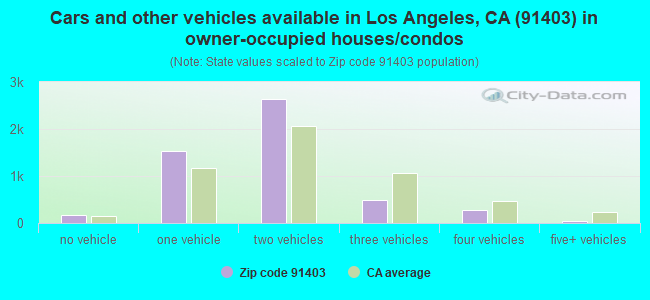
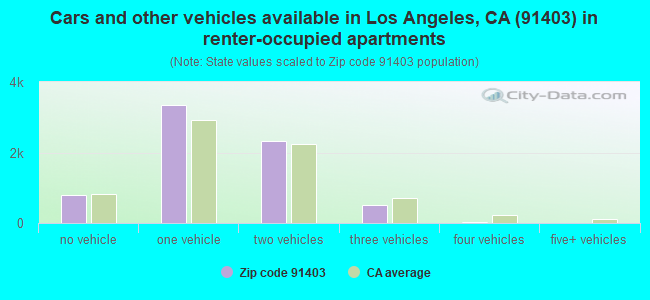
Housing units in zip code 91403 with a mortgage: 3,911 (627 second mortgage, 95 home equity loan, 491 both second mortgage and home equity loan) Houses without a mortgage: 95
Median monthly owner costs for units with a mortgage: $3,876 Median monthly owner costs for units without a mortgage: $1,445
Residents with income below the poverty level in 2022:
This zip code:
7.6%
Whole state:
12.2%
Residents with income below 50% of the poverty level in 2022:
This zip code:
4.1%
Whole state:
6.2%
Median number of rooms in houses and condos:
Here:
6.4
State:
6.0
Median number of rooms in apartments:
Here:
3.7
State:
3.9
Notable locations in this zip code not listed on our city pages
Churches in zip code 91403 include: Little Church of Sherman Oaks (A), First Presbyterian Church (B), Sherman Oaks Lutheran Church (C). Display/hide their locations on the map
Tourist attraction (not listed on the city page) : 1st Travel Services Parisima (Tours & Charters; 14844 Dickens St Suite 204).
3,290 married couples with children.
791 single-parent households (134 men, 657 women).
66.3% of residents of 91403 zip code speak English at home.
9.5% of residents speak Spanish at home (81% very well, 12% well, 7% not well).
17.5% of residents speak other Indo-European language at home (71% very well, 15% well, 12% not well, 2% not at all).
3.9% of residents speak Asian or Pacific Island language at home (70% very well, 26% well, 4% not at all).
3.1% of residents speak other language at home (74% very well, 24% well, 2% not well).
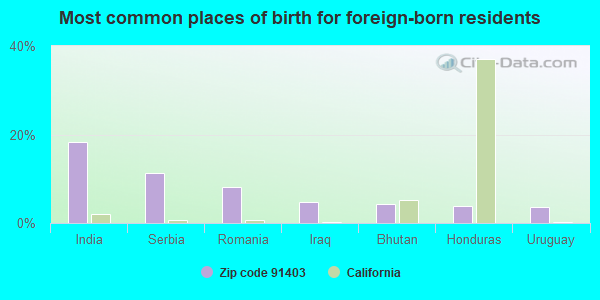
Foreign born population: 6,108 (23.8%) (73.8% of them are naturalized citizens)
This zip code:
23.8%
Whole state:
26.7%
18%India
11%Serbia
8%Romania
5%Iraq
4%Bhutan
4%Honduras
4%Uruguay
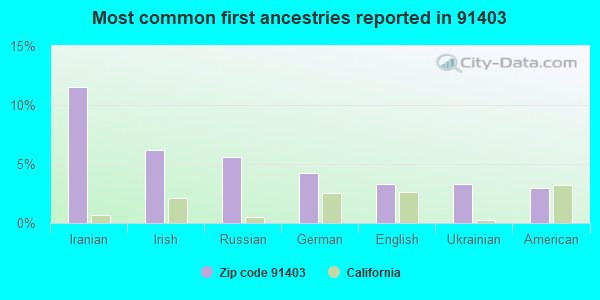
12%Iranian
6%Irish
6%Russian
4%German
3%English
3%Ukrainian
3%American
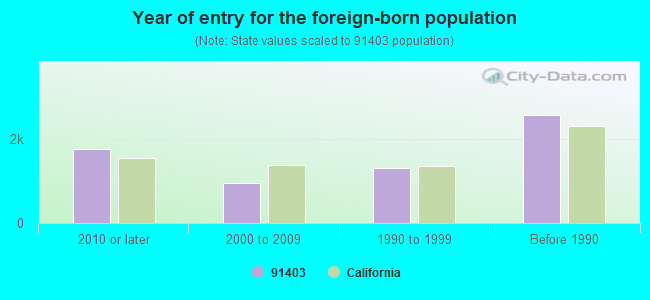
Year of entry for the foreign-born population
1,7582010 or later
9412000 to 2009
1,3001990 to 1999
2,562Before 1990
Major facilities with environmental interests located in this zip code:
JOHNS SHELL (4404 WOODMAN in SHERMAN OAKS, CA)
STATE MASTER (California - Hazardous Waste Tracking) - HAZARDOU WASTE PROGRAM Small Quantity Generators, between 100 kg and 1000 kg of hazardous waste/month (Resource Conservation and Recovery Act (tracking hazardous waste)) - notification Small Quantity Generators, between 100 kg and 1000 kg of hazardous waste/month (Resource Conservation and Recovery Act (tracking hazardous waste)) - notification Organizations: EQUILON ENTERPRISES L L C (CONTACT/OWNER)
, JOHN BUCHAKJIAN (CONTACT/OWNER)
Alternative names: SHELL SERVICE STATION
EXXONMOBIL OIL CORPORATION (4715 VAN NUYS BOULEVARD in SHERMAN OAKS, CA)
Large Quantity Generators, more that 1000 kg of hazardous waste/month (Resource Conservation and Recovery Act (tracking hazardous waste)) HAZARDOUS WASTE BIENNIAL REPORTER (Resource Conservation and Recovery Act (tracking hazardous waste)) Large Quantity Generators, more that 1000 kg of hazardous waste/month (Resource Conservation and Recovery Act (tracking hazardous waste)) Organizations: THE IRA GRIBIN TRUST (CONTACT/OWNER)
Alternative names: SHERMAN MOBIL
LA FIRE STATION 78 (4230 COLDWATER CANYON AVE in SHERMAN OAKS, CA)
STATE MASTER (California - Hazardous Waste Tracking) - HAZARDOU WASTE PROGRAM Small Quantity Generators, between 100 kg and 1000 kg of hazardous waste/month (Resource Conservation and Recovery Act (tracking hazardous waste)) - notification Organizations: CITY OF LOS ANGELES (CONTACT/OWNER)
Alternative names: CITY OF LA GENERAL SERVICES
FIRE STATION 88 (5101 SEPULVEDA BLVD in SHERMAN OAKS, CA)
STATE MASTER (California - Hazardous Waste Tracking) - HAZARDOU WASTE PROGRAM Small Quantity Generators, between 100 kg and 1000 kg of hazardous waste/month (Resource Conservation and Recovery Act (tracking hazardous waste)) - notification Organizations: CITY OF L A (CONTACT/OWNER)
Alternative names: CITY OF LA GENERAL SERVICES
STATE MASTER (California - Hazardous Waste Tracking) - HAZARDOU WASTE PROGRAM Small Quantity Generators, between 100 kg and 1000 kg of hazardous waste/month (Resource Conservation and Recovery Act (tracking hazardous waste)) - notification
EL POLLO LOCO PARKING LOT (4544 SAUGUS AVE in SHERMAN OAKS, CA)
(Resource Conservation and Recovery Act (tracking hazardous waste)) Organizations: TEL PORTFOLIO CORP (CONTACT/OWNER)
A-1 CLEANERS (14100 MAGNOLIA BLVD in SHERMAN OAKS, CA)
Small Quantity Generators, between 100 kg and 1000 kg of hazardous waste/month (Resource Conservation and Recovery Act (tracking hazardous waste)) - notification Organizations: SANG S LEE (CONTACT/OWNER)
HIGH TECH AUTO (4774 WOODMAN in SHERMAN OAKS, CA)
Small Quantity Generators, between 100 kg and 1000 kg of hazardous waste/month (Resource Conservation and Recovery Act (tracking hazardous waste)) - notification Organizations: LOUIE DIAZ & MARTY RUTHMAN (CONTACT/OWNER)
MERLIN OLSEN BODY SHOP INC (15318 VENTURA BLVD in SHERMAN OAKS, CA)
Small Quantity Generators, between 100 kg and 1000 kg of hazardous waste/month (Resource Conservation and Recovery Act (tracking hazardous waste)) - notification
MR DRY CLEAN (4540 SAUGUS AVE in SHERMAN OAKS, CA)
Small Quantity Generators, between 100 kg and 1000 kg of hazardous waste/month (Resource Conservation and Recovery Act (tracking hazardous waste)) - notification Organizations: SUNIL PATEL (CONTACT/OWNER)
ALLIED X RAY IMAGING (4835 VAN NUYS BLVD 209 in SHERMAN OAKS, CA)
Small Quantity Generators, between 100 kg and 1000 kg of hazardous waste/month (Resource Conservation and Recovery Act (tracking hazardous waste)) - notification Organizations: PENG THIM FAN M D (CONTACT/OWNER)
FROMEX ONE HR PHOTO SHERMAN OAKS (15301 VENTURA BLVD NO 301 in SHERMAN OAKS, CA)
Small Quantity Generators, between 100 kg and 1000 kg of hazardous waste/month (Resource Conservation and Recovery Act (tracking hazardous waste)) - notification Organizations: RAVENROCK INC (CONTACT/OWNER)
GOODYEAR 9347 (14210 VENTURA BLVD in SHERMAN OAKS, CA)
Small Quantity Generators, between 100 kg and 1000 kg of hazardous waste/month (Resource Conservation and Recovery Act (tracking hazardous waste)) - notification Organizations: HAROLD MOSS (CONTACT/OWNER)
Housing units lacking complete plumbing facilities: 0.4% Housing units lacking complete kitchen facilities: 3.0%
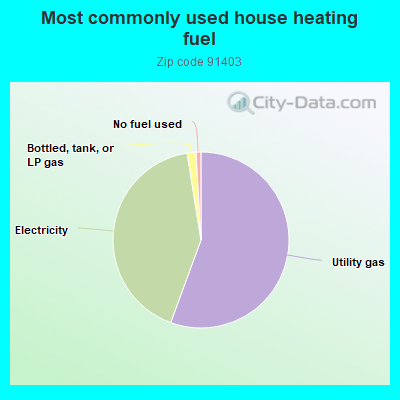
55.5%Utility gas
41.8%Electricity
1.6%Bottled, tank, or LP gas
0.9%No fuel used
Population in 1990: 20,046. Population change in the 1990s: +2,033 (+10.1%).
Place of birth for U.S.-born residents:
This state: 11,130
Northeast: 2,901
Midwest: 2,104
South: 1,846
West: 1,026
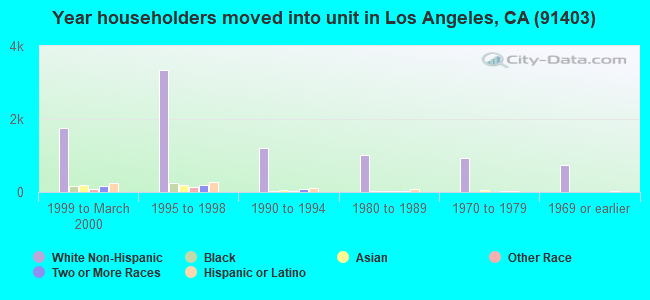
47% of the 91403 zip code residents lived in the same house 5 years ago. Out of people who lived in different houses, 73% lived in this county. Out of people who lived in different counties, 50% lived in California.
89% of the 91403 zip code residents lived in the same house 1 year ago. Out of people who lived in different houses, 78% moved from this county. Out of people who lived in different houses, 3% moved from different county within same state. Out of people who lived in different houses, 10% moved from different state. Out of people who lived in different houses, 6% moved from abroad.
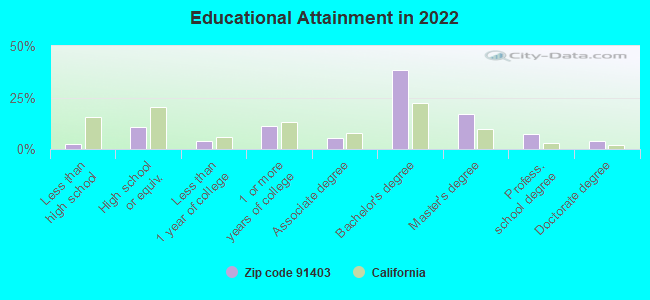
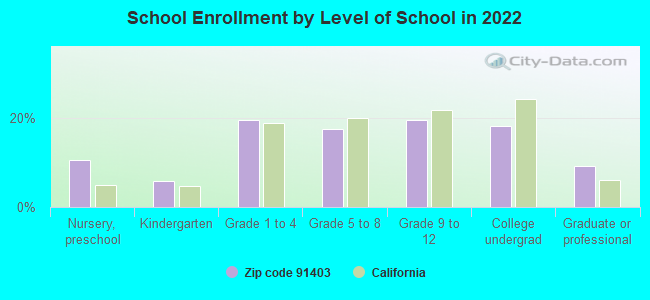
Private vs. public school enrollment:
Students in private schools in grades 1 to 8 (elementary and middle school): 565
Here:
35.2%
California:
10.5%
Students in private schools in grades 9 to 12 (high school): 374
Here:
45.0%
California:
8.5%
Students in private undergraduate colleges: 142
Here:
18.4%
California:
15.9%
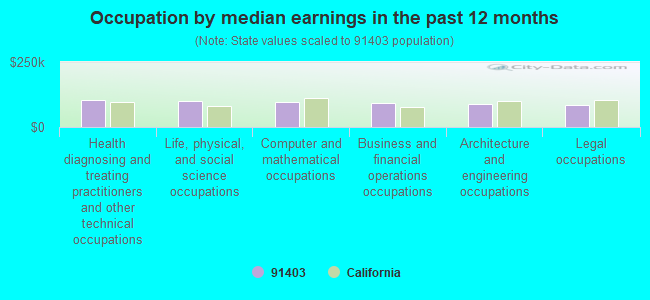
Occupation by median earnings in the past 12 months ($)
103,718Health diagnosing and treating practitioners and other technical occupations
100,292Life, physical, and social science occupations
97,086Computer and mathematical occupations
92,296Business and financial operations occupations
88,423Architecture and engineering occupations
86,014Legal occupations
Companies with biggest federal contracts located in this zip code (SHERMAN OAKS, CA):
SY TECHNOLOGY, INC (5170 SEPULVEDA BLVD # 240; small business) : $116,438,534 in 520 contractsfrom 1999 to 2006
Contracts for Other ADP and Telecommunications Services (includes data storage on tapes, compact disks, etc.), Policy Review/Development Services, Engineering and Technical Services, Technical Assistance, and moreby Federal Technology Service, Army, Air Force, U.S. Special Operations Command, and others Signed by year:2000: $22,899,734; 2001: $14,969,388; 2002: $20,543,143; 2003: $20,880,117; 2004: $12,524,878; 2005: $18,681,051; 2006: $3,767,806.
Biggest contracts:
$2,979,808 with Federal Technology Service for Other ADP and Telecommunications Services (includes data storage on tapes, compact disks, etc.). Taking place in VA. Signed on 2003-09-15. Completion date: 2004-09-15.
$2,450,935 with Army for Policy Review/Development Services. Signed on 2000-11-17. Completion date: 2002-09-30.
$2,397,328, same as above.Signed on 2001-09-30. Completion date: 2002-09-30.
$2,397,328, same as above.Signed on 2002-02-01. Completion date: 2002-09-30.
ARETE ASSOCIATES (5000 VAN NUYS BLVD STE 400; small business) : $66,834,105 in 297 contractsfrom 1999 to 2006
Contracts for Defense Electronics and Communication Equipment -- Operational Systems Development (R&D), Defense Electronics and Communication Equipment -- Advanced Development (R&D), Other Defense -- Applied Research and Exploratory Development (R&D), Services -- Advanced Development (R&D), and moreby Army, Navy, Federal Technology Service, Department of Defense, and others Signed by year:2000: $6,871,284; 2001: $5,318,821; 2002: $11,856,037; 2003: $11,159,041; 2004: $8,138,277; 2005: $9,761,840; 2006: $10,031,065.
Biggest contracts:
$2,199,690 with Army for Defense Electronics and Communication Equipment -- Operational Systems Development (R&D). Taking place in AZ. Signed on 2006-06-30. Completion date: 2007-10-30.
$1,976,000 with Navy for Defense Electronics and Communication Equipment -- Advanced Development (R&D). Signed on 1999-10-13. Completion date: 2001-01-15.
$1,876,000 with Navy for Other Defense -- Applied Research and Exploratory Development (R&D). Signed on 2003-10-06. Completion date: 2005-11-22.
$1,473,000, same as above.Signed on 2006-01-05. Completion date: 2006-11-30.
DYNAMIC RESPONSE INC (15207 VALLEY VISTA BLVD; small business) : $485,678 in 5 contractsfrom 2001 to 2003
Contracts for Defense Electronics and Communication Equipment -- Advanced Development (R&D), Defense Electronics and Communication Equipment -- Applied Research and Exploratory Development (R&D) by Navy Signed by year:2000: $0; 2001: $235,715; 2002: $53,963; 2003: $196,000; 2004: $0; 2005: $0; 2006: $0.
Biggest contracts:
$196,000 with Navy for Defense Electronics and Communication Equipment -- Advanced Development (R&D). Signed on 2003-12-18. Completion date: 2005-08-18.
$148,427 with Navy for Defense Electronics and Communication Equipment -- Applied Research and Exploratory Development (R&D). Signed on 2001-11-07. Completion date: 2003-03-06.
$53,963, same as above.Signed on 2002-12-10. Completion date: 2003-12-09.
$44,998, same as above.Signed on 2001-05-24. Completion date: 2002-03-30.
SY TECHNOLOGY INC (5170 SEPULVEDA BLVD #240; small business) : $437,838 in 3 contractsfrom 2002 to 2003
$375,000 with Air Force for Defense Missile and Space Systems -- Basic Research (R&D). Signed on 2003-02-21. Completion date: 2005-05-23.
$68,296 with Army for Defense Missile and Space Systems -- Advanced Development (R&D). Signed on 2002-12-17. Completion date: 2003-06-09.
-$5,458 with Army for Defense Missile and Space Systems -- Advanced Development (R&D). Taking place in VA. Signed on 2003-09-26. Completion date: 1998-09-30.
PREMIERE RADIO NETWORKS INC (15260 VENTURA BLVD STE 500) : $293,786 in 6 contractsfrom 2001 to 2005
Contracts for Miscellaneous Items by American Forces Information Service, Department of Defense Signed by year:2000: $0; 2001: $68,110; 2002: $77,503; 2003: $72,258; 2004: $0; 2005: $75,915; 2006: $0.
Biggest contracts:
$75,915 with American Forces Information Service for Miscellaneous Items. Signed on 2005-08-03. Completion date: 2006-09-25.
$72,258 with Department of Defense for Miscellaneous Items. Signed on 2003-06-18. Completion date: 2005-09-25.
$70,153, same as above.Signed on 2002-07-18. Completion date: 2005-09-25.
$68,110, same as above.Signed on 2001-06-01. Completion date: 2005-09-25.
BLUE CHIP INVENTORY SERVICE, I (14852 VENTURA BLVD STE 210; small business) : $192,597 in 11 contractsfrom 2003 to 2006
Contracts for Material Handling Equipment, Nonself-Propelled, Other Management Support Services, Accounting Services (NOTE: New code created for Financial Services See R710 below), Other Professional Services by Air Force, Defense Commissary Agency, Department of Defense, Army, and others Signed by year:2000: $0; 2001: $0; 2002: $0; 2003: $0; 2004: $3,172; 2005: $9,446; 2006: $179,979.
Biggest contracts:
$173,114 with Air Force for Material Handling Equipment, Nonself-Propelled. Signed on 2006-02-07. Completion date: 2006-11-14.
$5,290 with Defense Commissary Agency for Other Management Support Services. Signed on 2005-03-17. Completion date: 2005-05-16.
$4,996 with Department of Defense for Accounting Services (NOTE: New code created for Financial Services See R710 below). Signed on 2006-02-01. Completion date: 2006-03-12.
$3,094, same as above.Signed on 2006-03-03. Completion date: 2006-04-24.
ADVANCE DESIGN INFORMATION (15366 LONGBOW DR; small business) : $149,699 in 2 contractsin 2003
$109,699 with Navy for Other Defense -- Applied Research and Exploratory Development (R&D). Signed on 2003-07-11. Completion date: 2003-12-31.
$40,000, same as above.Signed on 2003-09-11. Completion date: 2004-03-31.
AEROBICS & FITNESS ASSOCIATION (15250 VENTURA BLVD # 200; small business) : $135,000 in 3 contractsfrom 2002 to 2005
$52,000 with Air Force for Other Education and Training Services. Taking place in HI. Signed on 2005-05-10. Completion date: 2005-08-31.
$48,000, same as above.Signed on 2004-05-28. Completion date: 2004-08-31.
$35,000, same as above.Signed on 2002-09-21. Completion date: 2003-03-31.
GRANADA INTERNATIONAL MEDIA (15303 VENTURA BLVD BLDG C; small business) : $28,878 in 2 contractsfrom 2004 to 2005
$18,630 with American Forces Information Service for Miscellaneous Items. Signed on 2005-05-31. Completion date: 2005-07-01.
$10,248, same as above.Signed on 2004-11-18. Completion date: 2004-11-22.
BAR LEV, NOAM (14622 VENTURA BLVD; small business)
$18,131 with Navy for Specialized Shipping and Storage Containers. Signed on 2006-04-21. Completion date: 2006-05-26.
Top industries in this zip code by the number of employees in 2005:
2005 - 2018 National Fire Incident Reporting System (NFIRS) incidents
According to the data from the years 2005 - 2018 the average number of fires per year is 60. The highest number of fires - 96 took place in 2017, and the least - 41 in 2012. The data has a growing trend.
When looking into fire subcategories, the most reports belonged to: Structure Fires (44.5%), and Mobile Property/Vehicle Fires (28.3%).
Fire incident types reported to NFIRS in Zip Code 91403

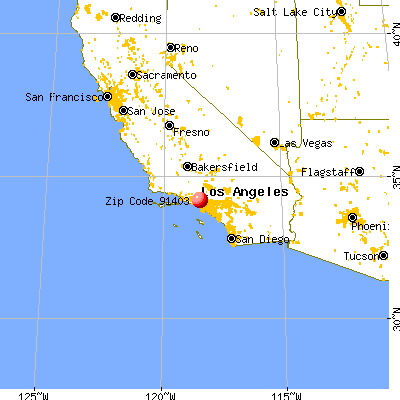


 Nearest zip codes: 91436, 91423, 91411, 90077, 91401, 91316.


 According to the data from the years 2005 - 2018 the average number of fires per year is 60. The highest number of fires - 96 took place in 2017, and the least - 41 in 2012. The data has a growing trend.
 When looking into fire subcategories, the most reports belonged to: Structure Fires (44.5%), and Mobile Property/Vehicle Fires (28.3%).