Estimated zip code population in 2022: 31,523 Zip code population in 2010: 30,991 Zip code population in 2000: 29,370
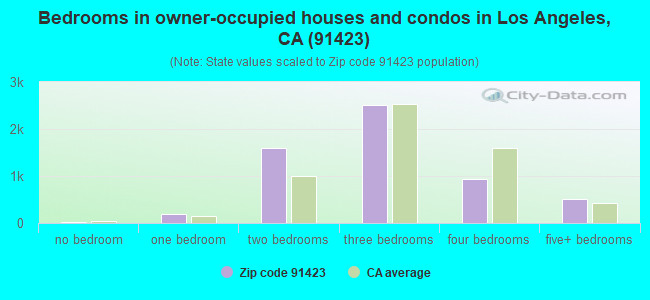
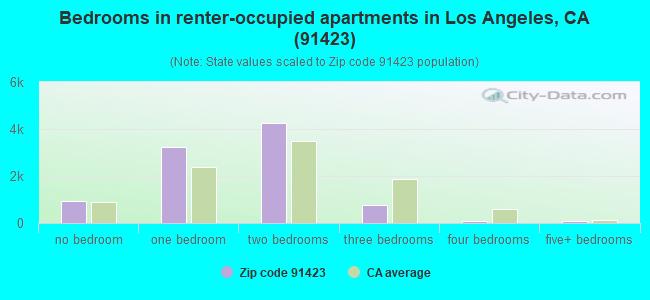
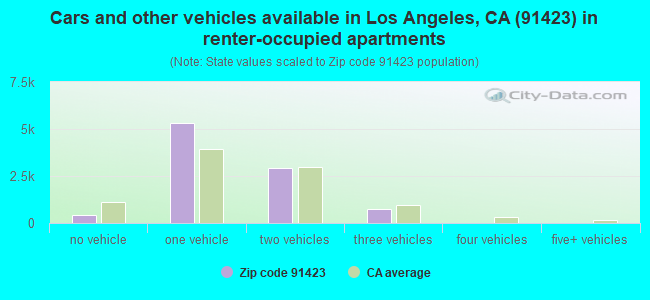
Houses and condos: 16,558 Renter-occupied apartments: 9,369
% of renters here:
62%
State:
44%
March 2022 cost of living index in zip code 91423: 142.7 (very high, U.S. average is 100)
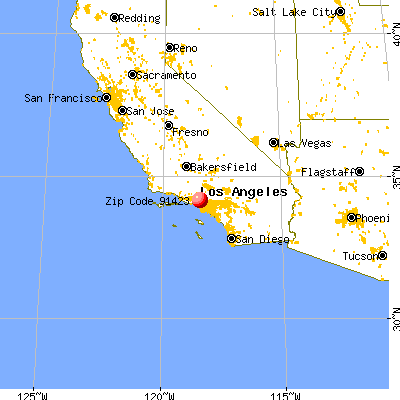
Land area: 4.4 sq. mi. Water area: 0.0 sq. mi.
Population density: 7,225 people per square mile
(high).
OSM Map
General Map
Google Map
MSN Map
OSM Map
General Map
Google Map
MSN Map
OSM Map
General Map
Google Map
MSN Map
OSM Map
General Map
Google Map
MSN Map
Please wait while loading the map...
Real estate property taxes paid for housing units in 2022:
This zip code:
0.6% ($8,614)
California:
0.7% ($4,831)
Median real estate property taxes paid for housing units with mortgages in 2022: $9,216 (0.7%) Median real estate property taxes paid for housing units with no mortgage in 2022: $7,520 (0.5%)
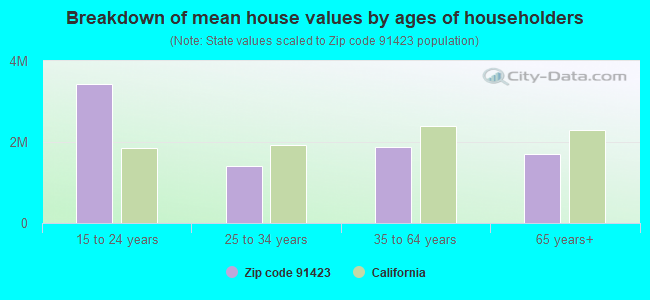
Estimated median house/condo value in 2022: $1,364,043
91423:
$1,364,043
California:
$715,900
According to our research of California and other state lists, there were 13 registered sex offenders living in 91423 zip code as of April 27, 2024. The ratio of all residents to sex offenders in zip code 91423 is 2,664 to 1. The ratio of registered sex offenders to all residents in this zip code is much lower than the state average.
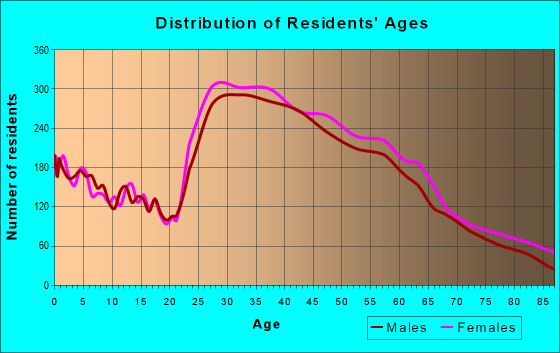
Median resident age:
This zip code:
40.7 years
California median age:
37.9 years
Average household size:
This zip code:
2.1 people
California:
2.8 people
Averages for the 2020 tax year for zip code 91423, filed in 2021:
Average Adjusted Gross Income (AGI) in 2020: $145,378 (Individual Income Tax Returns)
Here:
$145,378
State:
$95,910
Salary/wage: $112,974 (reported on 77.1% of returns)
Here:
$112,974
State:
$77,331
(% of AGI for various income ranges: 1074.8% for AGIs below $25k, 4027.8% for AGIs $25k-50k, 7688.7% for AGIs $50k-75k, 12184.8% for AGIs $75k-100k, 21496.5% for AGIs $100k-200k, 157382.5% for AGIs over 200k)
Taxable interest for individuals: $3,428 (reported on 41.5% of returns)
This zip code:
$3,428
California:
$2,294
(% of AGI for various income ranges: 48.1% for AGIs below $25k, 49.9% for AGIs $25k-50k, 78.7% for AGIs $50k-75k, 141.9% for AGIs $75k-100k, 280.2% for AGIs $100k-200k, 2858.6% for AGIs over 200k)
Ordinary dividends: $15,046 (reported on 32.4% of returns)
Here:
$15,046
State:
$10,949
(% of AGI for various income ranges: 69.7% for AGIs below $25k, 115.4% for AGIs $25k-50k, 186.2% for AGIs $50k-75k, 297.3% for AGIs $75k-100k, 683.7% for AGIs $100k-200k, 11455.8% for AGIs over 200k)
Net capital gain/loss in AGI: +$42,398 (reported on 32.2% of returns)
Here:
+$42,398
State:
+$49,306
(% of AGI for various income ranges: 31.7% for AGIs below $25k, 85.2% for AGIs $25k-50k, 183.8% for AGIs $50k-75k, 325.6% for AGIs $75k-100k, 1011.1% for AGIs $100k-200k, 37274.4% for AGIs over 200k)
Profit/loss from business: +$20,206 (reported on 31.6% of returns)
Here:
+$20,206
State:
+$15,671
(% of AGI for various income ranges: 306.9% for AGIs below $25k, 487.7% for AGIs $25k-50k, 652.7% for AGIs $50k-75k, 620.6% for AGIs $75k-100k, 1524.7% for AGIs $100k-200k, 10298.0% for AGIs over 200k)
Taxable individual retirement arrangement distribution: $23,694 (reported on 7.1% of returns)
91423:
$23,694
California:
$23,505
(% of AGI for various income ranges: 55.3% for AGIs below $25k, 85.5% for AGIs $25k-50k, 164.8% for AGIs $50k-75k, 268.0% for AGIs $75k-100k, 653.6% for AGIs $100k-200k, 2237.3% for AGIs over 200k)
Self-employed (Keogh) retirement plans: $30,355 (reported on 2.3% of returns)
91423:
$30,355
California:
$30,163
(% of AGI for various income ranges: 12.3% for AGIs $25k-50k, 40.4% for AGIs $50k-75k, 122.7% for AGIs $100k-200k, 1648.6% for AGIs over 200k)
Total itemized deductions: $42,506 (reported on 21.6% of returns)
Here:
$42,506
State:
$39,517
(% of AGI for various income ranges: 229.3% for AGIs below $25k, 324.4% for AGIs $25k-50k, 585.5% for AGIs $50k-75k, 1082.4% for AGIs $75k-100k, 2727.3% for AGIs $100k-200k, 16250.0% for AGIs over 200k)
Charity contributions: $8,547 (reported on 18.4% of returns)
Here:
$8,547
State:
$12,598
(% of AGI for various income ranges: 8.0% for AGIs below $25k, 22.0% for AGIs $25k-50k, 51.1% for AGIs $50k-75k, 113.7% for AGIs $75k-100k, 311.9% for AGIs $100k-200k, 3606.6% for AGIs over 200k)
Taxes paid: $9,229 (reported on 21.6% of returns)
91423:
$9,229
State:
$8,807
(% of AGI for various income ranges: 44.7% for AGIs below $25k, 73.8% for AGIs $25k-50k, 144.8% for AGIs $50k-75k, 321.1% for AGIs $75k-100k, 747.8% for AGIs $100k-200k, 3013.4% for AGIs over 200k)
Earned income credit: $1,183 (reported on 8.9% of returns)
Here:
$1,183
State:
$2,074
(% of AGI for various income ranges: 51.4% for AGIs below $25k, 30.9% for AGIs $25k-50k)
Percentage of individuals using paid preparers for their 2020 taxes: 93.6%
Here:
94%
State:
92%
(% for various income ranges: 91.5% for AGIs below $25k, 93.2% for AGIs $25k-50k, 93.8% for AGIs $50k-75k, 93.3% for AGIs $75k-100k, 95.2% for AGIs $100k-200k, 96.2% for AGIs over 200k)
Averages for the 2012 tax year for zip code 91423, filed in 2013:
Average Adjusted Gross Income (AGI) in 2012: $104,260 (Individual Income Tax Returns)
Here:
$104,260
State:
$72,726
Salary/wage: $84,159 (reported on 78.8% of returns)
Here:
$84,159
State:
$59,079
(% of AGI for various income ranges: 62.6% for AGIs below $25k, 74.5% for AGIs $25k-50k, 75.7% for AGIs $50k-75k, 74.1% for AGIs $75k-100k, 72.4% for AGIs $100k-200k, 55.6% for AGIs over 200k)
Taxable interest for individuals: $2,631 (reported on 43.3% of returns)
This zip code:
$2,631
California:
$2,146
(% of AGI for various income ranges: 2.1% for AGIs below $25k, 1.2% for AGIs $25k-50k, 1.0% for AGIs $50k-75k, 1.2% for AGIs $75k-100k, 1.1% for AGIs $100k-200k, 1.0% for AGIs over 200k)
Ordinary dividends: $9,368 (reported on 29.0% of returns)
Here:
$9,368
State:
$9,308
(% of AGI for various income ranges: 3.1% for AGIs below $25k, 1.7% for AGIs $25k-50k, 1.7% for AGIs $50k-75k, 2.5% for AGIs $75k-100k, 2.0% for AGIs $100k-200k, 3.1% for AGIs over 200k)
Net capital gain/loss in AGI: +$24,361 (reported on 26.6% of returns)
Here:
+$24,361
State:
+$30,460
(% of AGI for various income ranges: 0.9% for AGIs $25k-50k, 0.4% for AGIs $50k-75k, 0.7% for AGIs $75k-100k, 1.7% for AGIs $100k-200k, 10.7% for AGIs over 200k)
Profit/loss from business: +$18,574 (reported on 31.2% of returns)
Here:
+$18,574
State:
+$17,064
(% of AGI for various income ranges: 20.4% for AGIs below $25k, 9.7% for AGIs $25k-50k, 6.3% for AGIs $50k-75k, 5.4% for AGIs $75k-100k, 6.2% for AGIs $100k-200k, 3.7% for AGIs over 200k)
Taxable individual retirement arrangement distribution: $22,011 (reported on 8.9% of returns)
91423:
$22,011
California:
$19,557
(% of AGI for various income ranges: 2.7% for AGIs below $25k, 1.8% for AGIs $25k-50k, 2.5% for AGIs $50k-75k, 2.4% for AGIs $75k-100k, 2.5% for AGIs $100k-200k, 1.4% for AGIs over 200k)
Self-employment retirement plans: $27,173 (reported on 2.2% of returns)
91423:
$27,173
California:
$24,530
(% of AGI for various income ranges: 0.2% for AGIs $25k-50k, 0.2% for AGIs $50k-75k, 0.3% for AGIs $75k-100k, 0.6% for AGIs $100k-200k, 0.8% for AGIs over 200k)
Total itemized deductions: $40,891 (22% of AGI, reported on 45.6% of returns)
Here:
$40,891
State:
$34,004
Here:
21.8% of AGI
State:
22.7% of AGI
(% of AGI for various income ranges: 19.1% for AGIs below $25k, 14.3% for AGIs $25k-50k, 16.2% for AGIs $50k-75k, 19.7% for AGIs $75k-100k, 21.3% for AGIs $100k-200k, 17.1% for AGIs over 200k)
Charity contributions: $4,371 (reported on 38.4% of returns)
Here:
$4,371
State:
$4,659
(% of AGI for various income ranges: 0.8% for AGIs below $25k, 1.1% for AGIs $25k-50k, 1.4% for AGIs $50k-75k, 1.6% for AGIs $75k-100k, 1.7% for AGIs $100k-200k, 1.7% for AGIs over 200k)
Taxes paid: $19,197 (reported on 45.5% of returns)
91423:
$19,197
State:
$14,448
(% of AGI for various income ranges: 3.7% for AGIs below $25k, 3.1% for AGIs $25k-50k, 4.6% for AGIs $50k-75k, 6.8% for AGIs $75k-100k, 8.5% for AGIs $100k-200k, 10.2% for AGIs over 200k)
Earned income credit: $1,318 (reported on 11.2% of returns)
Here:
$1,318
State:
$2,286
(% of AGI for various income ranges: 3.1% for AGIs below $25k, 0.4% for AGIs $25k-50k)
Percentage of individuals using paid preparers for their 2012 taxes: 68.0%
Here:
68%
State:
64%
(% for various income ranges: 61.7% for AGIs below $25k, 61.4% for AGIs $25k-50k, 66.8% for AGIs $50k-75k, 70.8% for AGIs $75k-100k, 77.2% for AGIs $100k-200k, 87.0% for AGIs over 200k)
Averages for the 2004 tax year for zip code 91423, filed in 2005:
Average Adjusted Gross Income (AGI) in 2004: $78,656 (Individual Income Tax Returns)
Here:
$78,656
State:
$58,600
Salary/wage: $67,793 (reported on 78.4% of returns)
Here:
$67,793
State:
$49,455
(% of AGI for various income ranges: 67.9% for AGIs $10k-25k, 80.0% for AGIs $25k-50k, 77.6% for AGIs $50k-75k, 75.6% for AGIs $75k-100k, 59.8% for AGIs over 100k)
Taxable interest for individuals: $3,017 (reported on 54.1% of returns)
This zip code:
$3,017
California:
$2,365
(% of AGI for various income ranges: 4.2% for AGIs $10k-25k, 1.7% for AGIs $25k-50k, 2.2% for AGIs $50k-75k, 2.0% for AGIs $75k-100k, 1.7% for AGIs over 100k)
Taxable dividends: $6,099 (reported on 33.9% of returns)
Here:
$6,099
State:
$4,746
(% of AGI for various income ranges: 3.3% for AGIs $10k-25k, 1.5% for AGIs $25k-50k, 1.6% for AGIs $50k-75k, 1.7% for AGIs $75k-100k, 2.8% for AGIs over 100k)
Net capital gain/loss: +$18,313 (reported on 31.2% of returns)
Here:
+$18,313
State:
+$23,418
(% of AGI for various income ranges: 0.4% for AGIs $10k-25k, 0.4% for AGIs $25k-50k, 0.9% for AGIs $50k-75k, 1.4% for AGIs $75k-100k, 10.5% for AGIs over 100k)
Profit/loss from business: +$18,135 (reported on 29.4% of returns)
Here:
+$18,135
State:
+$16,826
(% of AGI for various income ranges: 14.0% for AGIs $10k-25k, 7.5% for AGIs $25k-50k, 5.1% for AGIs $50k-75k, 6.7% for AGIs $75k-100k, 6.1% for AGIs over 100k)
IRA payment deduction: $3,167 (reported on 3.9% of returns)
91423:
$3,167
California:
$3,192
(% of AGI for various income ranges: 0.4% for AGIs $10k-25k, 0.3% for AGIs $25k-50k, 0.2% for AGIs $50k-75k, 0.2% for AGIs $75k-100k, 0.1% for AGIs over 100k)
Self-employed pension: $19,752 (reported on 3.2% of returns)
Here:
$19,752
California:
$17,688
(% of AGI for various income ranges: 0.3% for AGIs $10k-25k, 0.3% for AGIs $25k-50k, 0.4% for AGIs $50k-75k, 0.7% for AGIs $75k-100k, 1.0% for AGIs over 100k)
Total itemized deductions: $37,430 (27% of AGI, reported on 47.4% of returns)
Here:
$37,430
State:
$28,113
Here:
27.1% of AGI
State:
25.3% of AGI
(% of AGI for various income ranges: 20.8% for AGIs $10k-25k, 17.2% for AGIs $25k-50k, 20.5% for AGIs $50k-75k, 22.7% for AGIs $75k-100k, 22.8% for AGIs over 100k)
Charity contributions deductions: $3,839 (3% of AGI, reported on 42.8% of returns)
Here:
$3,839
State:
$3,923
Here:
2.7% of AGI
State:
3.3% of AGI
(% of AGI for various income ranges: 1.6% for AGIs $10k-25k, 1.7% for AGIs $25k-50k, 2.0% for AGIs $50k-75k, 2.2% for AGIs $75k-100k, 2.1% for AGIs over 100k)
Total tax: $16,572 (reported on 84.6% of returns)
91423:
$16,572
State:
$10,761
(% of AGI for various income ranges: 6.3% for AGIs $10k-25k, 9.1% for AGIs $25k-50k, 11.4% for AGIs $50k-75k, 12.7% for AGIs $75k-100k, 21.2% for AGIs over 100k)
Earned income credit: $1,091 (reported on 8.8% of returns)
Here:
$1,091
State:
$1,763
Percentage of individuals using paid preparers for their 2004 taxes: 71.7%
Here:
72%
State:
66%
(% for various income ranges: 68.9% for AGIs below $10k, 66.0% for AGIs $10k-25k, 65.5% for AGIs $25k-50k, 71.6% for AGIs $50k-75k, 76.4% for AGIs $75k-100k, 85.9% for AGIs over 100k)
Likely homosexual households (counted as self-reported same-sex unmarried-partner households)
Lesbian couples: 0.3% of all households
Gay men: 0.5% of all households
Household received Food Stamps/SNAP in the past 12 months: 671 Household did not receive Food Stamps/SNAP in the past 12 months: 14,224
Women who had a birth in the past 12 months: 237 (192 now married, 44 unmarried) Women who did not have a birth in the past 12 months: 8,286 (2,987 now married, 5,311 unmarried)
Housing units in zip code 91423 with a mortgage: 4,300 (465 second mortgage, 447 both second mortgage and home equity loan) Houses without a mortgage: 118
Median monthly owner costs for units with a mortgage: $3,876 Median monthly owner costs for units without a mortgage: $1,418
Residents with income below the poverty level in 2022:
This zip code:
8.0%
Whole state:
12.2%
Residents with income below 50% of the poverty level in 2022:
This zip code:
3.5%
Whole state:
6.2%
Median number of rooms in houses and condos:
Here:
6.2
State:
6.0
Median number of rooms in apartments:
Here:
3.6
State:
3.9
Notable locations in this zip code not listed on our city pages
Notable locations in zip code 91423: Sherman Oaks Branch Los Angeles Public Library (A), City of Los Angeles Fire Department Station 99 (B). Display/hide their locations on the map
Churches in zip code 91423 include: Church of the Chimes (A), Saint Francis De Sales Catholic Church (B), Sherman Oaks United Methodist Church (C). Display/hide their locations on the map
3,506 married couples with children.
1,175 single-parent households (358 men, 817 women).
71.4% of residents of 91423 zip code speak English at home.
9.0% of residents speak Spanish at home (84% very well, 11% well, 4% not well, 1% not at all).
13.8% of residents speak other Indo-European language at home (79% very well, 16% well, 5% not well).
2.8% of residents speak Asian or Pacific Island language at home (70% very well, 20% well, 9% not well, 1% not at all).
3.2% of residents speak other language at home (89% very well, 9% well, 2% not well).
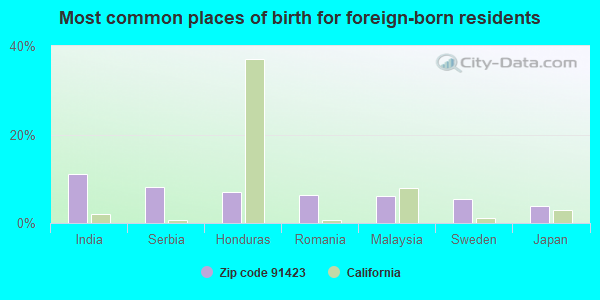
Foreign born population: 6,653 (21.1%) (66.6% of them are naturalized citizens)
This zip code:
21.1%
Whole state:
26.7%
11%India
8%Serbia
7%Honduras
6%Romania
6%Malaysia
6%Sweden
4%Japan
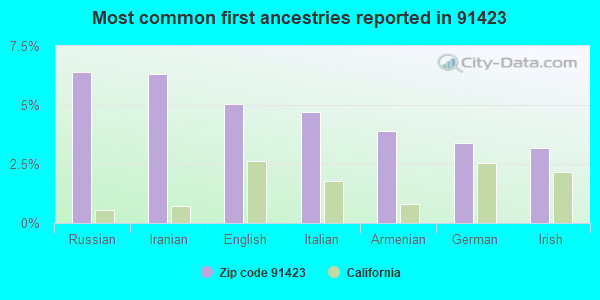
6%Russian
6%Iranian
5%English
5%Italian
4%Armenian
3%German
3%Irish
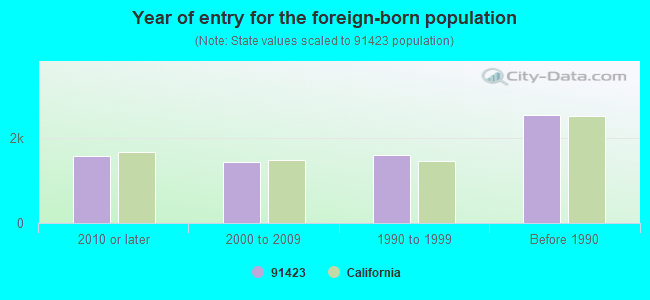
Year of entry for the foreign-born population
1,5822010 or later
1,4212000 to 2009
1,5941990 to 1999
2,533Before 1990
Facilities with environmental interests located in this zip code:
JOY CLEANERS (13313 MOORE PARK in SHERMAN OAKS, CA)
STATE MASTER (California - Hazardous Waste Tracking) - HAZARDOU WASTE PROGRAM Small Quantity Generators, between 100 kg and 1000 kg of hazardous waste/month (Resource Conservation and Recovery Act (tracking hazardous waste)) - notification Organizations: KWANG YOUN WOO (CONTACT/OWNER)
CASA DE CADILLAC (14401 VENTURA BLVD in SHERMAN OAKS, CA)
STATE MASTER (California - Hazardous Waste Tracking) - HAZARDOU WASTE PROGRAM Small Quantity Generators, between 100 kg and 1000 kg of hazardous waste/month (Resource Conservation and Recovery Act (tracking hazardous waste)) - notification Organizations: WILSON JAMES N (CONTACT/OWNER)
MILLIKAN (ROBERT A.) MIDDLE (5041 SUNNYSLOPE AVE. in SHERMAN OAKS, CA)
(National Center for Education Statistics) - STATE ID-6058150 Organizations: LOS ANGELES UNIFIED (SCHOOL DISTRICT)
EXXONMOBIL OIL CORP. (13272 MOORPARK ST in SHERMAN OAKS, CA)
HAZARDOUS WASTE BIENNIAL REPORTER (Resource Conservation and Recovery Act (tracking hazardous waste)) Large Quantity Generators, more that 1000 kg of hazardous waste/month (Resource Conservation and Recovery Act (tracking hazardous waste)) Organizations: EXXONMOBIL OIL CORPORATION (CONTACT/OWNER)
ANGEL CLEANERS (13909 VENTURA BLVD in SHERMAN OAKS, CA)
Small Quantity Generators, between 100 kg and 1000 kg of hazardous waste/month (Resource Conservation and Recovery Act (tracking hazardous waste)) Organizations: JILLA PAYDAR (CONTACT/OPERATOR)
, MASSOUD JARADI (CONTACT/OWNER)
MAGIC TOUCH CLEANERS (14020 VENTURA BLVD in SHERMAN OAKS, CA)
Small Quantity Generators, between 100 kg and 1000 kg of hazardous waste/month (Resource Conservation and Recovery Act (tracking hazardous waste)) - notification Organizations: HONG SE (CONTACT/OWNER)
CHUCKS AUTO REPAIR (13256 RIVERSIDE DRIVE in SHERMAN OAKS, CA)
Small Quantity Generators, between 100 kg and 1000 kg of hazardous waste/month (Resource Conservation and Recovery Act (tracking hazardous waste)) Organizations: HILL, CHARLES (CONTACT/OWNER)
MR DRY CLEAN (13351 RIVERSIDE DR in SHERMAN OAKS, CA)
Small Quantity Generators, between 100 kg and 1000 kg of hazardous waste/month (Resource Conservation and Recovery Act (tracking hazardous waste)) - notification Organizations: KO HYUNG SO (CONTACT/OWNER)
CELEBRITY CLEANERS (14352 VENTURA BLVD in SHERMAN OAKS, CA)
Small Quantity Generators, between 100 kg and 1000 kg of hazardous waste/month (Resource Conservation and Recovery Act (tracking hazardous waste)) - notification Organizations: ZISLE YEUGENIA (CONTACT/OWNER)
KITS CAMERA 1 HOUR NO 87 (14006 RIVERSIDE DR STE 86 in SHERMAN OAKS, CA)
Small Quantity Generators, between 100 kg and 1000 kg of hazardous waste/month (Resource Conservation and Recovery Act (tracking hazardous waste)) - notification Organizations: RITS CAMERA CENTERS INC (CONTACT/OWNER)
LOS ANGELES FIRE STA 109 (16500 MULHOLLAND DR in SHERMAN OAKS, CA)
Small Quantity Generators, between 100 kg and 1000 kg of hazardous waste/month (Resource Conservation and Recovery Act (tracking hazardous waste))
MEMMOT CLEANERS (13357 VENTURA BLVD in SHERMAN OAKS, CA)
Small Quantity Generators, between 100 kg and 1000 kg of hazardous waste/month (Resource Conservation and Recovery Act (tracking hazardous waste)) - notification Organizations: BERJOUHI (CONTACT/OWNER)
CHEVRON STATION 9 1683 (14061 RIVERSIDE DR in SHERMAN OAKS, CA)
Small Quantity Generators, between 100 kg and 1000 kg of hazardous waste/month (Resource Conservation and Recovery Act (tracking hazardous waste))
Housing units lacking complete plumbing facilities: 0.3% Housing units lacking complete kitchen facilities: 2.0%
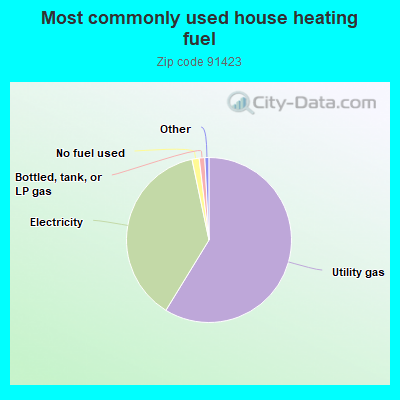
58.7%Utility gas
37.9%Electricity
1.4%No fuel used
1.1%Bottled, tank, or LP gas
Population in 1990: 27,747. Population change in the 1990s: +1,623 (+5.8%).
Place of birth for U.S.-born residents:
This state: 13,732
Northeast: 4,048
Midwest: 3,038
South: 2,237
West: 1,127
48% of the 91423 zip code residents lived in the same house 5 years ago. Out of people who lived in different houses, 73% lived in this county. Out of people who lived in different counties, 50% lived in California.
87% of the 91423 zip code residents lived in the same house 1 year ago. Out of people who lived in different houses, 79% moved from this county. Out of people who lived in different houses, 7% moved from different county within same state. Out of people who lived in different houses, 8% moved from different state. Out of people who lived in different houses, 2% moved from abroad.
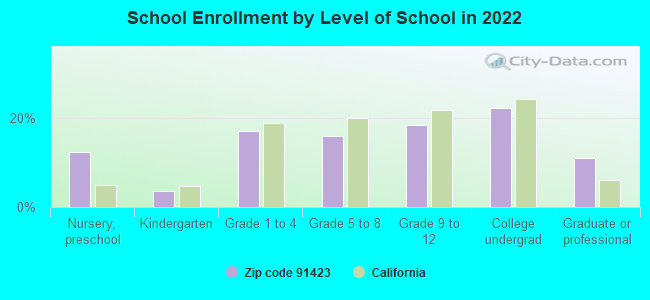
Private vs. public school enrollment:
Students in private schools in grades 1 to 8 (elementary and middle school): 915
Here:
45.9%
California:
10.5%
Students in private schools in grades 9 to 12 (high school): 539
Here:
50.0%
California:
8.5%
Students in private undergraduate colleges: 166
Here:
12.8%
California:
15.9%
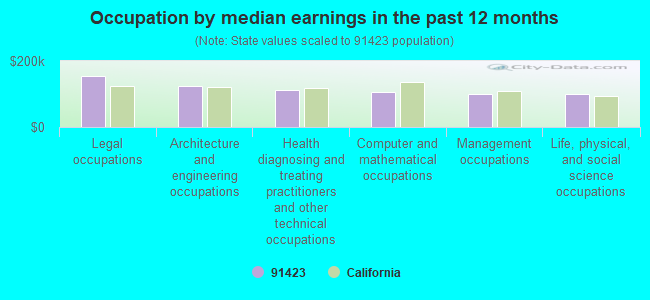
Occupation by median earnings in the past 12 months ($)
155,719Legal occupations
125,606Architecture and engineering occupations
112,944Health diagnosing and treating practitioners and other technical occupations
106,706Computer and mathematical occupations
100,370Management occupations
99,677Life, physical, and social science occupations
Companies with federal contracts located in this zip code:
SUNKIST GROWERS INC (14130 RIVERSIDE DR M/S 37 in SHERMAN OAKS, CA; small business) : $1,819,998 in 149 contractsfrom 2004 to 2006
Contracts for Fruits and Vegetables by Defense Logistics Agency Signed by year:2000: $0; 2001: $0; 2002: $0; 2003: $0; 2004: $156,752; 2005: $1,393,369; 2006: $269,877.
Biggest contracts:
$42,261 with Defense Logistics Agency for Fruits and Vegetables. Signed on 2005-07-21. Completion date: 2005-07-21.
$41,166, same as above.Signed on 2005-05-06. Completion date: 2005-05-06.
$40,350, same as above.Signed on 2004-12-05. Completion date: 2004-12-05.
$33,247, same as above.Signed on 2005-07-27. Completion date: 2005-07-27.
PERCEPTRONICS SOLUTIONS, INC (3527 BEVERLY GLEN TER in SHERMAN OAKS, CA; small business) : $1,816,878 in 11 contractsfrom 2003 to 2006
Contracts for Other Defense -- Applied Research and Exploratory Development (R&D), Services -- Applied Research and Exploratory Development (R&D) by Army, Navy Signed by year:2000: $0; 2001: $0; 2002: $0; 2003: $168,955; 2004: $563,966; 2005: $708,958; 2006: $374,999.
Biggest contracts:
$374,999 with Army for Other Defense -- Applied Research and Exploratory Development (R&D). Signed on 2006-04-04. Completion date: 2008-06-30.
$364,982 with Navy for Services -- Applied Research and Exploratory Development (R&D). Signed on 2004-11-08. Completion date: 2006-11-30.
$364,972, same as above.Signed on 2005-09-28. Completion date: 2006-11-30.
$195,000, same as above.Signed on 2005-08-03. Completion date: 2006-11-30.
AMERICAN INSURANCE CONSULTANTS (13245 RVERSIDE DR FL 6 in VAN NUYS, CA; small business) 140 employees, $10900000 revenue. : $917,356 in 51 contractsfrom 2001 to 2006
Contracts for Lease or Rental of Facilities -- Office Buildings by Public Buildings Service Signed by year:2000: $0; 2001: $68,000; 2002: $169,810; 2003: $394,849; 2004: $34,095; 2005: $147,921; 2006: $102,681.
Biggest contracts:
$78,000 with Public Buildings Service for Lease or Rental of Facilities -- Office Buildings. Signed on 2003-03-15. Completion date: 2003-09-15.
$34,000, same as above.Signed on 2002-06-15. Completion date: 2002-06-15.
$34,000, same as above.Signed on 2002-09-15. Completion date: 2002-09-15.
$34,000, same as above.Signed on 2002-03-15. Completion date: 2002-03-15.
MARY L. ZANDER (5003 TILDEN AVENUE #205 in SHERMAN OAKS, CA; small business) : $205,094 in 11 contractsfrom 2000 to 2004
Contracts for Other Professional Services by Office of Assistant Secretary for Health except national centers (disused code), Health Resources and Services Administration Signed by year:2000: $62,000; 2001: $64,000; 2002: $28,000; 2003: $55,291; 2004: -$4,197; 2005: $0; 2006: $0.
Biggest contracts:
$39,018 with Office of Assistant Secretary for Health except national centers (disused code) for Other Professional Services. Signed on 2003-04-15. Completion date: 2004-04-15.
$37,000, same as above.Signed on 2001-09-15. Completion date: 2002-04-15.
$36,000 with Health Resources and Services Administration for Other Professional Services. Signed on 2000-09-15. Completion date: 2001-04-15.
$28,000 with Office of Assistant Secretary for Health except national centers (disused code) for Other Professional Services. Signed on 2002-04-15. Completion date: 2003-04-15.
CMS GENERAL BUILDING CONTRACTO (13400 RVERSIDE DR STE 112 in SHERMAN OAKS, CA; small business)
$34,000 with Forest Service (disused code: now 12C2) for Lease or Rental of Equipment -- Fire Control Equipment. Taking place in ID. Signed on 2001-10-15. Completion date: 2004-05-15.
BEST PROMOTIONS INC (13400 RVERSIDE DR STE 106 in SHERMAN OAKS, CA) 5 employees, $2500000 revenue
$30,000 with Bureau of the Census for Specialized Flight Clothing and Accessories. Signed on 2000-03-15. Completion date: 2000-03-15.
TECHNICALLY FUNNY INC (13801 VENTURA BLVD in SHERMAN OAKS, CA; small business) : $15,000 in 2 contractsin 2005
$7,500 with Air Force for Lectures For Training. Taking place in TX. Signed on 2005-12-16. Completion date: 2005-12-21.
$7,500 with Air Force for Other Education and Training Services. Taking place in TX. Signed on 2005-12-20. Completion date: 2005-12-29.
WHOLESALE MAILING LISTS, INC (14458 VENTURA BLVD in SHERMAN OAKS, CA; small business)
$6,639 with Navy for Data Collection Services. Signed on 2006-01-20. Completion date: 2006-01-31.
NOTIFICATION TECHNOLOGIES INC (14144 VENTURA BLVD STE 200 in SHERMAN OAKS, CA; small business)
$5,876 with Navy for Miscellaneous Communication Equipment. Signed on 2004-11-08. Completion date: 2005-10-14.
MEEKS, HAROLD D (14431 VENTURA BLVD STE 181 in SHERMAN OAKS, CA; small business) : $4,730 in 3 contractsin 2005
$4,010 with Army for Miscellaneous Printed Matter. Signed on 2005-09-30. Completion date: 2005-10-14.
$3,008 with Bureau of Reclamation for Printing, Duplicating, and Bookbinding Equipment. Signed on 2005-08-15. Completion date: 2005-08-15.
-$2,288, same as above.Signed on 2005-09-28. Completion date: 2005-09-28.
Top industries in this zip code by the number of employees in 2005:
2005 - 2018 National Fire Incident Reporting System (NFIRS) incidents
According to the data from the years 2005 - 2018 the average number of fires per year is 45. The highest number of fires - 65 took place in 2009, and the least - 30 in 2018. The data has a dropping trend.
When looking into fire subcategories, the most reports belonged to: Structure Fires (48.7%), and Outside Fires (24.8%).
Fire incident types reported to NFIRS in Zip Code 91423


 Nearest zip codes: 91401, 91403, 91607, 91411, 91604, 90077.
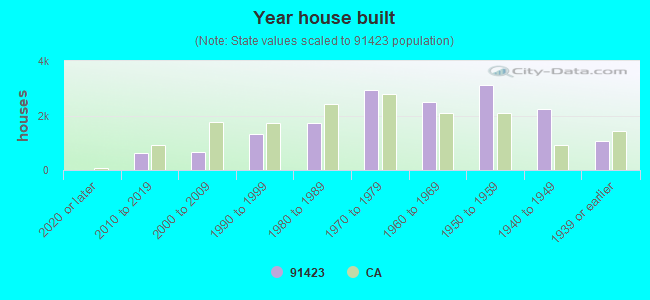


 According to the data from the years 2005 - 2018 the average number of fires per year is 45. The highest number of fires - 65 took place in 2009, and the least - 30 in 2018. The data has a dropping trend.
 When looking into fire subcategories, the most reports belonged to: Structure Fires (48.7%), and Outside Fires (24.8%).