Estimated zip code population in 2022: 76,517 Zip code population in 2010: 74,363 Zip code population in 2000: 68,002
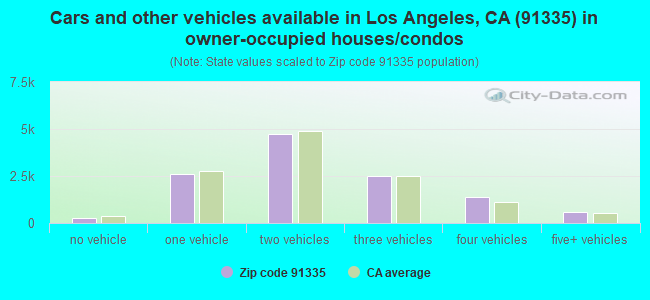
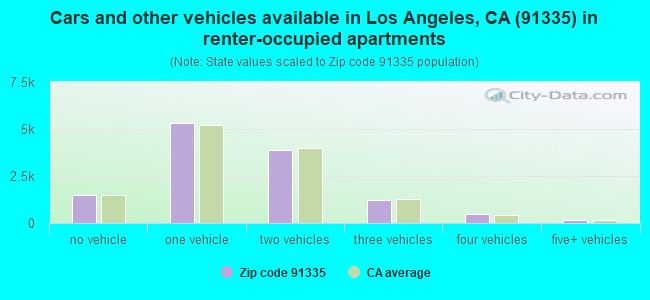
Houses and condos: 25,870 Renter-occupied apartments: 12,619
% of renters here:
51%
State:
44%
March 2022 cost of living index in zip code 91335: 135.6 (high, U.S. average is 100)
Land area: 6.6 sq. mi. Water area: 0.0 sq. mi.
Population density: 11,656 people per square mile
(high).
OSM Map
General Map
Google Map
MSN Map
OSM Map
General Map
Google Map
MSN Map
OSM Map
General Map
Google Map
MSN Map
OSM Map
General Map
Google Map
MSN Map
Please wait while loading the map...
Real estate property taxes paid for housing units in 2022:
This zip code:
0.6% ($4,408)
California:
0.7% ($4,831)
Median real estate property taxes paid for housing units with mortgages in 2022: $4,898 (0.7%) Median real estate property taxes paid for housing units with no mortgage in 2022: $3,131 (0.5%)
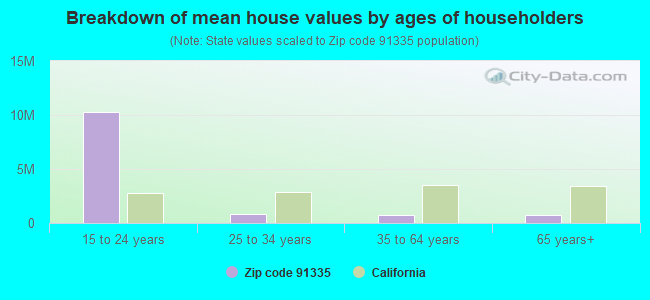
Estimated median house/condo value in 2022: $697,875
91335:
$697,875
California:
$715,900
According to our research of California and other state lists, there were 72 registered sex offenders living in 91335 zip code as of April 27, 2024. The ratio of all residents to sex offenders in zip code 91335 is 1,129 to 1. The ratio of registered sex offenders to all residents in this zip code is lower than the state average.
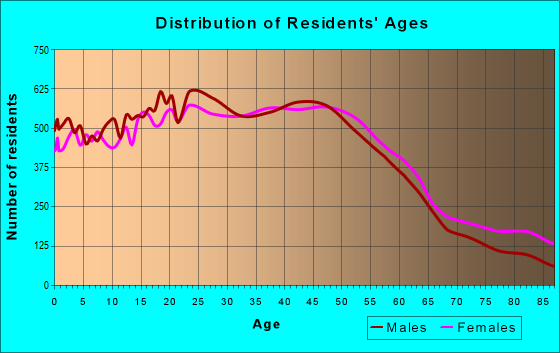
Median resident age:
This zip code:
38.5 years
California median age:
37.9 years
Average household size:
This zip code:
3.0 people
California:
2.8 people
Averages for the 2020 tax year for zip code 91335, filed in 2021:
Average Adjusted Gross Income (AGI) in 2020: $49,850 (Individual Income Tax Returns)
Here:
$49,850
State:
$95,910
Salary/wage: $47,975 (reported on 78.7% of returns)
Here:
$47,975
State:
$77,331
(% of AGI for various income ranges: 1168.6% for AGIs below $25k, 4076.2% for AGIs $25k-50k, 7887.1% for AGIs $50k-75k, 11549.3% for AGIs $75k-100k, 21751.2% for AGIs $100k-200k, 70388.1% for AGIs over 200k)
Taxable interest for individuals: $841 (reported on 24.8% of returns)
This zip code:
$841
California:
$2,294
(% of AGI for various income ranges: 10.4% for AGIs below $25k, 15.3% for AGIs $25k-50k, 36.7% for AGIs $50k-75k, 60.9% for AGIs $75k-100k, 100.8% for AGIs $100k-200k, 780.5% for AGIs over 200k)
Ordinary dividends: $2,754 (reported on 10.2% of returns)
Here:
$2,754
State:
$10,949
(% of AGI for various income ranges: 10.6% for AGIs below $25k, 17.5% for AGIs $25k-50k, 44.4% for AGIs $50k-75k, 79.8% for AGIs $75k-100k, 155.0% for AGIs $100k-200k, 1239.5% for AGIs over 200k)
Net capital gain/loss in AGI: +$8,424 (reported on 11.0% of returns)
Here:
+$8,424
State:
+$49,306
(% of AGI for various income ranges: 4.8% for AGIs below $25k, 16.1% for AGIs $25k-50k, 50.9% for AGIs $50k-75k, 140.5% for AGIs $75k-100k, 498.5% for AGIs $100k-200k, 9388.6% for AGIs over 200k)
Profit/loss from business: +$9,691 (reported on 26.3% of returns)
Here:
+$9,691
State:
+$15,671
(% of AGI for various income ranges: 390.2% for AGIs below $25k, 302.4% for AGIs $25k-50k, 394.2% for AGIs $50k-75k, 524.3% for AGIs $75k-100k, 722.7% for AGIs $100k-200k, 2173.3% for AGIs over 200k)
Taxable individual retirement arrangement distribution: $15,825 (reported on 3.3% of returns)
91335:
$15,825
California:
$23,505
(% of AGI for various income ranges: 22.0% for AGIs below $25k, 31.2% for AGIs $25k-50k, 90.0% for AGIs $50k-75k, 159.0% for AGIs $75k-100k, 356.7% for AGIs $100k-200k, 1420.5% for AGIs over 200k)
Self-employed (Keogh) retirement plans: $14,656 (reported on 0.2% of returns)
91335:
$14,656
California:
$30,163
(% of AGI for various income ranges: 7.5% for AGIs $50k-75k, 26.1% for AGIs $100k-200k, 284.3% for AGIs over 200k)
Total itemized deductions: $28,938 (reported on 11.0% of returns)
Here:
$28,938
State:
$39,517
(% of AGI for various income ranges: 81.6% for AGIs below $25k, 185.1% for AGIs $25k-50k, 586.7% for AGIs $50k-75k, 1183.4% for AGIs $75k-100k, 2350.4% for AGIs $100k-200k, 7192.4% for AGIs over 200k)
Charity contributions: $4,297 (reported on 8.7% of returns)
Here:
$4,297
State:
$12,598
(% of AGI for various income ranges: 3.3% for AGIs below $25k, 16.1% for AGIs $25k-50k, 54.0% for AGIs $50k-75k, 119.3% for AGIs $75k-100k, 304.2% for AGIs $100k-200k, 1414.8% for AGIs over 200k)
Taxes paid: $8,260 (reported on 11.0% of returns)
91335:
$8,260
State:
$8,807
(% of AGI for various income ranges: 17.7% for AGIs below $25k, 47.2% for AGIs $25k-50k, 162.9% for AGIs $50k-75k, 368.4% for AGIs $75k-100k, 732.9% for AGIs $100k-200k, 1715.7% for AGIs over 200k)
Earned income credit: $1,933 (reported on 19.0% of returns)
Here:
$1,933
State:
$2,074
(% of AGI for various income ranges: 100.5% for AGIs below $25k, 71.8% for AGIs $25k-50k, 1.0% for AGIs $50k-75k)
Percentage of individuals using paid preparers for their 2020 taxes: 92.1%
Here:
92%
State:
92%
(% for various income ranges: 89.7% for AGIs below $25k, 92.7% for AGIs $25k-50k, 94.1% for AGIs $50k-75k, 94.5% for AGIs $75k-100k, 94.0% for AGIs $100k-200k, 94.5% for AGIs over 200k)
Averages for the 2012 tax year for zip code 91335, filed in 2013:
Average Adjusted Gross Income (AGI) in 2012: $39,792 (Individual Income Tax Returns)
Here:
$39,792
State:
$72,726
Salary/wage: $39,000 (reported on 82.1% of returns)
Here:
$39,000
State:
$59,079
(% of AGI for various income ranges: 71.3% for AGIs below $25k, 84.9% for AGIs $25k-50k, 83.9% for AGIs $50k-75k, 83.6% for AGIs $75k-100k, 83.5% for AGIs $100k-200k, 56.3% for AGIs over 200k)
Taxable interest for individuals: $833 (reported on 25.9% of returns)
This zip code:
$833
California:
$2,146
(% of AGI for various income ranges: 0.6% for AGIs below $25k, 0.4% for AGIs $25k-50k, 0.4% for AGIs $50k-75k, 0.5% for AGIs $75k-100k, 0.6% for AGIs $100k-200k, 1.5% for AGIs over 200k)
Ordinary dividends: $2,948 (reported on 9.1% of returns)
Here:
$2,948
State:
$9,308
(% of AGI for various income ranges: 0.5% for AGIs below $25k, 0.3% for AGIs $25k-50k, 0.6% for AGIs $50k-75k, 0.5% for AGIs $75k-100k, 0.8% for AGIs $100k-200k, 2.5% for AGIs over 200k)
Net capital gain/loss in AGI: +$4,407 (reported on 7.2% of returns)
Here:
+$4,407
State:
+$30,460
(% of AGI for various income ranges: 0.2% for AGIs $75k-100k, 0.8% for AGIs $100k-200k, 9.7% for AGIs over 200k)
Profit/loss from business: +$10,697 (reported on 23.7% of returns)
Here:
+$10,697
State:
+$17,064
(% of AGI for various income ranges: 19.6% for AGIs below $25k, 6.6% for AGIs $25k-50k, 3.7% for AGIs $50k-75k, 2.9% for AGIs $75k-100k, 2.4% for AGIs $100k-200k, 2.8% for AGIs over 200k)
Taxable individual retirement arrangement distribution: $13,607 (reported on 4.4% of returns)
91335:
$13,607
California:
$19,557
(% of AGI for various income ranges: 1.3% for AGIs below $25k, 1.1% for AGIs $25k-50k, 1.4% for AGIs $50k-75k, 1.6% for AGIs $75k-100k, 1.7% for AGIs $100k-200k, 3.2% for AGIs over 200k)
Self-employment retirement plans: $10,800 (reported on 0.3% of returns)
91335:
$10,800
California:
$24,530
(% of AGI for various income ranges: 0.1% for AGIs $50k-75k, 0.2% for AGIs $100k-200k)
Total itemized deductions: $22,259 (30% of AGI, reported on 29.2% of returns)
Here:
$22,259
State:
$34,004
Here:
30.2% of AGI
State:
22.7% of AGI
(% of AGI for various income ranges: 9.8% for AGIs below $25k, 13.9% for AGIs $25k-50k, 18.2% for AGIs $50k-75k, 19.1% for AGIs $75k-100k, 20.0% for AGIs $100k-200k, 16.8% for AGIs over 200k)
Charity contributions: $2,241 (reported on 22.8% of returns)
Here:
$2,241
State:
$4,659
(% of AGI for various income ranges: 0.4% for AGIs below $25k, 0.9% for AGIs $25k-50k, 1.4% for AGIs $50k-75k, 1.6% for AGIs $75k-100k, 1.9% for AGIs $100k-200k, 1.8% for AGIs over 200k)
Taxes paid: $6,832 (reported on 29.1% of returns)
91335:
$6,832
State:
$14,448
(% of AGI for various income ranges: 1.9% for AGIs below $25k, 3.2% for AGIs $25k-50k, 4.9% for AGIs $50k-75k, 6.0% for AGIs $75k-100k, 7.4% for AGIs $100k-200k, 9.3% for AGIs over 200k)
Earned income credit: $2,238 (reported on 25.9% of returns)
Here:
$2,238
State:
$2,286
(% of AGI for various income ranges: 7.4% for AGIs below $25k, 1.4% for AGIs $25k-50k)
Percentage of individuals using paid preparers for their 2012 taxes: 74.1%
Here:
74%
State:
64%
(% for various income ranges: 73.5% for AGIs below $25k, 76.0% for AGIs $25k-50k, 73.7% for AGIs $50k-75k, 71.7% for AGIs $75k-100k, 73.9% for AGIs $100k-200k, 80.0% for AGIs over 200k)
Averages for the 2004 tax year for zip code 91335, filed in 2005:
Average Adjusted Gross Income (AGI) in 2004: $34,650 (Individual Income Tax Returns)
Here:
$34,650
State:
$58,600
Salary/wage: $34,594 (reported on 84.3% of returns)
Here:
$34,594
State:
$49,455
(% of AGI for various income ranges: 99.3% for AGIs below $10k, 78.3% for AGIs $10k-25k, 87.4% for AGIs $25k-50k, 86.9% for AGIs $50k-75k, 87.5% for AGIs $75k-100k, 75.8% for AGIs over 100k)
Taxable interest for individuals: $994 (reported on 35.8% of returns)
This zip code:
$994
California:
$2,365
(% of AGI for various income ranges: 4.0% for AGIs below $10k, 1.1% for AGIs $10k-25k, 0.8% for AGIs $25k-50k, 0.9% for AGIs $50k-75k, 1.0% for AGIs $75k-100k, 1.2% for AGIs over 100k)
Taxable dividends: $1,506 (reported on 12.5% of returns)
Here:
$1,506
State:
$4,746
(% of AGI for various income ranges: 1.9% for AGIs below $10k, 0.6% for AGIs $10k-25k, 0.4% for AGIs $25k-50k, 0.6% for AGIs $50k-75k, 0.6% for AGIs $75k-100k, 0.6% for AGIs over 100k)
Net capital gain/loss: +$4,211 (reported on 10.8% of returns)
Here:
+$4,211
State:
+$23,418
(% of AGI for various income ranges: -1.2% for AGIs below $10k, -0.1% for AGIs $10k-25k, 0.1% for AGIs $25k-50k, 0.5% for AGIs $50k-75k, 0.5% for AGIs $75k-100k, 6.4% for AGIs over 100k)
Profit/loss from business: +$9,674 (reported on 21.8% of returns)
Here:
+$9,674
State:
+$16,826
(% of AGI for various income ranges: 28.8% for AGIs below $10k, 12.8% for AGIs $10k-25k, 5.7% for AGIs $25k-50k, 3.0% for AGIs $50k-75k, 3.5% for AGIs $75k-100k, 4.6% for AGIs over 100k)
IRA payment deduction: $2,911 (reported on 2.7% of returns)
91335:
$2,911
California:
$3,192
(% of AGI for various income ranges: 0.3% for AGIs below $10k, 0.2% for AGIs $10k-25k, 0.3% for AGIs $25k-50k, 0.3% for AGIs $50k-75k, 0.2% for AGIs $75k-100k, 0.2% for AGIs over 100k)
Self-employed pension: $9,327 (reported on 0.4% of returns)
Here:
$9,327
California:
$17,688
(% of AGI for various income ranges: 0.0% for AGIs $10k-25k, 0.1% for AGIs $25k-50k, 0.1% for AGIs $50k-75k, 0.2% for AGIs $75k-100k, 0.2% for AGIs over 100k)
Total itemized deductions: $19,897 (34% of AGI, reported on 34.9% of returns)
Here:
$19,897
State:
$28,113
Here:
33.7% of AGI
State:
25.3% of AGI
(% of AGI for various income ranges: 18.0% for AGIs below $10k, 13.1% for AGIs $10k-25k, 18.8% for AGIs $25k-50k, 23.7% for AGIs $50k-75k, 23.6% for AGIs $75k-100k, 20.7% for AGIs over 100k)
Charity contributions deductions: $2,159 (3% of AGI, reported on 29.2% of returns)
Here:
$2,159
State:
$3,923
Here:
3.4% of AGI
State:
3.3% of AGI
(% of AGI for various income ranges: 0.7% for AGIs below $10k, 0.8% for AGIs $10k-25k, 1.5% for AGIs $25k-50k, 2.1% for AGIs $50k-75k, 2.3% for AGIs $75k-100k, 2.6% for AGIs over 100k)
Total tax: $3,998 (reported on 72.2% of returns)
91335:
$3,998
State:
$10,761
(% of AGI for various income ranges: 7.0% for AGIs below $10k, 4.5% for AGIs $10k-25k, 6.1% for AGIs $25k-50k, 8.0% for AGIs $50k-75k, 9.7% for AGIs $75k-100k, 14.7% for AGIs over 100k)
Earned income credit: $1,747 (reported on 23.0% of returns)
Here:
$1,747
State:
$1,763
Percentage of individuals using paid preparers for their 2004 taxes: 75.3%
Here:
75%
State:
66%
(% for various income ranges: 70.8% for AGIs below $10k, 78.5% for AGIs $10k-25k, 75.3% for AGIs $25k-50k, 75.8% for AGIs $50k-75k, 73.0% for AGIs $75k-100k, 75.3% for AGIs over 100k)
Likely homosexual households (counted as self-reported same-sex unmarried-partner households)
Lesbian couples: 0.1% of all households
Gay men: 0.0% of all households
Household received Food Stamps/SNAP in the past 12 months: 3,869 Household did not receive Food Stamps/SNAP in the past 12 months: 21,102
Women who had a birth in the past 12 months: 821 (575 now married, 245 unmarried) Women who did not have a birth in the past 12 months: 17,568 (7,294 now married, 10,260 unmarried)
Housing units in zip code 91335 with a mortgage: 8,868 (825 second mortgage, 557 both second mortgage and home equity loan) Houses without a mortgage: 217
Median monthly owner costs for units with a mortgage: $2,836 Median monthly owner costs for units without a mortgage: $788
Residents with income below the poverty level in 2022:
This zip code:
12.1%
Whole state:
12.2%
Residents with income below 50% of the poverty level in 2022:
This zip code:
7.3%
Whole state:
6.2%
Median number of rooms in houses and condos:
Here:
5.5
State:
6.0
Median number of rooms in apartments:
Here:
3.5
State:
3.9
Notable locations in this zip code not listed on our city pages
Notable locations in zip code 91335: Tarzana Siding (A), West Valley Regional Branch Los Angeles Public Library (B), West Valley Community Police Station (C), City of Los Angeles Fire Department Station 73 (D). Display/hide their locations on the map
Churches in zip code 91335 include: Grace Shepherdship Church (A), Iglesia Bautista De Reseda (B), Reseda Boulevard Church of Christ (C), Trinity Lutheran Church (D), Universal Church (E). Display/hide their locations on the map
9,251 married couples with children.
3,612 single-parent households (1,008 men, 2,604 women).
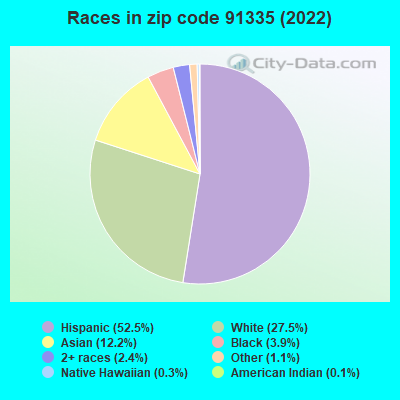
33.3% of residents of 91335 zip code speak English at home.
45.1% of residents speak Spanish at home (56% very well, 21% well, 17% not well, 6% not at all).
10.5% of residents speak other Indo-European language at home (51% very well, 28% well, 16% not well, 5% not at all).
8.1% of residents speak Asian or Pacific Island language at home (53% very well, 28% well, 12% not well, 6% not at all).
3.6% of residents speak other language at home (75% very well, 16% well, 7% not well, 2% not at all).
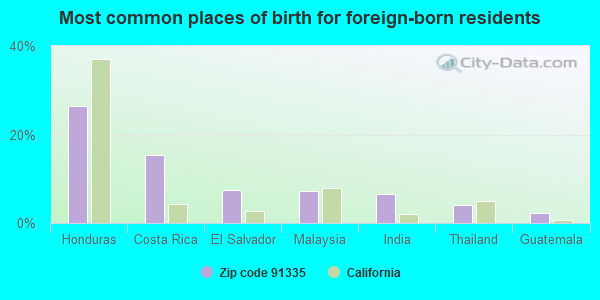
Foreign born population: 33,049 (43.2%) (60.1% of them are naturalized citizens)
This zip code:
43.2%
Whole state:
26.7%
26%Honduras
15%Costa Rica
8%El Salvador
7%Malaysia
7%India
4%Thailand
2%Guatemala
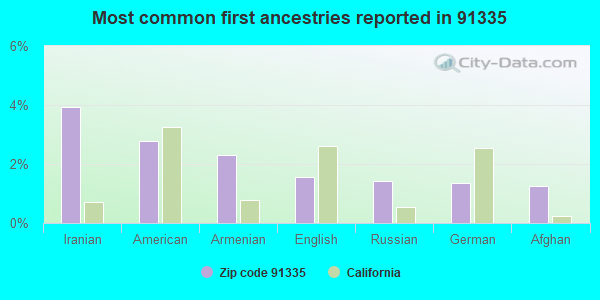
4%Iranian
3%American
2%Armenian
2%English
1%Russian
1%German
1%Afghan
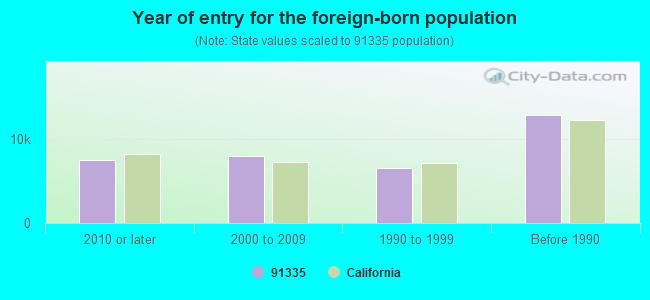
Year of entry for the foreign-born population
7,4742010 or later
8,0472000 to 2009
6,5531990 to 1999
12,884Before 1990
Biggest public high schools in in zip code 91335 not listed on the city page:
Private elementary/middle schools in in this zip code not listed on the city page:
ST CATHERINE OF SIENA SCHOOL (Students: 254, Location: 18125 SHERMAN WAY, Grades: PK-8)
KIRK O' THE VALLEY SCHOOL (Students: 233, Location: 19620 VANOWEN ST, Grades: PK-5)
HEART OF THE VALLEY CHRISTIAN SCHOOL (Students: 114, Location: 18644 SHERMAN WAY, Grades: PK-8)
APPLIED SCHOLASTICS ACADEMY VALLEY (Students: 25, Location: 19000A SATICOY ST, Grades: PK-7)
LEWIS CARROLL ACADEMY (Students: 25, Location: 19000 SATICOY ST, Grades: PK-7)
Major facilities with environmental interests located in this zip code:
KOLBE HONDA (7514 RESEDA BLVD in RESEDA, CA)
STATE MASTER (California - Hazardous Waste Tracking) - HAZARDOU WASTE PROGRAM Small Quantity Generators, between 100 kg and 1000 kg of hazardous waste/month (Resource Conservation and Recovery Act (tracking hazardous waste)) - notification STATE MASTER (California - Used Oil Recycling System ) - USED OIL RECYCLING Organizations: ANDY KOLBE (CONTACT/OWNER)
H AND R AUTO PAINT AND BODY REPAIR (18539 TOPHAM STREET in RESEDA, CA)
STATE MASTER (California - Hazardous Waste Tracking) - HAZARDOU WASTE PROGRAM CRITERIA AND HAZARDOUS AIR POLLUTANT INVENTORY (Inventory of air pollution sources) Small Quantity Generators, between 100 kg and 1000 kg of hazardous waste/month (Resource Conservation and Recovery Act (tracking hazardous waste)) - notification Small Quantity Generators, between 100 kg and 1000 kg of hazardous waste/month (Resource Conservation and Recovery Act (tracking hazardous waste)) - notification Business SIC classification: GENERAL AUTOMOTIVE REPAIR SHOPS Business NAICS classification: AUTOMOTIVE BODY, PAINT, AND INTERIOR REPAIR AND MAINTENANCE. Organizations: MOHAMMMAD TOOSINESAD (CONTACT/OWNER)
, TOOSINEJAD REZA (CONTACT/OWNER)
Alternative names: MOHAMMAD TOOSINEJED
CENTER VALLEY AUTOMOTIVE (18425 VANOWEN STREET in RESEDA, CA)
STATE MASTER (California - Hazardous Waste Tracking) - HAZARDOU WASTE PROGRAM Small Quantity Generators, between 100 kg and 1000 kg of hazardous waste/month (Resource Conservation and Recovery Act (tracking hazardous waste)) Small Quantity Generators, between 100 kg and 1000 kg of hazardous waste/month (Resource Conservation and Recovery Act (tracking hazardous waste)) - notification Business NAICS classification: AUTOMOTIVE BODY, PAINT, AND INTERIOR REPAIR AND MAINTENANCE. Organizations: BOB LAGROTTA (CONTACT/OWNER)
Alternative names: CENTER VALLEY, INC
MARTIN DAVIDSONS AUTO MACH SHOP (18410 GAULT ST in RESEDA, CA)
STATE MASTER (California - Hazardous Waste Tracking) - HAZARDOU WASTE PROGRAM Small Quantity Generators, between 100 kg and 1000 kg of hazardous waste/month (Resource Conservation and Recovery Act (tracking hazardous waste)) - notification
LEON'S AUTOMOTIVE INC (18102 VICTORY BLVD in RESEDA, CA) . Federal Facility
STATE MASTER (California - Hazardous Waste Tracking) - HAZARDOU WASTE PROGRAM Small Quantity Generators, between 100 kg and 1000 kg of hazardous waste/month (Resource Conservation and Recovery Act (tracking hazardous waste)) - notification Organizations: LEON GOTLIB (CONTACT/OWNER)
Alternative names: AL LEONS UNOCAL 76
LA RESEDA ST MAINT YARD (6015 BAIRD AVE in RESEDA, CA)
STATE MASTER (California - Hazardous Waste Tracking) - HAZARDOU WASTE PROGRAM Small Quantity Generators, between 100 kg and 1000 kg of hazardous waste/month (Resource Conservation and Recovery Act (tracking hazardous waste)) - notification Organizations: CITY OF LOS ANGELES (CONTACT/OWNER)
Alternative names: CITY OF L A STREET SERVICES
GEORGES GERMAN AUTO REPAIR (7009 RESEDA BLVD in RESEDA, CA)
STATE MASTER (California - Hazardous Waste Tracking) - HAZARDOU WASTE PROGRAM Small Quantity Generators, between 100 kg and 1000 kg of hazardous waste/month (Resource Conservation and Recovery Act (tracking hazardous waste)) - notification Business NAICS classification: GENERAL AUTOMOTIVE REPAIR. Organizations: GEORGE A ZILIFIAN (CONTACT/OWNER)
A S A P AUTO CTR (6734 RESEDA BLVD 4S AND 5S in RESEDA, CA)
STATE MASTER (California - Hazardous Waste Tracking) - HAZARDOU WASTE PROGRAM Small Quantity Generators, between 100 kg and 1000 kg of hazardous waste/month (Resource Conservation and Recovery Act (tracking hazardous waste)) - notification Organizations: JOHN RAMIREZ (CONTACT/OWNER)
EURO BODY (18551 TOPHAM B in RESEDA, CA)
STATE MASTER (California - Hazardous Waste Tracking) - HAZARDOU WASTE PROGRAM Small Quantity Generators, between 100 kg and 1000 kg of hazardous waste/month (Resource Conservation and Recovery Act (tracking hazardous waste)) Business NAICS classification: AUTOMOTIVE BODY, PAINT, AND INTERIOR REPAIR AND MAINTENANCE.
HARRY CLEELAND I I I (7749 WILBUR AVE in RESEDA, CA)
STATE MASTER (California - Hazardous Waste Tracking) - HAZARDOU WASTE PROGRAM TRANSPORTER (Resource Conservation and Recovery Act (tracking hazardous waste)) Organizations: CLEELAND HARRY I I I (CONTACT/OWNER)
MELVIN AVENUE ELEMENTARY (7700 MELVIN AVE. in RESEDA, CA)
(National Center for Education Statistics) - STATE ID-6018121 Organizations: LOS ANGELES UNIFIED (SCHOOL DISTRICT)
MILLER (JOAQUIN) HIGH (OH,OHI) (8218 VANALDEN AVE. in RESEDA, CA)
(National Center for Education Statistics) - STATE ID-1935717 Organizations: LOS ANGELES UNIFIED (SCHOOL DISTRICT)
ACTRON, INC. (18338 GAULT ST. in RESEDA, CA)
(Integrated Compliance Information System) - ICIS-09-2003-0153, FORMAL ENFORCEMENT ACTION COMPLIANCE ACTIVITY (Tracking inspections of insecticide, fungicide, and rodenticide, and toxic substances) Business SIC classification: ADHESIVES AND SEALANTS
Housing units lacking complete plumbing facilities: 0.4% Housing units lacking complete kitchen facilities: 3.0%
54.9%Utility gas
40.6%Electricity
2.1%No fuel used
1.2%Bottled, tank, or LP gas
Population in 1990: 62,117. Population change in the 1990s: +5,885 (+9.5%).
Place of birth for U.S.-born residents:
This state: 34,048
Northeast: 2,674
Midwest: 2,179
South: 1,635
West: 1,111
53% of the 91335 zip code residents lived in the same house 5 years ago. Out of people who lived in different houses, 87% lived in this county. Out of people who lived in different counties, 50% lived in California.
92% of the 91335 zip code residents lived in the same house 1 year ago. Out of people who lived in different houses, 78% moved from this county. Out of people who lived in different houses, 6% moved from different county within same state. Out of people who lived in different houses, 9% moved from different state. Out of people who lived in different houses, 7% moved from abroad.
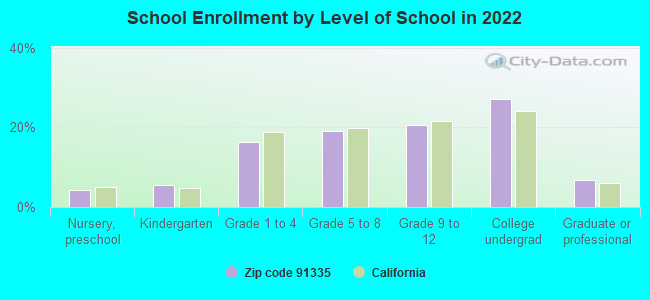
Private vs. public school enrollment:
Students in private schools in grades 1 to 8 (elementary and middle school): 757
Here:
10.9%
California:
10.5%
Students in private schools in grades 9 to 12 (high school): 223
Here:
5.6%
California:
8.5%
Students in private undergraduate colleges: 604
Here:
11.5%
California:
15.9%
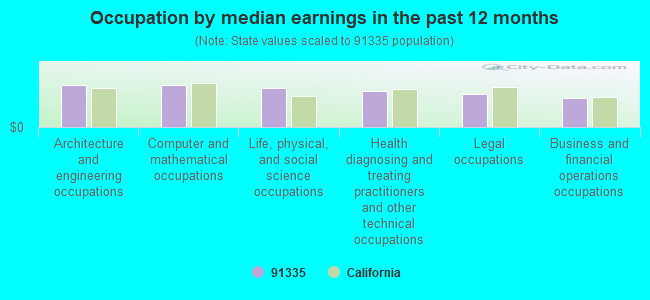
Occupation by median earnings in the past 12 months ($)
96,252Architecture and engineering occupations
95,861Computer and mathematical occupations
88,367Life, physical, and social science occupations
83,390Health diagnosing and treating practitioners and other technical occupations
76,545Legal occupations
66,119Business and financial operations occupations
Companies with federal contracts located in this zip code:
SADA SYSTEMS, INC (7001 LINDLEY AVE in RESEDA, CA; small business)
$168,075 with Air Force for ADP Support Equipment. Signed on 2003-09-30. Completion date: 2003-10-30.
MTA TECHNICAL SALES (7507 WYSTONE AVE in RESEDA, CA; small business) : $24,063 in 2 contractsfrom 2004 to 2005
$17,990 with Navy for Building Components, Prefabricated. Taking place in FL. Signed on 2004-09-30. Completion date: 2004-11-17.
$6,073 with Army for Grinding Machines. Signed on 2005-04-28. Completion date: 2005-05-13.
DPL SURVEILLANCE EQUIPMENT (18345 KITTRIDGE STREET #12 in RESEDA, CA; small business) : $3,503 in 3 contractsin 2004
$2,949 with Navy for Miscellaneous Alarm, Signal and Security Detection Systems. Signed on 2004-07-14. Completion date: 2004-07-22.
$549, same as above.Signed on 2004-09-29. Completion date: 2004-07-22.
$5, same as above.Signed on 2004-08-13. Completion date: 2004-07-22.
Top industries in this zip code by the number of employees in 2005:
Health Care and Social Assistance: Continuing Care Retirement Communities (250-499 employees: 1 establishment, 100-249 employees: 1 establishment, 50-99 employees: 1 establishment)
2005 - 2018 National Fire Incident Reporting System (NFIRS) incidents
According to the data from the years 2005 - 2018 the average number of fires per year is 101. The highest number of fires - 135 took place in 2006, and the least - 77 in 2016. The data has a dropping trend.
When looking into fire subcategories, the most reports belonged to: Structure Fires (49.7%), and Outside Fires (25.9%).
Fire incident types reported to NFIRS in Zip Code 91335
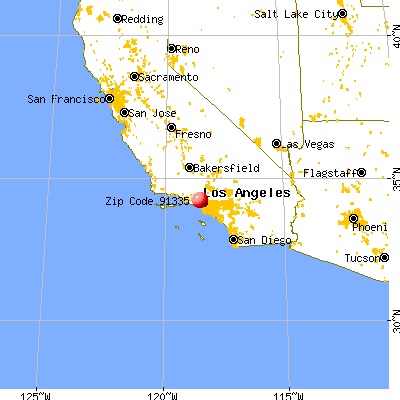


 Nearest zip codes: 91306, 91371, 91324, 91325, 91356, 91316.


 (Students: 2,653, Location: 8140 VANALDEN AVE., Grades: 9-12, Charter school)
 According to the data from the years 2005 - 2018 the average number of fires per year is 101. The highest number of fires - 135 took place in 2006, and the least - 77 in 2016. The data has a dropping trend.
 When looking into fire subcategories, the most reports belonged to: Structure Fires (49.7%), and Outside Fires (25.9%).