Estimated zip code population in 2022: 49,049 Zip code population in 2010: 45,061 Zip code population in 2000: 43,846
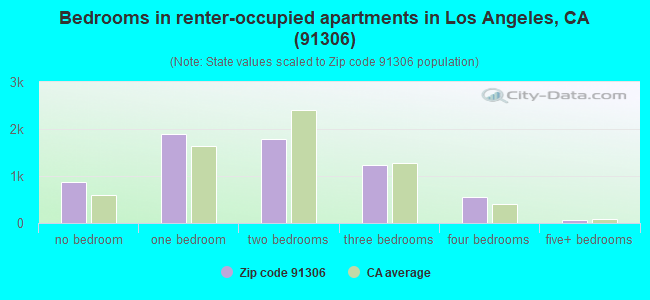
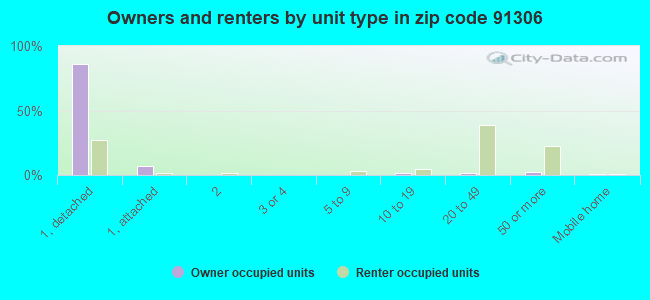
Houses and condos: 15,192 Renter-occupied apartments: 6,392
% of renters here:
43%
State:
44%
March 2022 cost of living index in zip code 91306: 134.4 (high, U.S. average is 100)
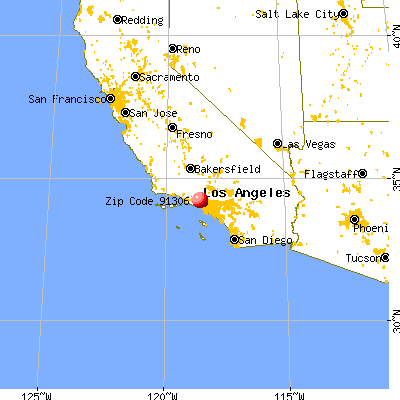
Land area: 4.1 sq. mi. Water area: 0.0 sq. mi.
Population density: 11,852 people per square mile
(high).
OSM Map
General Map
Google Map
MSN Map
OSM Map
General Map
Google Map
MSN Map
OSM Map
General Map
Google Map
MSN Map
OSM Map
General Map
Google Map
MSN Map
Please wait while loading the map...
Real estate property taxes paid for housing units in 2022:
This zip code:
0.7% ($4,738)
California:
0.7% ($4,831)
Median real estate property taxes paid for housing units with mortgages in 2022: $5,101 (0.7%) Median real estate property taxes paid for housing units with no mortgage in 2022: $3,618 (0.5%)
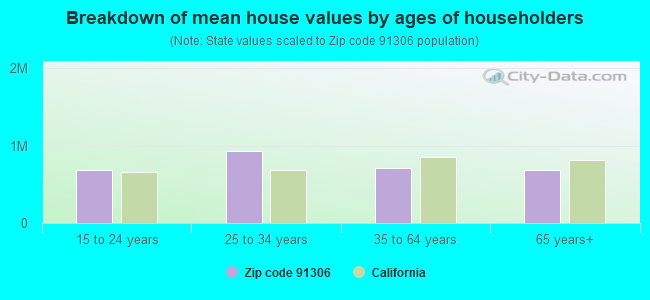
Estimated median house/condo value in 2022: $708,625
91306:
$708,625
California:
$715,900
According to our research of California and other state lists, there were 38 registered sex offenders living in 91306 zip code as of April 27, 2024. The ratio of all residents to sex offenders in zip code 91306 is 1,309 to 1. The ratio of registered sex offenders to all residents in this zip code is lower than the state average.
Median resident age:
This zip code:
37.9 years
California median age:
37.9 years
Average household size:
This zip code:
3.3 people
California:
2.8 people
Averages for the 2020 tax year for zip code 91306, filed in 2021:
Average Adjusted Gross Income (AGI) in 2020: $53,867 (Individual Income Tax Returns)
Here:
$53,867
State:
$95,910
Salary/wage: $51,769 (reported on 79.2% of returns)
Here:
$51,769
State:
$77,331
(% of AGI for various income ranges: 1163.0% for AGIs below $25k, 4162.2% for AGIs $25k-50k, 7813.5% for AGIs $50k-75k, 11840.4% for AGIs $75k-100k, 22181.5% for AGIs $100k-200k, 68599.4% for AGIs over 200k)
Taxable interest for individuals: $765 (reported on 28.1% of returns)
This zip code:
$765
California:
$2,294
(% of AGI for various income ranges: 12.0% for AGIs below $25k, 14.8% for AGIs $25k-50k, 45.1% for AGIs $50k-75k, 68.6% for AGIs $75k-100k, 110.7% for AGIs $100k-200k, 317.2% for AGIs over 200k)
Ordinary dividends: $2,472 (reported on 12.4% of returns)
Here:
$2,472
State:
$10,949
(% of AGI for various income ranges: 12.0% for AGIs below $25k, 20.3% for AGIs $25k-50k, 41.5% for AGIs $50k-75k, 92.9% for AGIs $75k-100k, 168.2% for AGIs $100k-200k, 838.9% for AGIs over 200k)
Net capital gain/loss in AGI: +$9,841 (reported on 12.9% of returns)
Here:
+$9,841
State:
+$49,306
(% of AGI for various income ranges: 7.2% for AGIs below $25k, 27.7% for AGIs $25k-50k, 54.7% for AGIs $50k-75k, 126.4% for AGIs $75k-100k, 488.3% for AGIs $100k-200k, 10459.4% for AGIs over 200k)
Profit/loss from business: +$9,723 (reported on 24.8% of returns)
Here:
+$9,723
State:
+$15,671
(% of AGI for various income ranges: 365.6% for AGIs below $25k, 278.3% for AGIs $25k-50k, 299.0% for AGIs $50k-75k, 440.2% for AGIs $75k-100k, 708.0% for AGIs $100k-200k, 2860.0% for AGIs over 200k)
Taxable individual retirement arrangement distribution: $16,445 (reported on 4.6% of returns)
91306:
$16,445
California:
$23,505
(% of AGI for various income ranges: 30.8% for AGIs below $25k, 46.2% for AGIs $25k-50k, 105.2% for AGIs $50k-75k, 280.6% for AGIs $75k-100k, 502.6% for AGIs $100k-200k, 1023.9% for AGIs over 200k)
Self-employed (Keogh) retirement plans: $12,550 (reported on 0.3% of returns)
91306:
$12,550
California:
$30,163
(% of AGI for various income ranges: 3.9% for AGIs $25k-50k, 42.8% for AGIs $100k-200k)
Total itemized deductions: $29,433 (reported on 13.4% of returns)
Here:
$29,433
State:
$39,517
(% of AGI for various income ranges: 101.4% for AGIs below $25k, 209.2% for AGIs $25k-50k, 710.5% for AGIs $50k-75k, 1454.6% for AGIs $75k-100k, 2500.8% for AGIs $100k-200k, 7057.2% for AGIs over 200k)
Charity contributions: $4,288 (reported on 10.8% of returns)
Here:
$4,288
State:
$12,598
(% of AGI for various income ranges: 3.9% for AGIs below $25k, 16.6% for AGIs $25k-50k, 64.0% for AGIs $50k-75k, 150.1% for AGIs $75k-100k, 331.8% for AGIs $100k-200k, 1298.9% for AGIs over 200k)
Taxes paid: $8,506 (reported on 13.3% of returns)
91306:
$8,506
State:
$8,807
(% of AGI for various income ranges: 24.1% for AGIs below $25k, 49.7% for AGIs $25k-50k, 205.7% for AGIs $50k-75k, 438.2% for AGIs $75k-100k, 781.7% for AGIs $100k-200k, 1830.0% for AGIs over 200k)
Earned income credit: $1,873 (reported on 17.2% of returns)
Here:
$1,873
State:
$2,074
(% of AGI for various income ranges: 93.1% for AGIs below $25k, 65.8% for AGIs $25k-50k, 1.2% for AGIs $50k-75k)
Percentage of individuals using paid preparers for their 2020 taxes: 91.5%
Here:
91%
State:
92%
(% for various income ranges: 89.1% for AGIs below $25k, 92.8% for AGIs $25k-50k, 92.6% for AGIs $50k-75k, 93.4% for AGIs $75k-100k, 93.2% for AGIs $100k-200k, 92.1% for AGIs over 200k)
Averages for the 2012 tax year for zip code 91306, filed in 2013:
Average Adjusted Gross Income (AGI) in 2012: $44,217 (Individual Income Tax Returns)
Here:
$44,217
State:
$72,726
Salary/wage: $43,532 (reported on 82.5% of returns)
Here:
$43,532
State:
$59,079
(% of AGI for various income ranges: 71.4% for AGIs below $25k, 83.3% for AGIs $25k-50k, 82.3% for AGIs $50k-75k, 82.5% for AGIs $75k-100k, 83.8% for AGIs $100k-200k, 75.8% for AGIs over 200k)
Taxable interest for individuals: $684 (reported on 30.1% of returns)
This zip code:
$684
California:
$2,146
(% of AGI for various income ranges: 0.6% for AGIs below $25k, 0.4% for AGIs $25k-50k, 0.4% for AGIs $50k-75k, 0.5% for AGIs $75k-100k, 0.5% for AGIs $100k-200k, 0.3% for AGIs over 200k)
Ordinary dividends: $2,436 (reported on 11.9% of returns)
Here:
$2,436
State:
$9,308
(% of AGI for various income ranges: 0.7% for AGIs below $25k, 0.4% for AGIs $25k-50k, 0.7% for AGIs $50k-75k, 0.5% for AGIs $75k-100k, 0.8% for AGIs $100k-200k, 1.2% for AGIs over 200k)
Net capital gain/loss in AGI: +$2,101 (reported on 9.2% of returns)
Here:
+$2,101
State:
+$30,460
(% of AGI for various income ranges: 0.2% for AGIs $50k-75k, 0.2% for AGIs $75k-100k, 0.4% for AGIs $100k-200k, 5.5% for AGIs over 200k)
Profit/loss from business: +$11,258 (reported on 22.5% of returns)
Here:
+$11,258
State:
+$17,064
(% of AGI for various income ranges: 18.9% for AGIs below $25k, 6.3% for AGIs $25k-50k, 3.8% for AGIs $50k-75k, 3.3% for AGIs $75k-100k, 2.4% for AGIs $100k-200k, 3.7% for AGIs over 200k)
Taxable individual retirement arrangement distribution: $12,789 (reported on 5.6% of returns)
91306:
$12,789
California:
$19,557
(% of AGI for various income ranges: 1.5% for AGIs below $25k, 1.5% for AGIs $25k-50k, 2.0% for AGIs $50k-75k, 1.7% for AGIs $75k-100k, 1.7% for AGIs $100k-200k, 0.6% for AGIs over 200k)
Self-employment retirement plans: $11,900 (reported on 0.4% of returns)
91306:
$11,900
California:
$24,530
Total itemized deductions: $23,155 (29% of AGI, reported on 33.1% of returns)
Here:
$23,155
State:
$34,004
Here:
28.9% of AGI
State:
22.7% of AGI
(% of AGI for various income ranges: 10.0% for AGIs below $25k, 13.4% for AGIs $25k-50k, 18.8% for AGIs $50k-75k, 21.1% for AGIs $75k-100k, 20.5% for AGIs $100k-200k, 17.7% for AGIs over 200k)
Charity contributions: $2,300 (reported on 26.8% of returns)
Here:
$2,300
State:
$4,659
(% of AGI for various income ranges: 0.4% for AGIs below $25k, 0.9% for AGIs $25k-50k, 1.4% for AGIs $50k-75k, 1.7% for AGIs $75k-100k, 1.9% for AGIs $100k-200k, 1.8% for AGIs over 200k)
Taxes paid: $7,374 (reported on 33.1% of returns)
91306:
$7,374
State:
$14,448
(% of AGI for various income ranges: 2.1% for AGIs below $25k, 3.1% for AGIs $25k-50k, 5.4% for AGIs $50k-75k, 6.6% for AGIs $75k-100k, 7.8% for AGIs $100k-200k, 8.4% for AGIs over 200k)
Earned income credit: $2,248 (reported on 22.5% of returns)
Here:
$2,248
State:
$2,286
(% of AGI for various income ranges: 7.2% for AGIs below $25k, 1.2% for AGIs $25k-50k)
Percentage of individuals using paid preparers for their 2012 taxes: 73.4%
Here:
73%
State:
64%
(% for various income ranges: 72.7% for AGIs below $25k, 74.5% for AGIs $25k-50k, 74.6% for AGIs $50k-75k, 72.0% for AGIs $75k-100k, 73.0% for AGIs $100k-200k, 75.0% for AGIs over 200k)
Averages for the 2004 tax year for zip code 91306, filed in 2005:
Average Adjusted Gross Income (AGI) in 2004: $39,749 (Individual Income Tax Returns)
Here:
$39,749
State:
$58,600
Salary/wage: $39,085 (reported on 84.6% of returns)
Here:
$39,085
State:
$49,455
(% of AGI for various income ranges: 96.1% for AGIs below $10k, 78.5% for AGIs $10k-25k, 85.2% for AGIs $25k-50k, 84.9% for AGIs $50k-75k, 86.9% for AGIs $75k-100k, 78.7% for AGIs over 100k)
Taxable interest for individuals: $1,008 (reported on 40.7% of returns)
This zip code:
$1,008
California:
$2,365
(% of AGI for various income ranges: 3.8% for AGIs below $10k, 1.2% for AGIs $10k-25k, 0.8% for AGIs $25k-50k, 0.8% for AGIs $50k-75k, 1.0% for AGIs $75k-100k, 1.2% for AGIs over 100k)
Taxable dividends: $1,529 (reported on 16.1% of returns)
Here:
$1,529
State:
$4,746
(% of AGI for various income ranges: 2.0% for AGIs below $10k, 0.8% for AGIs $10k-25k, 0.5% for AGIs $25k-50k, 0.6% for AGIs $50k-75k, 0.5% for AGIs $75k-100k, 0.7% for AGIs over 100k)
Net capital gain/loss: +$5,689 (reported on 13.6% of returns)
Here:
+$5,689
State:
+$23,418
(% of AGI for various income ranges: -0.8% for AGIs below $10k, -0.2% for AGIs $10k-25k, 0.2% for AGIs $25k-50k, 0.2% for AGIs $50k-75k, 0.8% for AGIs $75k-100k, 7.1% for AGIs over 100k)
Profit/loss from business: +$10,049 (reported on 20.5% of returns)
Here:
+$10,049
State:
+$16,826
(% of AGI for various income ranges: 18.8% for AGIs below $10k, 12.1% for AGIs $10k-25k, 5.7% for AGIs $25k-50k, 3.9% for AGIs $50k-75k, 3.2% for AGIs $75k-100k, 2.7% for AGIs over 100k)
IRA payment deduction: $3,117 (reported on 2.8% of returns)
91306:
$3,117
California:
$3,192
(% of AGI for various income ranges: 0.4% for AGIs below $10k, 0.2% for AGIs $10k-25k, 0.3% for AGIs $25k-50k, 0.2% for AGIs $50k-75k, 0.2% for AGIs $75k-100k, 0.2% for AGIs over 100k)
Self-employed pension: $9,010 (reported on 0.6% of returns)
Here:
$9,010
California:
$17,688
(% of AGI for various income ranges: 0.1% for AGIs $10k-25k, 0.1% for AGIs $25k-50k, 0.1% for AGIs $50k-75k, 0.2% for AGIs $75k-100k, 0.2% for AGIs over 100k)
Total itemized deductions: $21,160 (32% of AGI, reported on 39.2% of returns)
Here:
$21,160
State:
$28,113
Here:
31.8% of AGI
State:
25.3% of AGI
(% of AGI for various income ranges: 19.5% for AGIs below $10k, 13.4% for AGIs $10k-25k, 19.5% for AGIs $25k-50k, 24.7% for AGIs $50k-75k, 25.1% for AGIs $75k-100k, 19.9% for AGIs over 100k)
Charity contributions deductions: $2,411 (3% of AGI, reported on 33.6% of returns)
Here:
$2,411
State:
$3,923
Here:
3.4% of AGI
State:
3.3% of AGI
(% of AGI for various income ranges: 0.6% for AGIs below $10k, 0.9% for AGIs $10k-25k, 1.7% for AGIs $25k-50k, 2.4% for AGIs $50k-75k, 2.7% for AGIs $75k-100k, 2.3% for AGIs over 100k)
Total tax: $4,841 (reported on 74.3% of returns)
91306:
$4,841
State:
$10,761
(% of AGI for various income ranges: 5.7% for AGIs below $10k, 4.4% for AGIs $10k-25k, 6.3% for AGIs $25k-50k, 8.2% for AGIs $50k-75k, 9.3% for AGIs $75k-100k, 14.8% for AGIs over 100k)
Earned income credit: $1,726 (reported on 18.8% of returns)
Here:
$1,726
State:
$1,763
Percentage of individuals using paid preparers for their 2004 taxes: 74.2%
Here:
74%
State:
66%
(% for various income ranges: 69.3% for AGIs below $10k, 78.0% for AGIs $10k-25k, 74.7% for AGIs $25k-50k, 73.9% for AGIs $50k-75k, 71.8% for AGIs $75k-100k, 73.3% for AGIs over 100k)
Likely homosexual households (counted as self-reported same-sex unmarried-partner households)
Lesbian couples: 0.3% of all households
Gay men: 0.5% of all households
Household received Food Stamps/SNAP in the past 12 months: 2,288 Household did not receive Food Stamps/SNAP in the past 12 months: 12,520
Women who had a birth in the past 12 months: 478 (326 now married, 152 unmarried) Women who did not have a birth in the past 12 months: 11,899 (4,653 now married, 7,248 unmarried)
Housing units in zip code 91306 with a mortgage: 6,322 (653 second mortgage, 16 home equity loan, 481 both second mortgage and home equity loan) Houses without a mortgage: 101
Median monthly owner costs for units with a mortgage: $2,744 Median monthly owner costs for units without a mortgage: $883
Residents with income below the poverty level in 2022:
This zip code:
18.8%
Whole state:
12.2%
Residents with income below 50% of the poverty level in 2022:
This zip code:
11.6%
Whole state:
6.2%
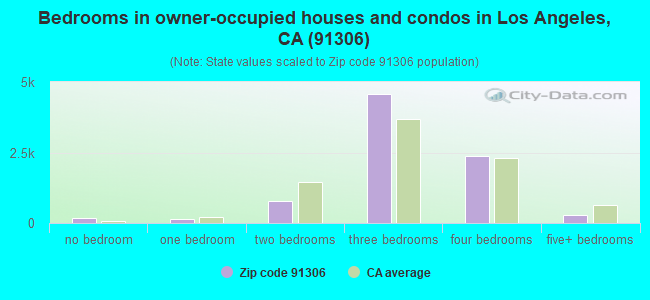
Median number of rooms in houses and condos:
Here:
5.9
State:
6.0
Median number of rooms in apartments:
Here:
3.7
State:
3.9
Notable locations in this zip code not listed on our city pages
Churches in zip code 91306 include: Christ Community Church (A), Church of Christ (B), Saint Joseph The Worker Church (C), Saint Martin In The Fields Church (D). Display/hide their locations on the map
5,456 married couples with children.
2,463 single-parent households (520 men, 1,943 women).
36.7% of residents of 91306 zip code speak English at home.
41.7% of residents speak Spanish at home (57% very well, 16% well, 17% not well, 10% not at all).
8.5% of residents speak other Indo-European language at home (55% very well, 29% well, 15% not well, 1% not at all).
12.4% of residents speak Asian or Pacific Island language at home (41% very well, 37% well, 17% not well, 5% not at all).
1.2% of residents speak other language at home (80% very well, 12% well, 8% not well).
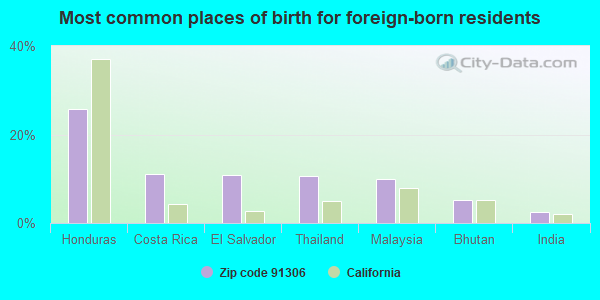
Foreign born population: 20,719 (42.2%) (58.7% of them are naturalized citizens)
This zip code:
42.2%
Whole state:
26.7%
26%Honduras
11%Costa Rica
11%El Salvador
11%Thailand
10%Malaysia
5%Bhutan
2%India
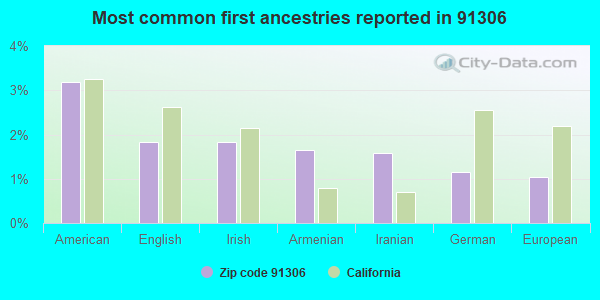
3%American
2%English
2%Irish
2%Armenian
2%Iranian
1%German
1%European
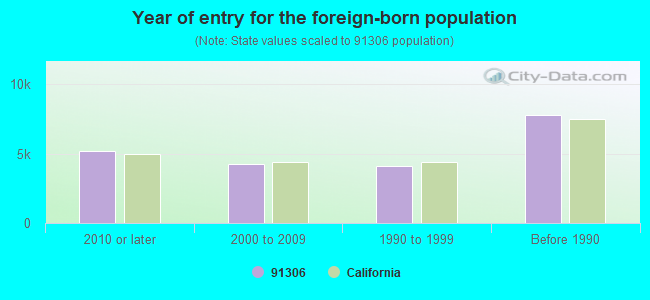
Year of entry for the foreign-born population
5,1562010 or later
4,2202000 to 2009
4,1421990 to 1999
7,783Before 1990
Private high schools in in this zip code not listed on the city page:
Major facilities with environmental interests located in this zip code:
LA USD SUTTER JUNIOR HIGH (7330 WINNETKA AVE in CANOGA PARK, CA)
STATE MASTER (California - Hazardous Waste Tracking) - HAZARDOU WASTE PROGRAM Small Quantity Generators, between 100 kg and 1000 kg of hazardous waste/month (Resource Conservation and Recovery Act (tracking hazardous waste)) - notification Alternative names: LAUSD/SUTTER JH
MIDWEST CLEANERS (20121 SHERMAN WAY in CANOGA PARK, CA)
STATE MASTER (California - Hazardous Waste Tracking) - HAZARDOU WASTE PROGRAM Small Quantity Generators, between 100 kg and 1000 kg of hazardous waste/month (Resource Conservation and Recovery Act (tracking hazardous waste)) - notification Organizations: PAK WON (CONTACT/OWNER)
CAR CRAFT AUTO BODY (7117 CANOGA AVE in CANOGA PARK, CA)
STATE MASTER (California - Hazardous Waste Tracking) - HAZARDOU WASTE PROGRAM Small Quantity Generators, between 100 kg and 1000 kg of hazardous waste/month (Resource Conservation and Recovery Act (tracking hazardous waste)) - notification Business NAICS classification: GENERAL AUTOMOTIVE REPAIR. Organizations: CHARLIE CEHRELI (CONTACT/OWNER)
A1 TRANSMISSION (20146 SATICOY ST UNIT B1 in WINNETKA, CA)
STATE MASTER (California - Hazardous Waste Tracking) - HAZARDOU WASTE PROGRAM Small Quantity Generators, between 100 kg and 1000 kg of hazardous waste/month (Resource Conservation and Recovery Act (tracking hazardous waste)) - notification Organizations: SHINYOUNG LEE (CONTACT/OWNER)
FULLBRIGHT AVENUE ELEMENTARY (6940 FULLBRIGHT AVE. in CANOGA PARK, CA)
(National Center for Education Statistics) - STATE ID-6017198 Organizations: LOS ANGELES UNIFIED (SCHOOL DISTRICT)
LIMERICK AVENUE ELEMENTARY (8530 LIMERICK AVE. in CANOGA PARK, CA)
(National Center for Education Statistics) - STATE ID-6017883 Organizations: LOS ANGELES UNIFIED (SCHOOL DISTRICT)
ALL SERVICES OIL CO (7705 ALABAMA AVE in CANOGA PARK, CA)
EXXONMOBIL OIL CORP. (20101 ROSCOE BLVD in CANOGA PARK, CA)
HAZARDOUS WASTE BIENNIAL REPORTER (Resource Conservation and Recovery Act (tracking hazardous waste)) Large Quantity Generators, more that 1000 kg of hazardous waste/month (Resource Conservation and Recovery Act (tracking hazardous waste)) Organizations: EXXONMOBIL OIL CORPORATION (CONTACT/OWNER)
CHEVRON 93236 (20860 SHERMAN WY in WINNETKA, CA)
HAZARDOUS WASTE BIENNIAL REPORTER (Resource Conservation and Recovery Act (tracking hazardous waste)) Large Quantity Generators, more that 1000 kg of hazardous waste/month (Resource Conservation and Recovery Act (tracking hazardous waste)) - notification Organizations: CHEVRON PRODUCTS CO (CONTACT/OWNER)
A AND D AUTO BODY (19733 SHERMAN WAY NO 5 in CANOGA PARK, CA)
Small Quantity Generators, between 100 kg and 1000 kg of hazardous waste/month (Resource Conservation and Recovery Act (tracking hazardous waste)) - notification Organizations: WALICKI KERRY (CONTACT/OWNER)
G & S AUTO DISMANTLING (20430 HARTLAND ST in CANOGA PARK, CA)
National Pollutant Discharge Elimination System NON-MAJOR (Tracking pollutant discharge elimination systems) - permit
GALAXY CLEANERS (20831 1/2 ROSCO BLVD in CANOGA PARK, CA)
Small Quantity Generators, between 100 kg and 1000 kg of hazardous waste/month (Resource Conservation and Recovery Act (tracking hazardous waste)) - notification Organizations: RAHMATOLLA NAIMI AKBAR (CONTACT/OWNER)
GLORY CLEANERS (22330 SHERMAN WAY in CANOGA PARK, CA)
Small Quantity Generators, between 100 kg and 1000 kg of hazardous waste/month (Resource Conservation and Recovery Act (tracking hazardous waste)) - notification Organizations: YURIY NILAN (CONTACT/OWNER)
Housing units lacking complete plumbing facilities: 0.8% Housing units lacking complete kitchen facilities: 2.5%
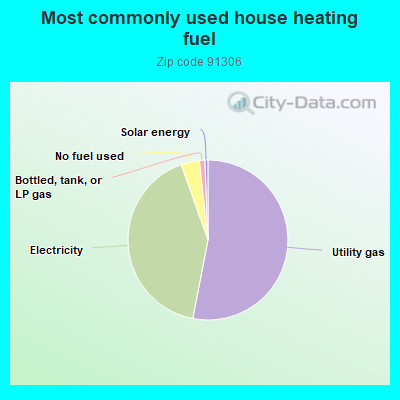
52.9%Utility gas
41.4%Electricity
3.7%No fuel used
1.1%Bottled, tank, or LP gas
0.6%Solar energy
Population in 1990: 39,261. Population change in the 1990s: +4,585 (+11.7%).
Place of birth for U.S.-born residents:
This state: 23,560
Northeast: 1,489
Midwest: 1,312
South: 1,117
West: 443
52% of the 91306 zip code residents lived in the same house 5 years ago. Out of people who lived in different houses, 87% lived in this county. Out of people who lived in different counties, 50% lived in California.
93% of the 91306 zip code residents lived in the same house 1 year ago. Out of people who lived in different houses, 84% moved from this county. Out of people who lived in different houses, 2% moved from different county within same state. Out of people who lived in different houses, 5% moved from different state. Out of people who lived in different houses, 10% moved from abroad.
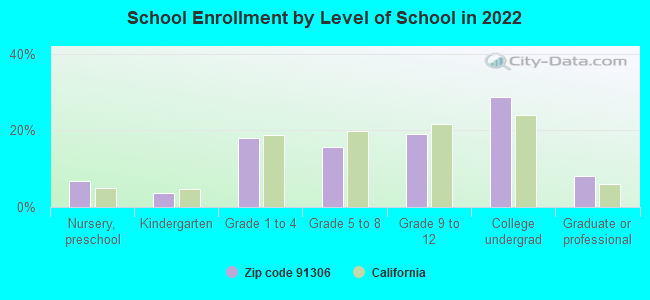
Private vs. public school enrollment:
Students in private schools in grades 1 to 8 (elementary and middle school): 647
Here:
14.9%
California:
10.5%
Students in private schools in grades 9 to 12 (high school): 184
Here:
7.5%
California:
8.5%
Students in private undergraduate colleges: 552
Here:
15.1%
California:
15.9%
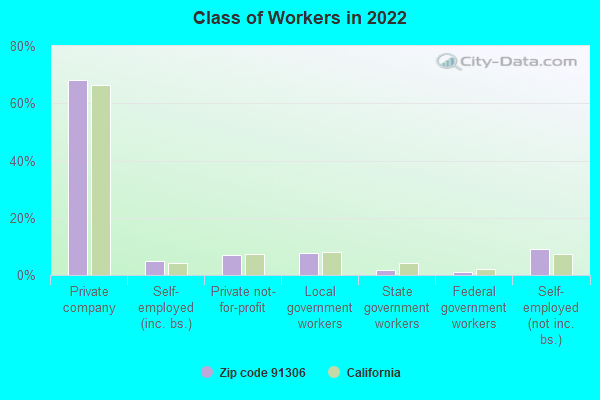
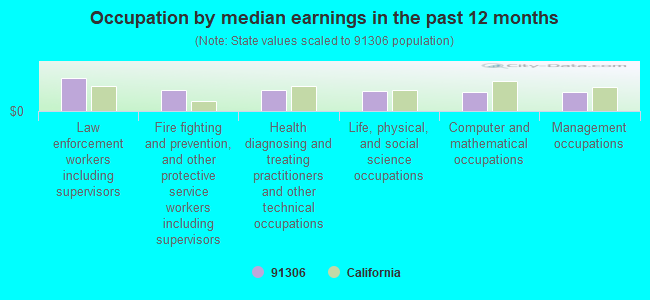
Occupation by median earnings in the past 12 months ($)
125,592Law enforcement workers including supervisors
79,629Fire fighting and prevention, and other protective service workers including supervisors
79,248Health diagnosing and treating practitioners and other technical occupations
76,758Life, physical, and social science occupations
72,577Computer and mathematical occupations
72,080Management occupations
Companies with federal contracts located in this zip code:
LITECOM, INC. (20249 ELKWOOD STREET in CANOGA PARK, CA; small business)
$298,865 with Navy for Defense Ships -- Basic Research (R&D). Signed on 1999-11-16. Completion date: 2000-11-19.
ULTIMATE SURPLUS BROKERS (19844 ENADIA WAY in WINNETKA, CA; small business) : $1,850 in 2 contractsin 2005
$1,250 with Navy for Hose, Pipe, Tube, Lubrication, and Railing Fittings. Signed on 2005-08-04. Completion date: 2005-08-05.
$600 with Navy for Valves, Nonpowered. Signed on 2005-09-22. Completion date: 2005-09-30.
Top industries in this zip code by the number of employees in 2005:
Other Services (except Public Administration): Religious Organizations (100-249 employees: 1 establishment, 20-49 employees: 3 establishments, 5-9 employees: 1 establishment, 1-4 employees: 6 establishments)
2005 - 2018 National Fire Incident Reporting System (NFIRS) incidents
Based on the data from the years 2005 - 2018 the average number of fires per year is 60. The highest number of reported fires - 76 took place in 2009, and the least - 37 in 2012. The data has a dropping trend.
When looking into fire subcategories, the most reports belonged to: Structure Fires (45.9%), and Outside Fires (26.2%).
Fire incident types reported to NFIRS in Zip Code 91306


 Nearest zip codes: 91371, 91303, 91335, 91324, 91367, 91304.


 (Students: 764, Location: 6844 OAKDALE AVE, Grades: PK-12)


 Based on the data from the years 2005 - 2018 the average number of fires per year is 60. The highest number of reported fires - 76 took place in 2009, and the least - 37 in 2012. The data has a dropping trend.
 When looking into fire subcategories, the most reports belonged to: Structure Fires (45.9%), and Outside Fires (26.2%).