Estimated zip code population in 2022: 53,917 Zip code population in 2010: 50,231 Zip code population in 2000: 49,226
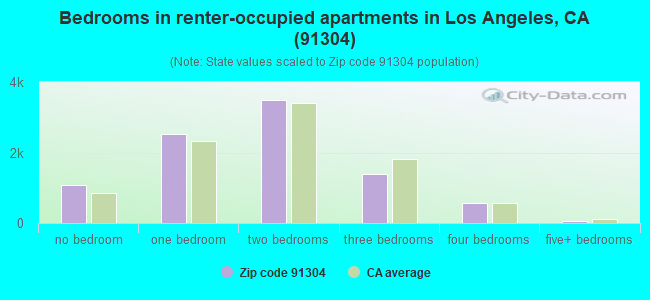
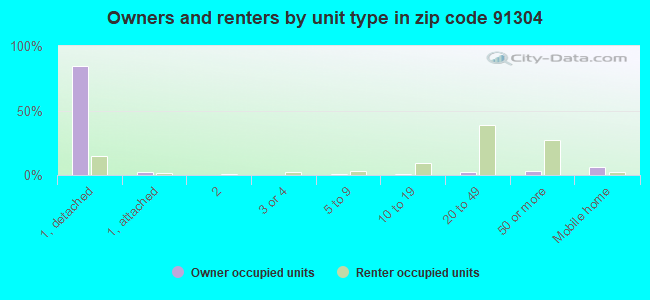
Houses and condos: 19,043 Renter-occupied apartments: 9,119
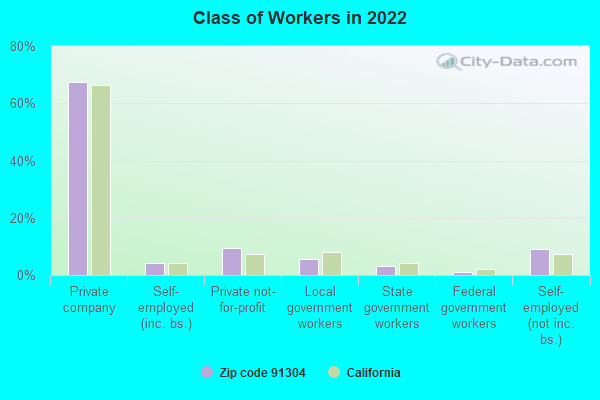
% of renters here:
49%
State:
44%
March 2022 cost of living index in zip code 91304: 138.0 (high, U.S. average is 100)
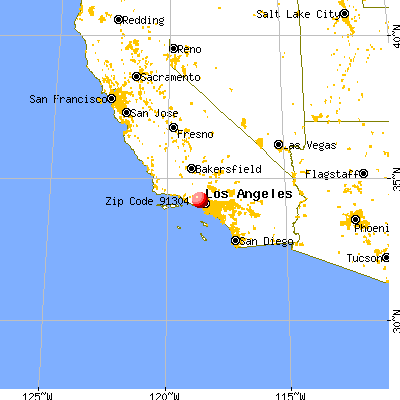
Land area: 9.4 sq. mi. Water area: 0.0 sq. mi.
Population density: 5,733 people per square mile
(average).
OSM Map
General Map
Google Map
MSN Map
OSM Map
General Map
Google Map
MSN Map
OSM Map
General Map
Google Map
MSN Map
OSM Map
General Map
Google Map
MSN Map
Please wait while loading the map...
Real estate property taxes paid for housing units in 2022:
This zip code:
0.7% ($5,774)
California:
0.7% ($4,831)
Median real estate property taxes paid for housing units with mortgages in 2022: $6,476 (0.7%) Median real estate property taxes paid for housing units with no mortgage in 2022: $4,075 (0.5%)
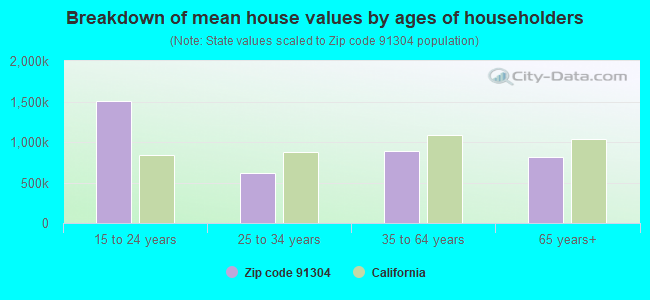
Estimated median house/condo value in 2022: $853,477
91304:
$853,477
California:
$715,900
According to our research of California and other state lists, there were 36 registered sex offenders living in 91304 zip code as of April 27, 2024. The ratio of all residents to sex offenders in zip code 91304 is 1,489 to 1. The ratio of registered sex offenders to all residents in this zip code is lower than the state average.
Median resident age:
This zip code:
40.9 years
California median age:
37.9 years
Average household size:
This zip code:
2.8 people
California:
2.8 people
Averages for the 2020 tax year for zip code 91304, filed in 2021:
Average Adjusted Gross Income (AGI) in 2020: $66,766 (Individual Income Tax Returns)
Here:
$66,766
State:
$95,910
Salary/wage: $59,904 (reported on 79.6% of returns)
Here:
$59,904
State:
$77,331
(% of AGI for various income ranges: 1237.1% for AGIs below $25k, 4131.2% for AGIs $25k-50k, 7542.8% for AGIs $50k-75k, 11586.7% for AGIs $75k-100k, 22205.8% for AGIs $100k-200k, 86564.5% for AGIs over 200k)
Taxable interest for individuals: $1,595 (reported on 29.8% of returns)
This zip code:
$1,595
California:
$2,294
(% of AGI for various income ranges: 17.6% for AGIs below $25k, 21.9% for AGIs $25k-50k, 50.2% for AGIs $50k-75k, 119.6% for AGIs $75k-100k, 211.9% for AGIs $100k-200k, 1178.2% for AGIs over 200k)
Ordinary dividends: $4,886 (reported on 17.0% of returns)
Here:
$4,886
State:
$10,949
(% of AGI for various income ranges: 21.2% for AGIs below $25k, 35.1% for AGIs $25k-50k, 89.9% for AGIs $50k-75k, 156.4% for AGIs $75k-100k, 404.7% for AGIs $100k-200k, 2240.0% for AGIs over 200k)
Net capital gain/loss in AGI: +$12,081 (reported on 16.9% of returns)
Here:
+$12,081
State:
+$49,306
(% of AGI for various income ranges: 7.7% for AGIs below $25k, 25.9% for AGIs $25k-50k, 79.1% for AGIs $50k-75k, 211.7% for AGIs $75k-100k, 680.8% for AGIs $100k-200k, 9289.5% for AGIs over 200k)
Profit/loss from business: +$12,563 (reported on 22.9% of returns)
Here:
+$12,563
State:
+$15,671
(% of AGI for various income ranges: 319.4% for AGIs below $25k, 222.4% for AGIs $25k-50k, 280.0% for AGIs $50k-75k, 520.6% for AGIs $75k-100k, 901.9% for AGIs $100k-200k, 5436.3% for AGIs over 200k)
Taxable individual retirement arrangement distribution: $23,034 (reported on 6.1% of returns)
91304:
$23,034
California:
$23,505
(% of AGI for various income ranges: 31.2% for AGIs below $25k, 63.3% for AGIs $25k-50k, 162.7% for AGIs $50k-75k, 300.1% for AGIs $75k-100k, 929.8% for AGIs $100k-200k, 2770.8% for AGIs over 200k)
Self-employed (Keogh) retirement plans: $21,493 (reported on 0.6% of returns)
91304:
$21,493
California:
$30,163
(% of AGI for various income ranges: 5.0% for AGIs $25k-50k, 56.3% for AGIs $100k-200k, 575.5% for AGIs over 200k)
Total itemized deductions: $33,432 (reported on 15.4% of returns)
Here:
$33,432
State:
$39,517
(% of AGI for various income ranges: 103.1% for AGIs below $25k, 203.7% for AGIs $25k-50k, 629.9% for AGIs $50k-75k, 1486.7% for AGIs $75k-100k, 3074.8% for AGIs $100k-200k, 10356.3% for AGIs over 200k)
Charity contributions: $5,692 (reported on 12.6% of returns)
Here:
$5,692
State:
$12,598
(% of AGI for various income ranges: 4.4% for AGIs below $25k, 15.4% for AGIs $25k-50k, 58.2% for AGIs $50k-75k, 155.6% for AGIs $75k-100k, 412.4% for AGIs $100k-200k, 2118.7% for AGIs over 200k)
Taxes paid: $8,805 (reported on 15.3% of returns)
91304:
$8,805
State:
$8,807
(% of AGI for various income ranges: 19.8% for AGIs below $25k, 49.3% for AGIs $25k-50k, 162.2% for AGIs $50k-75k, 433.2% for AGIs $75k-100k, 918.4% for AGIs $100k-200k, 2341.8% for AGIs over 200k)
Earned income credit: $1,982 (reported on 15.9% of returns)
Here:
$1,982
State:
$2,074
(% of AGI for various income ranges: 94.1% for AGIs below $25k, 68.3% for AGIs $25k-50k, 0.9% for AGIs $50k-75k)
Percentage of individuals using paid preparers for their 2020 taxes: 91.4%
Here:
91%
State:
92%
(% for various income ranges: 88.8% for AGIs below $25k, 92.2% for AGIs $25k-50k, 91.5% for AGIs $50k-75k, 94.4% for AGIs $75k-100k, 93.4% for AGIs $100k-200k, 93.3% for AGIs over 200k)
Averages for the 2012 tax year for zip code 91304, filed in 2013:
Average Adjusted Gross Income (AGI) in 2012: $55,658 (Individual Income Tax Returns)
Here:
$55,658
State:
$72,726
Salary/wage: $50,537 (reported on 82.5% of returns)
Here:
$50,537
State:
$59,079
(% of AGI for various income ranges: 73.4% for AGIs below $25k, 83.4% for AGIs $25k-50k, 78.9% for AGIs $50k-75k, 74.8% for AGIs $75k-100k, 76.4% for AGIs $100k-200k, 65.1% for AGIs over 200k)
Taxable interest for individuals: $1,353 (reported on 32.2% of returns)
This zip code:
$1,353
California:
$2,146
(% of AGI for various income ranges: 0.8% for AGIs below $25k, 0.7% for AGIs $25k-50k, 0.8% for AGIs $50k-75k, 0.7% for AGIs $75k-100k, 0.8% for AGIs $100k-200k, 0.9% for AGIs over 200k)
Ordinary dividends: $4,118 (reported on 16.8% of returns)
Here:
$4,118
State:
$9,308
(% of AGI for various income ranges: 1.1% for AGIs below $25k, 0.7% for AGIs $25k-50k, 1.0% for AGIs $50k-75k, 1.3% for AGIs $75k-100k, 1.3% for AGIs $100k-200k, 1.7% for AGIs over 200k)
Net capital gain/loss in AGI: +$6,808 (reported on 15.2% of returns)
Here:
+$6,808
State:
+$30,460
(% of AGI for various income ranges: 0.5% for AGIs $50k-75k, 0.3% for AGIs $75k-100k, 0.9% for AGIs $100k-200k, 7.0% for AGIs over 200k)
Profit/loss from business: +$13,236 (reported on 21.4% of returns)
Here:
+$13,236
State:
+$17,064
(% of AGI for various income ranges: 16.1% for AGIs below $25k, 5.5% for AGIs $25k-50k, 4.4% for AGIs $50k-75k, 3.7% for AGIs $75k-100k, 3.8% for AGIs $100k-200k, 2.9% for AGIs over 200k)
Taxable individual retirement arrangement distribution: $18,605 (reported on 7.8% of returns)
91304:
$18,605
California:
$19,557
(% of AGI for various income ranges: 1.7% for AGIs below $25k, 1.8% for AGIs $25k-50k, 2.4% for AGIs $50k-75k, 3.2% for AGIs $75k-100k, 3.1% for AGIs $100k-200k, 2.7% for AGIs over 200k)
Self-employment retirement plans: $18,362 (reported on 0.7% of returns)
91304:
$18,362
California:
$24,530
(% of AGI for various income ranges: 0.1% for AGIs below $25k, 0.4% for AGIs $50k-75k, 0.3% for AGIs $100k-200k, 0.4% for AGIs over 200k)
Total itemized deductions: $29,163 (26% of AGI, reported on 33.6% of returns)
Here:
$29,163
State:
$34,004
Here:
26.4% of AGI
State:
22.7% of AGI
(% of AGI for various income ranges: 10.6% for AGIs below $25k, 12.1% for AGIs $25k-50k, 18.6% for AGIs $50k-75k, 20.5% for AGIs $75k-100k, 21.7% for AGIs $100k-200k, 17.2% for AGIs over 200k)
Charity contributions: $3,109 (reported on 28.3% of returns)
Here:
$3,109
State:
$4,659
(% of AGI for various income ranges: 0.5% for AGIs below $25k, 0.9% for AGIs $25k-50k, 1.5% for AGIs $50k-75k, 1.9% for AGIs $75k-100k, 2.1% for AGIs $100k-200k, 1.7% for AGIs over 200k)
Taxes paid: $10,532 (reported on 33.5% of returns)
91304:
$10,532
State:
$14,448
(% of AGI for various income ranges: 2.1% for AGIs below $25k, 2.7% for AGIs $25k-50k, 5.0% for AGIs $50k-75k, 6.4% for AGIs $75k-100k, 8.2% for AGIs $100k-200k, 9.2% for AGIs over 200k)
Earned income credit: $2,283 (reported on 20.1% of returns)
Here:
$2,283
State:
$2,286
(% of AGI for various income ranges: 6.7% for AGIs below $25k, 1.2% for AGIs $25k-50k)
Percentage of individuals using paid preparers for their 2012 taxes: 70.8%
Here:
71%
State:
64%
(% for various income ranges: 69.8% for AGIs below $25k, 71.5% for AGIs $25k-50k, 70.3% for AGIs $50k-75k, 70.1% for AGIs $75k-100k, 72.3% for AGIs $100k-200k, 77.0% for AGIs over 200k)
Averages for the 2004 tax year for zip code 91304, filed in 2005:
Average Adjusted Gross Income (AGI) in 2004: $49,134 (Individual Income Tax Returns)
Here:
$49,134
State:
$58,600
Salary/wage: $45,954 (reported on 84.0% of returns)
Here:
$45,954
State:
$49,455
(% of AGI for various income ranges: 169.9% for AGIs below $10k, 80.1% for AGIs $10k-25k, 85.1% for AGIs $25k-50k, 80.3% for AGIs $50k-75k, 78.7% for AGIs $75k-100k, 73.2% for AGIs over 100k)
Taxable interest for individuals: $1,541 (reported on 42.8% of returns)
This zip code:
$1,541
California:
$2,365
(% of AGI for various income ranges: 9.4% for AGIs below $10k, 1.8% for AGIs $10k-25k, 1.0% for AGIs $25k-50k, 1.4% for AGIs $50k-75k, 1.4% for AGIs $75k-100k, 1.2% for AGIs over 100k)
Taxable dividends: $2,463 (reported on 21.9% of returns)
Here:
$2,463
State:
$4,746
(% of AGI for various income ranges: 7.0% for AGIs below $10k, 0.9% for AGIs $10k-25k, 0.8% for AGIs $25k-50k, 1.0% for AGIs $50k-75k, 0.9% for AGIs $75k-100k, 1.3% for AGIs over 100k)
Net capital gain/loss: +$6,818 (reported on 19.3% of returns)
Here:
+$6,818
State:
+$23,418
(% of AGI for various income ranges: -6.1% for AGIs below $10k, -0.1% for AGIs $10k-25k, 0.2% for AGIs $25k-50k, 0.4% for AGIs $50k-75k, 1.1% for AGIs $75k-100k, 5.7% for AGIs over 100k)
Profit/loss from business: +$14,425 (reported on 20.0% of returns)
Here:
+$14,425
State:
+$16,826
(% of AGI for various income ranges: 32.0% for AGIs below $10k, 9.1% for AGIs $10k-25k, 5.3% for AGIs $25k-50k, 4.2% for AGIs $50k-75k, 5.2% for AGIs $75k-100k, 5.8% for AGIs over 100k)
IRA payment deduction: $3,380 (reported on 3.0% of returns)
91304:
$3,380
California:
$3,192
(% of AGI for various income ranges: 0.4% for AGIs below $10k, 0.2% for AGIs $10k-25k, 0.3% for AGIs $25k-50k, 0.3% for AGIs $50k-75k, 0.3% for AGIs $75k-100k, 0.1% for AGIs over 100k)
Self-employed pension: $16,385 (reported on 1.3% of returns)
Here:
$16,385
California:
$17,688
(% of AGI for various income ranges: 0.1% for AGIs $10k-25k, 0.1% for AGIs $25k-50k, 0.2% for AGIs $50k-75k, 0.3% for AGIs $75k-100k, 0.8% for AGIs over 100k)
Total itemized deductions: $26,050 (29% of AGI, reported on 38.1% of returns)
Here:
$26,050
State:
$28,113
Here:
28.6% of AGI
State:
25.3% of AGI
(% of AGI for various income ranges: 38.7% for AGIs below $10k, 11.7% for AGIs $10k-25k, 17.1% for AGIs $25k-50k, 22.7% for AGIs $50k-75k, 24.2% for AGIs $75k-100k, 21.0% for AGIs over 100k)
Charity contributions deductions: $3,028 (3% of AGI, reported on 34.0% of returns)
Here:
$3,028
State:
$3,923
Here:
3.2% of AGI
State:
3.3% of AGI
(% of AGI for various income ranges: 1.4% for AGIs below $10k, 0.8% for AGIs $10k-25k, 1.6% for AGIs $25k-50k, 2.3% for AGIs $50k-75k, 2.6% for AGIs $75k-100k, 2.4% for AGIs over 100k)
Total tax: $7,746 (reported on 74.5% of returns)
91304:
$7,746
State:
$10,761
(% of AGI for various income ranges: 9.4% for AGIs below $10k, 4.2% for AGIs $10k-25k, 6.4% for AGIs $25k-50k, 8.7% for AGIs $50k-75k, 9.8% for AGIs $75k-100k, 17.2% for AGIs over 100k)
Earned income credit: $1,768 (reported on 17.2% of returns)
Here:
$1,768
State:
$1,763
Percentage of individuals using paid preparers for their 2004 taxes: 73.1%
Here:
73%
State:
66%
(% for various income ranges: 68.1% for AGIs below $10k, 76.7% for AGIs $10k-25k, 73.0% for AGIs $25k-50k, 71.3% for AGIs $50k-75k, 74.8% for AGIs $75k-100k, 73.1% for AGIs over 100k)
Household received Food Stamps/SNAP in the past 12 months: 2,665 Household did not receive Food Stamps/SNAP in the past 12 months: 15,995
Women who had a birth in the past 12 months: 608 (340 now married, 269 unmarried) Women who did not have a birth in the past 12 months: 12,175 (4,560 now married, 7,625 unmarried)
Housing units in zip code 91304 with a mortgage: 6,254 (692 second mortgage, 553 both second mortgage and home equity loan) Houses without a mortgage: 79
Median monthly owner costs for units with a mortgage: $3,207 Median monthly owner costs for units without a mortgage: $1,004
Residents with income below the poverty level in 2022:
This zip code:
12.4%
Whole state:
12.2%
Residents with income below 50% of the poverty level in 2022:
This zip code:
8.0%
Whole state:
6.2%
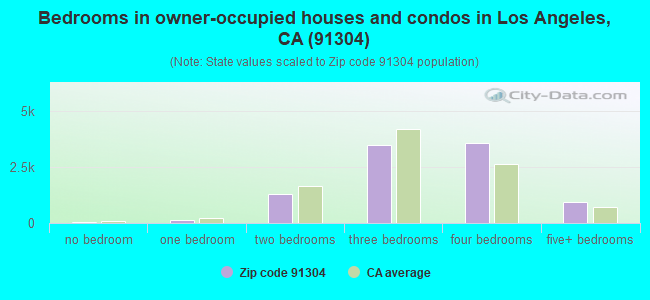
Median number of rooms in houses and condos:
Here:
6.2
State:
6.0
Median number of rooms in apartments:
Here:
3.7
State:
3.9
Notable locations in this zip code not listed on our city pages
Notable locations in zip code 91304: Rancho Sombra Del Roble (A), Box Canyon Fire Station (B), City of Los Angeles Fire Department Station 106 (C). Display/hide their locations on the map
Parks in zip code 91304 include: Lanark Park (1), Chase Park (2), Parthenia Park (3), Castle Peak Park (4), Chatsworth Reservoir Park (5), Lazy J Ranch Park (6), Orcutt Ranch Horticultural Center Park (7), Taxco Trails Park (8), Valley Circle Park (9). Display/hide their locations on the map
Tourist attractions (not listed on the city page) : Aqua Trends- LLC (Aquariums; 7921 Canoga Ave Unit I), Academy of Karate (Amusement & Theme Parks; 23743 Roscoe Boulevard), AVG Inc (Amusement & Theme Parks; 21344 Deering Court), Awesome Bounce (Arcades & Amusements; 21430 Strathern).
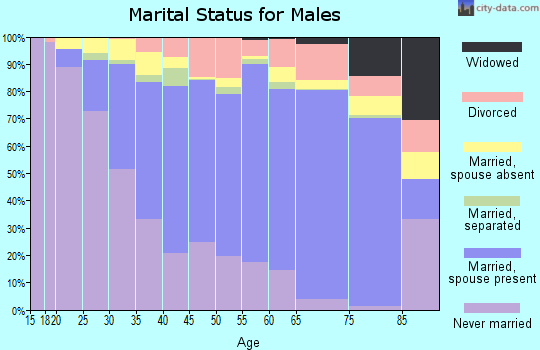
5,804 married couples with children.
3,101 single-parent households (689 men, 2,412 women).
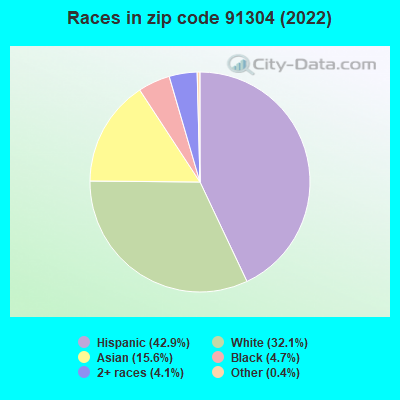
44.9% of residents of 91304 zip code speak English at home.
35.3% of residents speak Spanish at home (55% very well, 20% well, 16% not well, 8% not at all).
8.7% of residents speak other Indo-European language at home (62% very well, 20% well, 16% not well, 2% not at all).
9.8% of residents speak Asian or Pacific Island language at home (61% very well, 24% well, 10% not well, 4% not at all).
1.6% of residents speak other language at home (75% very well, 13% well, 8% not well, 4% not at all).
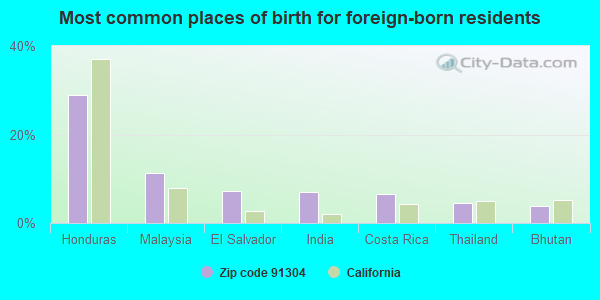
Foreign born population: 20,109 (37.3%) (56.2% of them are naturalized citizens)
This zip code:
37.3%
Whole state:
26.7%
29%Honduras
11%Malaysia
7%El Salvador
7%India
6%Costa Rica
5%Thailand
4%Bhutan
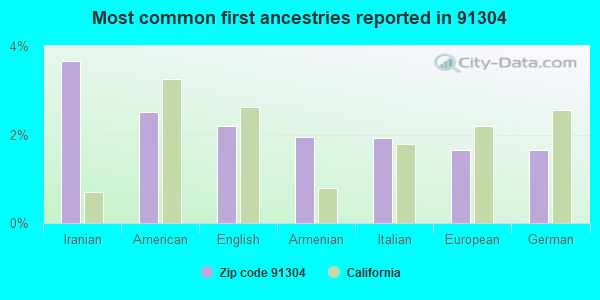
4%Iranian
3%American
2%English
2%Armenian
2%Italian
2%European
2%German
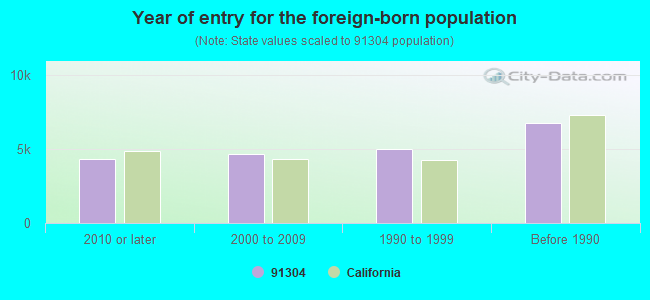
Year of entry for the foreign-born population
4,3202010 or later
4,6472000 to 2009
5,0341990 to 1999
6,757Before 1990
Private high school in in this zip code not listed on the city page:
Major facilities with environmental interests located in this zip code:
ACUSON CORPORATION (8357 CANOGA AVENUE in CANOGA PARK, CA)
STATE MASTER (California - Hazardous Waste Tracking) - HAZARDOU WASTE PROGRAM HAZARDOUS WASTE BIENNIAL REPORTER (Resource Conservation and Recovery Act (tracking hazardous waste)) Large Quantity Generators, more that 1000 kg of hazardous waste/month (Resource Conservation and Recovery Act (tracking hazardous waste)) - notification TRI REPORTER (Tracking of toxic chemicals releasing facilities) Business SIC classification: PRINTED CIRCUIT BOARDS Business NAICS classification: BARE PRINTED CIRCUIT BOARD MANUFACTURING. Organizations: 3M (CONTACT/OPERATOR)
, SFV PROPERTIES (CONTACT/OWNER)
Alternative names: ACUSON CANOGA PARK FACILITY, GOULD, INC MICRO BOND TECH, SIEMENS MEDICAL SOLUTIONS USA INC
LOS ANGELES USD JUSTICE ELEM SCHOOL (23350 JUSTICE ST in CANOGA PARK, CA)
STATE MASTER (California - Hazardous Waste Tracking) - HAZARDOU WASTE PROGRAM Small Quantity Generators, between 100 kg and 1000 kg of hazardous waste/month (Resource Conservation and Recovery Act (tracking hazardous waste)) - notification Organizations: LOS ANGELES UNIFIED SCHOOL DISTRICT (CONTACT/OWNER)
Alternative names: JUSTICE STREET ELEMENTARY, LAUSD/ JUSTICE ST ELEM
LANDOWNERS LIMITED (8020 DEERING AVE in CANOGA PARK, CA)
STATE MASTER (California - Hazardous Waste Tracking) - HAZARDOU WASTE PROGRAM Small Quantity Generators, between 100 kg and 1000 kg of hazardous waste/month (Resource Conservation and Recovery Act (tracking hazardous waste)) Organizations: THE TRANSIT AUTHORITY (CONTACT/OPERATOR)
, LANDOWNERS LTD PARTNERSHIP (CONTACT/OWNER)
Alternative names: LAND OWNERS LTD PARTNERSHIP
LA USD CAPISTRANO ELEM (8118 CAPISTRANO AVE in CANOGA PARK, CA)
STATE MASTER (California - Hazardous Waste Tracking) - HAZARDOU WASTE PROGRAM Small Quantity Generators, between 100 kg and 1000 kg of hazardous waste/month (Resource Conservation and Recovery Act (tracking hazardous waste)) - notification Alternative names: CAPISTRANO AVENUE ELEMENTARY, LAUSD/ CAPISTRANO AVE ELEM
KARMAN LTD (7931 DEERING AVE in CANOGA PARK, CA)
STATE MASTER (California - Hazardous Waste Tracking) - HAZARDOU WASTE PROGRAM Small Quantity Generators, between 100 kg and 1000 kg of hazardous waste/month (Resource Conservation and Recovery Act (tracking hazardous waste)) - notification Organizations: INC (CONTACT/OWNER)
JACK ELLIS CHRYSLER PLYMOUTH (21422 ROSCOE BLVD in CANOGA PARK, CA)
STATE MASTER (California - Hazardous Waste Tracking) - HAZARDOU WASTE PROGRAM Small Quantity Generators, between 100 kg and 1000 kg of hazardous waste/month (Resource Conservation and Recovery Act (tracking hazardous waste)) - notification Organizations: JOHN H ELLIS (CONTACT/OWNER)
Alternative names: DAVID ELLIS CHRYSLER, INC
FOURTH DIMENSION WORK SYSTEMS INC (21344 DEERING COURT in CANOGA PARK, CA)
STATE MASTER (California - Hazardous Waste Tracking) - HAZARDOU WASTE PROGRAM Small Quantity Generators, between 100 kg and 1000 kg of hazardous waste/month (Resource Conservation and Recovery Act (tracking hazardous waste)) - notification Business NAICS classification: INSTITUTIONAL FURNITURE MANUFACTURING. Organizations: SEE ATTACHMENT (CONTACT/OWNER)
LAIDLAW TRANSIT (8039 CANOGA AVE in CANOGA PARK, CA)
STATE MASTER (California - Hazardous Waste Tracking) - HAZARDOU WASTE PROGRAM Small Quantity Generators, between 100 kg and 1000 kg of hazardous waste/month (Resource Conservation and Recovery Act (tracking hazardous waste)) - notification Organizations: HARVEY MUDD COLLEGE (CONTACT/OWNER)
Alternative names: LAIDLAW EDUCATION SERVICES IN
EQUILON ENTERPRISES (20505 ROSCOE in CANOGA PARK, CA) . Federal Facility
STATE MASTER (California - Hazardous Waste Tracking) - HAZARDOU WASTE PROGRAM Small Quantity Generators, between 100 kg and 1000 kg of hazardous waste/month (Resource Conservation and Recovery Act (tracking hazardous waste)) - notification Organizations: EQUILON ENTERPRISES, LLC (CONTACT/OWNER)
Alternative names: SHELL OIL CO
HUDSON PLATING WORKS (8740 REMMET AVE in CANOGA PARK, CA)
STATE MASTER (California - Hazardous Waste Tracking) - HAZARDOU WASTE PROGRAM Small Quantity Generators, between 100 kg and 1000 kg of hazardous waste/month (Resource Conservation and Recovery Act (tracking hazardous waste)) - notification Organizations: DAVID AND MARCIA HUDSON (CONTACT/OWNER)
CHEVRON STATION NO 93113 (7607 WOODLAKE in WEST HILLS, CA)
STATE MASTER (California - Hazardous Waste Tracking) - HAZARDOU WASTE PROGRAM Small Quantity Generators, between 100 kg and 1000 kg of hazardous waste/month (Resource Conservation and Recovery Act (tracking hazardous waste)) - notification Organizations: CHEVRON PRODUCTS CO (CONTACT/OWNER)
FINN TOOL & INSTRUMENTS INC (8758 REMMET AVE in CANOGA PARK, CA)
STATE MASTER (California - Hazardous Waste Tracking) - HAZARDOU WASTE PROGRAM Small Quantity Generators, between 100 kg and 1000 kg of hazardous waste/month (Resource Conservation and Recovery Act (tracking hazardous waste)) Business NAICS classification: OTHER COMMERCIAL AND SERVICE INDUSTRY MACHINERY MANUFACTURING.
NEVADA AVENUE ELEMENTARY (22120 CHASE ST. in CANOGA PARK, CA)
(National Center for Education Statistics) - STATE ID-6018295 Organizations: LOS ANGELES UNIFIED (SCHOOL DISTRICT)
Housing units lacking complete plumbing facilities: 0.7% Housing units lacking complete kitchen facilities: 4.1%
52.4%Utility gas
41.4%Electricity
2.6%No fuel used
2.3%Bottled, tank, or LP gas
1.0%Solar energy
Population in 1990: 43,675. Population change in the 1990s: +5,551 (+12.7%).
Place of birth for U.S.-born residents:
This state: 26,056
Northeast: 2,263
Midwest: 2,091
South: 1,702
West: 1,030
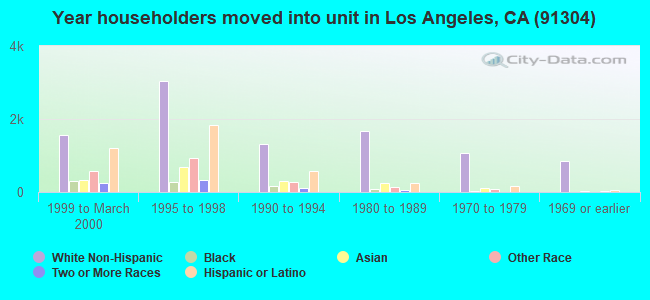
50% of the 91304 zip code residents lived in the same house 5 years ago. Out of people who lived in different houses, 81% lived in this county. Out of people who lived in different counties, 50% lived in California.
90% of the 91304 zip code residents lived in the same house 1 year ago. Out of people who lived in different houses, 74% moved from this county. Out of people who lived in different houses, 9% moved from different county within same state. Out of people who lived in different houses, 6% moved from different state. Out of people who lived in different houses, 11% moved from abroad.
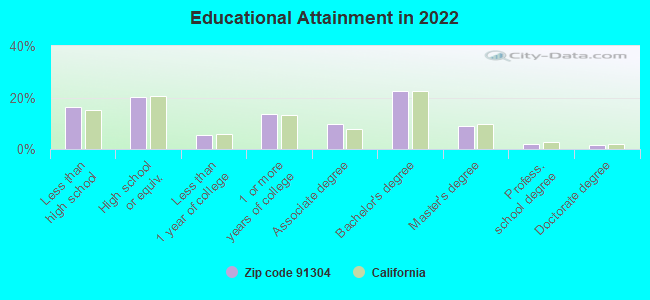
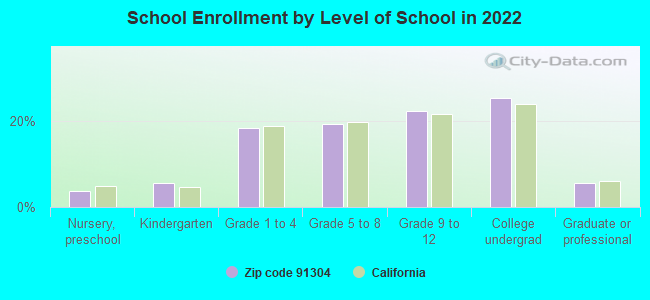
Private vs. public school enrollment:
Students in private schools in grades 1 to 8 (elementary and middle school): 826
Here:
16.9%
California:
10.5%
Students in private schools in grades 9 to 12 (high school): 446
Here:
15.5%
California:
8.5%
Students in private undergraduate colleges: 398
Here:
12.2%
California:
15.9%
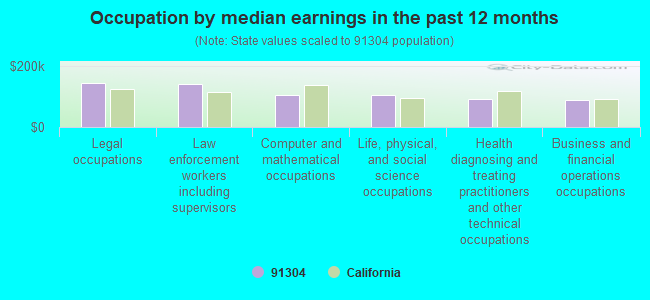
Occupation by median earnings in the past 12 months ($)
145,259Legal occupations
143,091Law enforcement workers including supervisors
105,750Computer and mathematical occupations
104,363Life, physical, and social science occupations
93,722Health diagnosing and treating practitioners and other technical occupations
90,580Business and financial operations occupations
Companies with biggest federal contracts located in this zip code (CANOGA PARK, CA):
W P E INC (8110 REMMET AVE, UNIT 7; small business) : $1,553,252 in 99 contractsfrom 1999 to 2006
Contracts for Aircraft Landing Gear Components, Miscellaneous Power Transmission Equipment, Airframe Structural Components, Aircraft Hydraulic, Vacuum, and De-icing System Components, and moreby Air Force, Defense Logistics Agency Signed by year:2000: $404,927; 2001: $84,616; 2002: $69,585; 2003: $0; 2004: $275,870; 2005: $426,247; 2006: $254,838.
Biggest contracts:
$323,446 with Air Force for Aircraft Landing Gear Components. Signed on 2000-11-14. Completion date: 2001-12-31.
$74,765, same as above.Signed on 2005-10-14. Completion date: 2006-05-01.
$66,684 with Defense Logistics Agency for Miscellaneous Power Transmission Equipment. Signed on 2006-04-17. Completion date: 2006-10-06.
$65,890, same as above.Signed on 2004-01-10. Completion date: 2004-06-08.
ILN TECHNOLOGIES INC (21040 OSBORNE ST; small business) 50 employees, $0 revenue. : $1,148,949 in 72 contractsfrom 1999 to 2006
Contracts for Gas Turbines and Jet Engines, Aircraft; Prime Moving, and Components, Gears, Pulleys, Sprockets, and Transmission Chain, Engine Fuel System Components, Aircraft and Missile Prime Movers, Miscellaneous Aircraft Accessories and Components, and moreby Defense Logistics Agency, Navy, Army, Air Force, and others Signed by year:2000: $226,443; 2001: $133,590; 2002: $183,490; 2003: $167,340; 2004: $136,169; 2005: $183,977; 2006: $88,475.
Biggest contracts:
$98,968 with Defense Logistics Agency for Gas Turbines and Jet Engines, Aircraft; Prime Moving, and Components. Signed on 2000-01-20. Completion date: 2000-03-20.
$76,960, same as above.Signed on 2002-06-15. Completion date: 2002-07-15.
$76,560 with Defense Logistics Agency for Gears, Pulleys, Sprockets, and Transmission Chain. Signed on 2003-10-09. Completion date: 2003-10-30.
$67,405 with Navy for Gas Turbines and Jet Engines, Aircraft; Prime Moving, and Components. Signed on 2002-05-29. Completion date: 2002-07-03.
HEPP, JOSEPH ENGINEERING (22323 LANARK ST; small business) : $850,000 in 3 contractsfrom 2000 to 2005
$375,000 with Air Force for Other Research and Development -- Applied Research and Exploratory Development (R&D). Signed on 2000-03-15. Completion date: 2002-01-22.
$375,000, same as above.Signed on 2000-08-10. Completion date: 2002-01-22.
$100,000 with Air Force for Defense Aircraft -- Applied Research and Exploratory Development (R&D). Signed on 2005-03-18. Completion date: 2005-12-25.
TEMPTRON ENGINEERING INC (7823 DEERING AVE; small business) : $645,911 in 14 contractsfrom 2000 to 2006
Contracts for Pressure, Temperature, and Humidity Measuring and Controlling Instruments by Defense Logistics Agency Signed by year:2000: $121,500; 2001: $208,800; 2002: $0; 2003: $28,350; 2004: $0; 2005: $186,893; 2006: $100,368.
Biggest contracts:
$208,800 with Defense Logistics Agency for Pressure, Temperature, and Humidity Measuring and Controlling Instruments. Signed on 2001-12-07. Completion date: 2002-04-04.
$76,500, same as above.Signed on 2000-07-03. Completion date: 2000-12-15.
$58,533, same as above.Signed on 2005-11-15. Completion date: 2006-05-14.
$54,946, same as above.Signed on 2005-04-08. Completion date: 2005-08-06.
FOURTH DIMENSION WORK SYSTEMS (21260 DEERING COURT) : $191,735 in 2 contractsin 2001
$159,200 with Navy for Other Cryptologic Equipment and Components. Taking place in MA. Signed on 2001-11-30. Completion date: 2001-12-21.
$32,535, same as above.Signed on 2001-09-18. Completion date: 2002-01-31.
COMPUTER ASSOCIATES INTERNATIO (8511 FLLBROOK AVE STE 200) : $171,112 in 11 contractsfrom 1999 to 2004
Contracts for ADP Software, Other ADP and Telecommunications Services (includes data storage on tapes, compact disks, etc.) by ENERGY, Department of, SOCIAL SECURITY ADMINISTRATION, Federal Technology Service, Army, and others Signed by year:2000: $0; 2001: $37,000; 2002: -$16,000; 2003: $0; 2004: -$888; 2005: $0; 2006: $0.
Biggest contracts:
$61,000 with ENERGY, Department of for ADP Software. Taking place in VA. Signed on 1999-11-15. Completion date: 2000-09-15.
$55,000 with SOCIAL SECURITY ADMINISTRATION for Other ADP and Telecommunications Services (includes data storage on tapes, compact disks, etc.). Taking place in MD. Signed on 1999-10-15. Completion date: 2000-09-15.
$44,000 with Federal Technology Service for ADP Software. Signed on 2002-01-15. Completion date: 2002-02-15.
$37,000 with ENERGY, Department of for ADP Software. Signed on 2001-01-15. Completion date: 2001-09-15.
ARNELLAB LLC (21434 OSBORNE ST; small business) : $164,626 in 7 contractsfrom 2001 to 2006
Contracts for Pressure, Temperature, and Humidity Measuring and Controlling Instruments, Generators and Generators Sets, Electrical, Electrical and Electronic Properties Measuring and Testing Instruments, Antennas, Waveguides, and Related Equipment, and moreby Department of State, Air Force, Navy Signed by year:2000: $0; 2001: $73,000; 2002: $59,000; 2003: $0; 2004: $0; 2005: $28,826; 2006: $3,800.
Biggest contracts:
$73,000 with Department of State for Pressure, Temperature, and Humidity Measuring and Controlling Instruments. Signed on 2001-06-15. Completion date: 2001-07-15.
$59,000 with Department of State for Generators and Generators Sets, Electrical. Taking place in DC. Signed on 2002-07-15. Completion date: 2002-08-15.
$11,900 with Air Force for Electrical and Electronic Properties Measuring and Testing Instruments. Signed on 2005-05-10. Completion date: 2005-06-30.
$7,900, same as above.Signed on 2005-02-08. Completion date: 2005-02-22.
MICRO-STEEL INC (7850 ALABAMA AVENUE; small business) : $100,164 in 4 contractsfrom 2003 to 2005
$67,680 with Navy for Aircraft Landing Equipment. Signed on 2003-03-24. Completion date: 2004-08-05.
$26,996 with Navy for Guns, through 30 mm. Signed on 2003-03-20. Completion date: 2003-08-30.
$7,488 with Navy for Bolts. Signed on 2004-10-14. Completion date: 2005-10-14.
-$2,000 with Navy for Aircraft Landing Equipment. Signed on 2005-09-07. Completion date: 2006-08-05.
FITTING SOURCE INC, THE (9041 OWENSMOUTH AVE; small business)
$11,025 with Navy for Hose, Pipe, Tube, Lubrication, and Railing Fittings. Signed on 2006-05-18. Completion date: 2006-06-29.
K B CONTRACT INTERIORS LLC (8371 CANOGA AVE; small business)
$9,850 with Navy for Office Furniture. Taking place in VA. Signed on 2003-09-26. Completion date: 2003-10-24.
Top industries in this zip code by the number of employees in 2005:
Administrative and Support and Waste Management and Remediation Services: Landscaping Services (over 1000 employees: 1 establishment, 100-249 employees: 3 establishments, 20-49 employees: 1 establishment, 5-9 employees: 2 establishments, 1-4 employees: 6 establishments)
2005 - 2018 National Fire Incident Reporting System (NFIRS) incidents
Based on the data from the years 2005 - 2018 the average number of fires per year is 53. The highest number of reported fires - 74 took place in 2017, and the least - 30 in 2010. The data has a dropping trend.
When looking into fire subcategories, the most reports belonged to: Structure Fires (47.3%), and Outside Fires (27.0%).
Fire incident types reported to NFIRS in Zip Code 91304


 Nearest zip codes: 91307, 91303, 91367, 91306, 91371, 93064.


 (Students: 1,248, Location: 7644 FARRALONE AVE, Grades: PK-12)


 Based on the data from the years 2005 - 2018 the average number of fires per year is 53. The highest number of reported fires - 74 took place in 2017, and the least - 30 in 2010. The data has a dropping trend.
 When looking into fire subcategories, the most reports belonged to: Structure Fires (47.3%), and Outside Fires (27.0%).