Estimated zip code population in 2022: 21,121 Zip code population in 2010: 22,986 Zip code population in 2000: 22,538
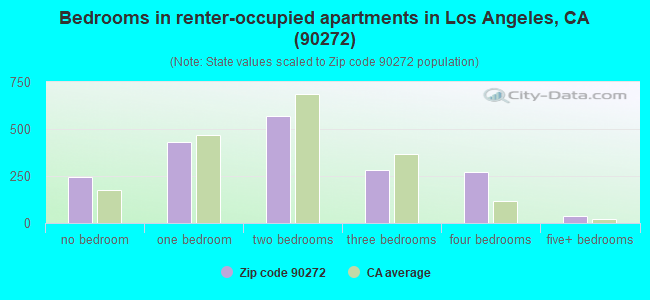
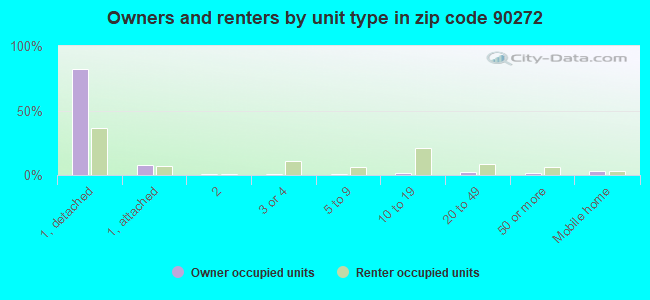
Houses and condos: 9,233 Renter-occupied apartments: 1,829
% of renters here:
22%
State:
44%
March 2022 cost of living index in zip code 90272: 140.1 (very high, U.S. average is 100)
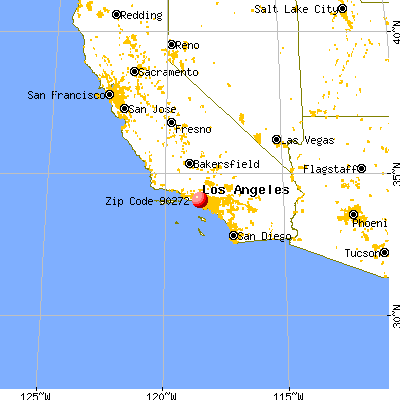
Land area: 22.8 sq. mi. Water area: 0.5 sq. mi.
Population density: 925 people per square mile
(low).
OSM Map
General Map
Google Map
MSN Map
OSM Map
General Map
Google Map
MSN Map
OSM Map
General Map
Google Map
MSN Map
OSM Map
General Map
Google Map
MSN Map
Please wait while loading the map...
Real estate property taxes paid for housing units in 2022:
This zip code:
0.5% ($10,292)
California:
0.7% ($4,831)
Median real estate property taxes paid for housing units with mortgages in 2022: $10,330 (0.5%) Median real estate property taxes paid for housing units with no mortgage in 2022: $8,856 (0.4%)
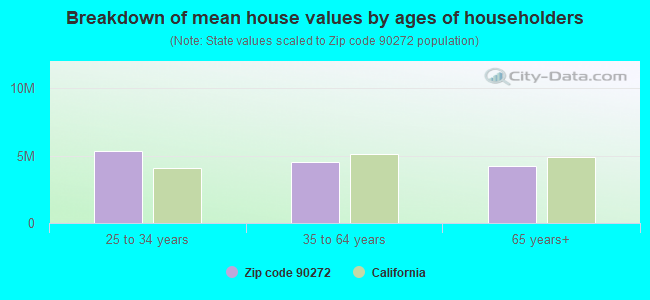
Estimated median house/condo value in 2022: $2,171,698
90272:
$2,171,698
California:
$715,900
According to our research of California and other state lists, there was 1 registered sex offender living in 90272 zip code as of April 27, 2024. The ratio of all residents to sex offenders in zip code 90272 is 23,483 to 1. The ratio of registered sex offenders to all residents in this zip code is much lower than the state average.
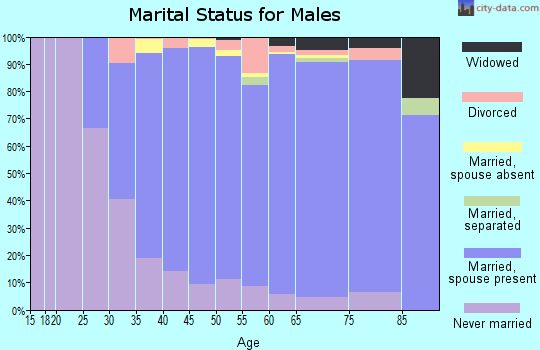
Median resident age:
This zip code:
47.5 years
California median age:
37.9 years
Average household size:
This zip code:
2.5 people
California:
2.8 people
Averages for the 2020 tax year for zip code 90272, filed in 2021:
Average Adjusted Gross Income (AGI) in 2020: $634,108 (Individual Income Tax Returns)
Here:
$634,108
State:
$95,910
Salary/wage: $355,741 (reported on 62.8% of returns)
Here:
$355,741
State:
$77,331
(% of AGI for various income ranges: 1275.8% for AGIs below $25k, 4059.3% for AGIs $25k-50k, 7326.4% for AGIs $50k-75k, 11068.0% for AGIs $75k-100k, 21164.7% for AGIs $100k-200k, 343034.1% for AGIs over 200k)
Taxable interest for individuals: $22,264 (reported on 67.4% of returns)
This zip code:
$22,264
California:
$2,294
(% of AGI for various income ranges: 153.3% for AGIs below $25k, 292.7% for AGIs $25k-50k, 456.4% for AGIs $50k-75k, 500.0% for AGIs $75k-100k, 1253.5% for AGIs $100k-200k, 23216.0% for AGIs over 200k)
Ordinary dividends: $69,630 (reported on 63.8% of returns)
Here:
$69,630
State:
$10,949
(% of AGI for various income ranges: 331.5% for AGIs below $25k, 765.1% for AGIs $25k-50k, 1408.9% for AGIs $50k-75k, 1814.0% for AGIs $75k-100k, 4157.1% for AGIs $100k-200k, 68420.0% for AGIs over 200k)
Net capital gain/loss in AGI: +$273,384 (reported on 62.1% of returns)
Here:
+$273,384
State:
+$49,306
(% of AGI for various income ranges: 218.6% for AGIs below $25k, 515.6% for AGIs $25k-50k, 800.6% for AGIs $50k-75k, 1307.6% for AGIs $75k-100k, 3596.5% for AGIs $100k-200k, 279268.4% for AGIs over 200k)
Profit/loss from business: +$67,297 (reported on 28.1% of returns)
Here:
+$67,297
State:
+$15,671
(% of AGI for various income ranges: 386.6% for AGIs below $25k, 795.6% for AGIs $25k-50k, 1407.5% for AGIs $50k-75k, 1315.2% for AGIs $75k-100k, 3237.1% for AGIs $100k-200k, 26619.0% for AGIs over 200k)
Taxable individual retirement arrangement distribution: $49,999 (reported on 14.8% of returns)
90272:
$49,999
California:
$23,505
(% of AGI for various income ranges: 115.1% for AGIs below $25k, 459.1% for AGIs $25k-50k, 761.9% for AGIs $50k-75k, 1183.6% for AGIs $75k-100k, 3266.3% for AGIs $100k-200k, 8359.4% for AGIs over 200k)
Self-employed (Keogh) retirement plans: $50,240 (reported on 6.6% of returns)
90272:
$50,240
California:
$30,163
(% of AGI for various income ranges: 18.4% for AGIs below $25k, 135.0% for AGIs $50k-75k, 384.7% for AGIs $100k-200k, 5170.6% for AGIs over 200k)
Total itemized deductions: $102,753 (reported on 43.5% of returns)
Here:
$102,753
State:
$39,517
(% of AGI for various income ranges: 683.8% for AGIs below $25k, 1297.8% for AGIs $25k-50k, 2325.8% for AGIs $50k-75k, 3254.8% for AGIs $75k-100k, 7071.4% for AGIs $100k-200k, 64570.0% for AGIs over 200k)
Charity contributions: $63,534 (reported on 38.7% of returns)
Here:
$63,534
State:
$12,598
(% of AGI for various income ranges: 34.3% for AGIs below $25k, 81.3% for AGIs $25k-50k, 196.1% for AGIs $50k-75k, 401.2% for AGIs $75k-100k, 1027.8% for AGIs $100k-200k, 39840.6% for AGIs over 200k)
Taxes paid: $9,407 (reported on 43.4% of returns)
90272:
$9,407
State:
$8,807
(% of AGI for various income ranges: 131.0% for AGIs below $25k, 268.7% for AGIs $25k-50k, 507.5% for AGIs $50k-75k, 717.6% for AGIs $75k-100k, 1542.7% for AGIs $100k-200k, 4643.7% for AGIs over 200k)
Earned income credit: $1,070 (reported on 3.5% of returns)
Here:
$1,070
State:
$2,074
(% of AGI for various income ranges: 37.3% for AGIs below $25k, 22.4% for AGIs $25k-50k)
Percentage of individuals using paid preparers for their 2020 taxes: 92.4%
Here:
92%
State:
92%
(% for various income ranges: 89.2% for AGIs below $25k, 92.3% for AGIs $25k-50k, 92.1% for AGIs $50k-75k, 92.4% for AGIs $75k-100k, 92.7% for AGIs $100k-200k, 94.1% for AGIs over 200k)
Averages for the 2012 tax year for zip code 90272, filed in 2013:
Average Adjusted Gross Income (AGI) in 2012: $486,245 (Individual Income Tax Returns)
Here:
$486,245
State:
$72,726
Salary/wage: $267,677 (reported on 64.4% of returns)
Here:
$267,677
State:
$59,079
(% of AGI for various income ranges: 50.9% for AGIs below $25k, 50.8% for AGIs $25k-50k, 48.7% for AGIs $50k-75k, 43.5% for AGIs $75k-100k, 44.8% for AGIs $100k-200k, 34.4% for AGIs over 200k)
Taxable interest for individuals: $20,364 (reported on 69.3% of returns)
This zip code:
$20,364
California:
$2,146
(% of AGI for various income ranges: 5.2% for AGIs below $25k, 4.1% for AGIs $25k-50k, 3.6% for AGIs $50k-75k, 2.7% for AGIs $75k-100k, 2.9% for AGIs $100k-200k, 2.9% for AGIs over 200k)
Ordinary dividends: $53,489 (reported on 60.8% of returns)
Here:
$53,489
State:
$9,308
(% of AGI for various income ranges: 14.0% for AGIs below $25k, 10.3% for AGIs $25k-50k, 7.3% for AGIs $50k-75k, 7.0% for AGIs $75k-100k, 6.1% for AGIs $100k-200k, 6.6% for AGIs over 200k)
Net capital gain/loss in AGI: +$223,118 (reported on 58.2% of returns)
Here:
+$223,118
State:
+$30,460
(% of AGI for various income ranges: 2.0% for AGIs below $25k, 2.4% for AGIs $25k-50k, 3.5% for AGIs $50k-75k, 3.2% for AGIs $75k-100k, 3.9% for AGIs $100k-200k, 28.9% for AGIs over 200k)
Profit/loss from business: +$50,753 (reported on 29.7% of returns)
Here:
+$50,753
State:
+$17,064
(% of AGI for various income ranges: 19.0% for AGIs below $25k, 13.9% for AGIs $25k-50k, 10.0% for AGIs $50k-75k, 9.9% for AGIs $75k-100k, 8.5% for AGIs $100k-200k, 2.5% for AGIs over 200k)
Taxable individual retirement arrangement distribution: $51,312 (reported on 19.3% of returns)
90272:
$51,312
California:
$19,557
(% of AGI for various income ranges: 6.1% for AGIs below $25k, 4.8% for AGIs $25k-50k, 6.9% for AGIs $50k-75k, 6.6% for AGIs $75k-100k, 7.1% for AGIs $100k-200k, 1.6% for AGIs over 200k)
Self-employment retirement plans: $39,854 (reported on 7.4% of returns)
90272:
$39,854
California:
$24,530
(% of AGI for various income ranges: 0.4% for AGIs $25k-50k, 0.5% for AGIs $50k-75k, 0.7% for AGIs $75k-100k, 1.0% for AGIs $100k-200k, 0.6% for AGIs over 200k)
Total itemized deductions: $125,098 (18% of AGI, reported on 67.5% of returns)
Here:
$125,098
State:
$34,004
Here:
17.8% of AGI
State:
22.7% of AGI
(% of AGI for various income ranges: 43.9% for AGIs below $25k, 32.0% for AGIs $25k-50k, 29.1% for AGIs $50k-75k, 26.8% for AGIs $75k-100k, 26.9% for AGIs $100k-200k, 16.3% for AGIs over 200k)
Charity contributions: $25,670 (reported on 60.3% of returns)
Here:
$25,670
State:
$4,659
(% of AGI for various income ranges: 2.1% for AGIs below $25k, 2.2% for AGIs $25k-50k, 2.3% for AGIs $50k-75k, 2.6% for AGIs $75k-100k, 2.8% for AGIs $100k-200k, 3.2% for AGIs over 200k)
Taxes paid: $72,943 (reported on 67.3% of returns)
90272:
$72,943
State:
$14,448
(% of AGI for various income ranges: 10.0% for AGIs below $25k, 9.3% for AGIs $25k-50k, 8.8% for AGIs $50k-75k, 8.7% for AGIs $75k-100k, 10.4% for AGIs $100k-200k, 10.1% for AGIs over 200k)
Earned income credit: $1,107 (reported on 4.3% of returns)
Here:
$1,107
State:
$2,286
(% of AGI for various income ranges: 1.7% for AGIs below $25k, 0.3% for AGIs $25k-50k)
Percentage of individuals using paid preparers for their 2012 taxes: 80.2%
Here:
80%
State:
64%
(% for various income ranges: 71.9% for AGIs below $25k, 74.1% for AGIs $25k-50k, 75.3% for AGIs $50k-75k, 75.7% for AGIs $75k-100k, 82.0% for AGIs $100k-200k, 89.2% for AGIs over 200k)
Averages for the 2004 tax year for zip code 90272, filed in 2005:
Average Adjusted Gross Income (AGI) in 2004: $258,177 (Individual Income Tax Returns)
Here:
$258,177
State:
$58,600
Salary/wage: $187,197 (reported on 62.4% of returns)
Here:
$187,197
State:
$49,455
(% of AGI for various income ranges: 48.6% for AGIs $10k-25k, 51.4% for AGIs $25k-50k, 47.9% for AGIs $50k-75k, 46.1% for AGIs $75k-100k, 43.7% for AGIs over 100k)
Taxable interest for individuals: $11,105 (reported on 76.2% of returns)
This zip code:
$11,105
California:
$2,365
(% of AGI for various income ranges: 9.3% for AGIs $10k-25k, 6.4% for AGIs $25k-50k, 5.6% for AGIs $50k-75k, 4.4% for AGIs $75k-100k, 2.9% for AGIs over 100k)
Taxable dividends: $20,918 (reported on 65.8% of returns)
Here:
$20,918
State:
$4,746
(% of AGI for various income ranges: 11.1% for AGIs $10k-25k, 6.0% for AGIs $25k-50k, 6.1% for AGIs $50k-75k, 5.8% for AGIs $75k-100k, 5.0% for AGIs over 100k)
Net capital gain/loss: +$74,360 (reported on 62.0% of returns)
Here:
+$74,360
State:
+$23,418
(% of AGI for various income ranges: 3.3% for AGIs $10k-25k, 3.5% for AGIs $25k-50k, 3.5% for AGIs $50k-75k, 5.0% for AGIs $75k-100k, 18.3% for AGIs over 100k)
Profit/loss from business: +$49,015 (reported on 29.0% of returns)
Here:
+$49,015
State:
+$16,826
(% of AGI for various income ranges: 12.9% for AGIs $10k-25k, 14.2% for AGIs $25k-50k, 12.6% for AGIs $50k-75k, 9.5% for AGIs $75k-100k, 5.0% for AGIs over 100k)
IRA payment deduction: $4,189 (reported on 4.1% of returns)
90272:
$4,189
California:
$3,192
(% of AGI for various income ranges: 0.5% for AGIs $10k-25k, 0.5% for AGIs $25k-50k, 0.4% for AGIs $50k-75k, 0.3% for AGIs $75k-100k, 0.0% for AGIs over 100k)
Self-employed pension: $30,758 (reported on 8.0% of returns)
Here:
$30,758
California:
$17,688
(% of AGI for various income ranges: 1.1% for AGIs $25k-50k, 1.2% for AGIs $50k-75k, 1.1% for AGIs $75k-100k, 0.9% for AGIs over 100k)
Total itemized deductions: $76,166 (19% of AGI, reported on 64.0% of returns)
Here:
$76,166
State:
$28,113
Here:
19.1% of AGI
State:
25.3% of AGI
(% of AGI for various income ranges: 41.4% for AGIs $10k-25k, 31.2% for AGIs $25k-50k, 32.4% for AGIs $50k-75k, 32.0% for AGIs $75k-100k, 17.3% for AGIs over 100k)
Charity contributions deductions: $14,681 (3% of AGI, reported on 58.8% of returns)
Here:
$14,681
State:
$3,923
Here:
3.4% of AGI
State:
3.3% of AGI
(% of AGI for various income ranges: 3.0% for AGIs $10k-25k, 2.7% for AGIs $25k-50k, 3.1% for AGIs $50k-75k, 3.0% for AGIs $75k-100k, 3.3% for AGIs over 100k)
Total tax: $70,967 (reported on 83.2% of returns)
90272:
$70,967
State:
$10,761
(% of AGI for various income ranges: 6.0% for AGIs $10k-25k, 9.2% for AGIs $25k-50k, 10.9% for AGIs $50k-75k, 11.3% for AGIs $75k-100k, 23.2% for AGIs over 100k)
Earned income credit: $875 (reported on 3.4% of returns)
Here:
$875
State:
$1,763
Percentage of individuals using paid preparers for their 2004 taxes: 80.7%
Here:
81%
State:
66%
(% for various income ranges: 75.3% for AGIs below $10k, 75.0% for AGIs $10k-25k, 74.8% for AGIs $25k-50k, 78.9% for AGIs $50k-75k, 79.7% for AGIs $75k-100k, 86.7% for AGIs over 100k)
Household received Food Stamps/SNAP in the past 12 months: 57 Household did not receive Food Stamps/SNAP in the past 12 months: 8,008
Women who had a birth in the past 12 months: 239 (221 now married, 17 unmarried) Women who did not have a birth in the past 12 months: 3,456 (1,747 now married, 1,693 unmarried)
Housing units in zip code 90272 with a mortgage: 4,350 (476 second mortgage, 22 home equity loan, 460 both second mortgage and home equity loan) Houses without a mortgage: 31
Median monthly owner costs for units with a mortgage: $3,876 Median monthly owner costs for units without a mortgage: $1,556
Residents with income below the poverty level in 2022:
This zip code:
4.5%
Whole state:
12.2%
Residents with income below 50% of the poverty level in 2022:
This zip code:
1.2%
Whole state:
6.2%
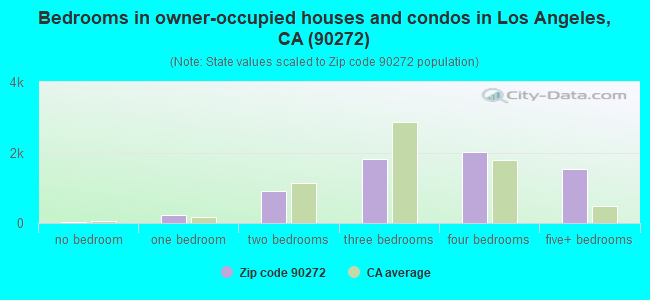
Median number of rooms in houses and condos:
Here:
7.4
State:
6.0
Median number of rooms in apartments:
Here:
4.4
State:
3.9
Notable locations in this zip code not listed on our city pages
Notable locations in zip code 90272: Conference Grounds (A), Claude Parker Ranch (B), Camp Josepho (C), Temescal Lookout (D), Will Rogers Ranch (E), Riviera Country Club (F), Presbyterian Conference Grounds (G), Palisades Branch Los Angeles Public Library (H), J Paul Getty Museum (I), Eames House (J), City of Los Angeles Fire Department Station 69 (K), City of Los Angeles Fire Department Station 23 (L). Display/hide their locations on the map
Parks in zip code 90272 include: Polo Field (1), Will Rogers State Beach (2), Will Rogers State Park (3), Temescal Canyon Park (4), Almar Plaza (5), Asilomar Park (6), Rivas Canyon Park (7), Rustic Canyon Park (8), Santa Ynez Canyon Park (9). Display/hide their locations on the map
In group quarters: 72 (-1 institutionalized population)
Size of family households: 2,626 2-persons, 1,247 3-persons, 1,393 4-persons, 368 5-persons, 130 6-persons, 55 7-or-more-persons
Size of nonfamily households: 1,969 1-person, 459 2-persons, 27 3-persons
4,478 married couples with children.
688 single-parent households (295 men, 393 women).
85.0% of residents of 90272 zip code speak English at home.
3.4% of residents speak Spanish at home (89% very well, 8% well, 3% not well).
7.0% of residents speak other Indo-European language at home (95% very well, 3% well, 2% not well).
4.3% of residents speak Asian or Pacific Island language at home (69% very well, 17% well, 11% not well, 3% not at all).
0.6% of residents speak other language at home (100% very well).
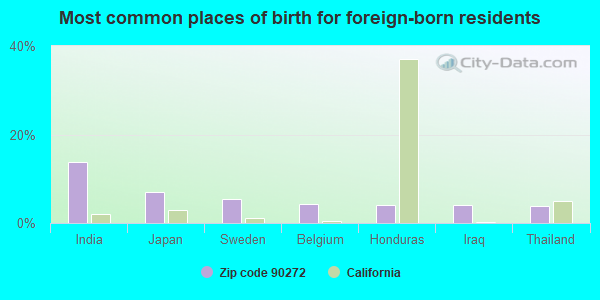
Foreign born population: 3,170 (15.0%) (76.2% of them are naturalized citizens)
This zip code:
15.0%
Whole state:
26.7%
14%India
7%Japan
5%Sweden
4%Belgium
4%Honduras
4%Iraq
4%Thailand
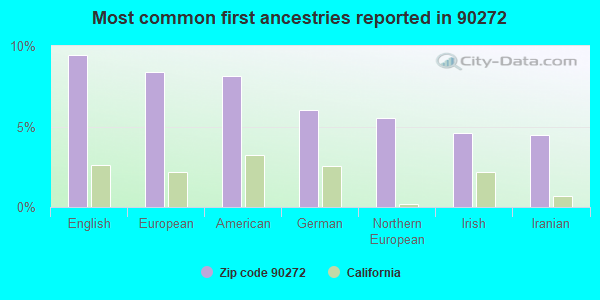
9%English
8%European
8%American
6%German
6%Northern European
5%Irish
4%Iranian
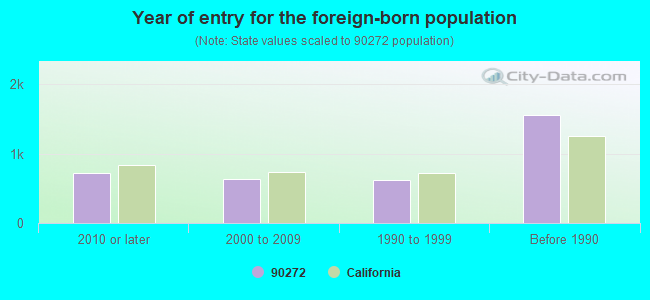
Year of entry for the foreign-born population
7272010 or later
6342000 to 2009
6241990 to 1999
1,555Before 1990
Major facilities with environmental interests located in this zip code:
LA FIRE STATION 69 (15045 SUNSET BLVD in PACIFIC PALISADES, CA)
STATE MASTER (California - Hazardous Waste Tracking) - HAZARDOU WASTE PROGRAM (Resource Conservation and Recovery Act (tracking hazardous waste)) Organizations: CITY OF LA (CONTACT/OWNER)
Alternative names: CITY OF LA GENERAL SERVICES
LA FIRE STATION 23 (17281 SUNSET BLVD in PACIFIC PALISADES, CA)
STATE MASTER (California - Hazardous Waste Tracking) - HAZARDOU WASTE PROGRAM Small Quantity Generators, between 100 kg and 1000 kg of hazardous waste/month (Resource Conservation and Recovery Act (tracking hazardous waste)) - notification Organizations: CITY OF LA (CONTACT/OWNER)
Alternative names: CITY OF LA GENERAL SERVICES
CHEVRON STATION 91324 (17301 PACIFIC COAST HIGHWAY in PACIFIC PALISADES, CA)
STATE MASTER (California - Hazardous Waste Tracking) - HAZARDOU WASTE PROGRAM Small Quantity Generators, between 100 kg and 1000 kg of hazardous waste/month (Resource Conservation and Recovery Act (tracking hazardous waste)) - notification Organizations: CHEVRON PRODUCTS CO (CONTACT/OWNER)
MURRE CLEANERS (534 PALISADES in PACIFIC PALISADES, CA)
STATE MASTER (California - Hazardous Waste Tracking) - HAZARDOU WASTE PROGRAM Small Quantity Generators, between 100 kg and 1000 kg of hazardous waste/month (Resource Conservation and Recovery Act (tracking hazardous waste)) - notification Organizations: YOUNG SUL YUN (CONTACT/OWNER)
(National Center for Education Statistics) - STATE ID-6018063 Organizations: LOS ANGELES UNIFIED (SCHOOL DISTRICT)
EXXON MOBIL OIL CORP (15281 W SUNSET BLVD in PACIFIC PALISADES, CA)
HAZARDOUS WASTE BIENNIAL REPORTER (Resource Conservation and Recovery Act (tracking hazardous waste)) Large Quantity Generators, more that 1000 kg of hazardous waste/month (Resource Conservation and Recovery Act (tracking hazardous waste))
EMERSON & LAMAY (1045 SWARTHMORE AVE in PACIFIC PALISADES, CA)
Small Quantity Generators, between 100 kg and 1000 kg of hazardous waste/month (Resource Conservation and Recovery Act (tracking hazardous waste)) Organizations: BUD EMERSON (CONTACT/OWNER)
JIM DANDY CLEANERS (16605 SUNSET BVD in PACIFIC PALISADES, CA)
Small Quantity Generators, between 100 kg and 1000 kg of hazardous waste/month (Resource Conservation and Recovery Act (tracking hazardous waste)) - notification Organizations: GEORGE COHAN (CONTACT/OWNER)
LA PALISADES LIBRARY (861 ALMA REAL DR in PACIFIC PALISADES, CA)
Small Quantity Generators, between 100 kg and 1000 kg of hazardous waste/month (Resource Conservation and Recovery Act (tracking hazardous waste)) - notification Organizations: CITY OF LOS ANGELES (CONTACT/OWNER)
LA PUMPING PLANT #39 (16600 PACIFIC COAST HWY in PACIFIC PALISADES, CA)
Small Quantity Generators, between 100 kg and 1000 kg of hazardous waste/month (Resource Conservation and Recovery Act (tracking hazardous waste)) - notification Organizations: CITY OF LOS ANGELES (CONTACT/OWNER)
LOS ANGELES PUMPING PLANT 34 (157 TEMESCAL CANYON ROAD in PACIFIC PALISADES, CA)
Small Quantity Generators, between 100 kg and 1000 kg of hazardous waste/month (Resource Conservation and Recovery Act (tracking hazardous waste)) - notification Organizations: CITY OF LA (CONTACT/OWNER)
Alternative names: LA PUMPING PLANT 34
ALLSPORT USA (17383 SUNSET BLVD STE 300 in PACIFIC PALISADES, CA)
Small Quantity Generators, between 100 kg and 1000 kg of hazardous waste/month (Resource Conservation and Recovery Act (tracking hazardous waste)) - notification Organizations: STEVE POWELL (CONTACT/OWNER)
Housing units lacking complete plumbing facilities: 0.0% Housing units lacking complete kitchen facilities: 1.2%
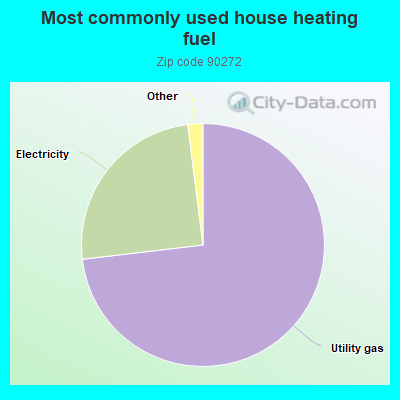
73.2%Utility gas
24.9%Electricity
0.9%Bottled, tank, or LP gas
0.8%No fuel used
Population in 1990: 20,984. Population change in the 1990s: +1,554 (+7.4%).
Place of birth for U.S.-born residents:
This state: 10,142
Northeast: 3,308
Midwest: 1,728
South: 1,407
West: 847
65% of the 90272 zip code residents lived in the same house 5 years ago. Out of people who lived in different houses, 79% lived in this county. Out of people who lived in different counties, 50% lived in California.
90% of the 90272 zip code residents lived in the same house 1 year ago. Out of people who lived in different houses, 78% moved from this county. Out of people who lived in different houses, 7% moved from different county within same state. Out of people who lived in different houses, 11% moved from different state. Out of people who lived in different houses, 1% moved from abroad.
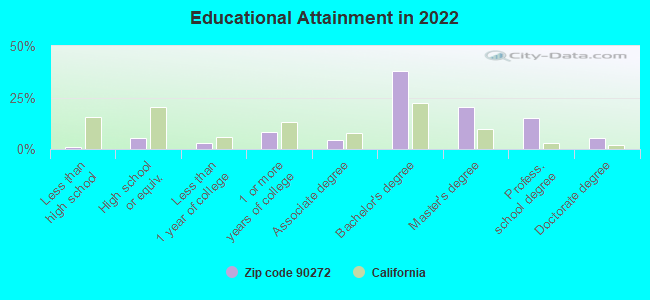
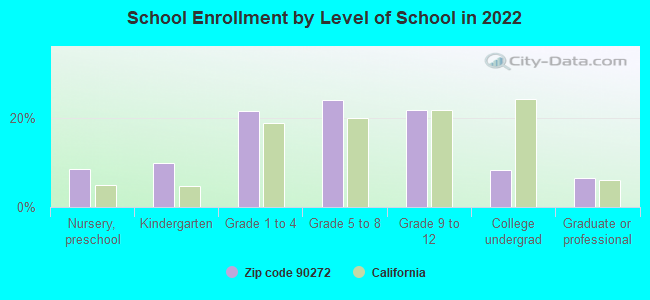
Private vs. public school enrollment:
Students in private schools in grades 1 to 8 (elementary and middle school): 1,074
Here:
42.6%
California:
10.5%
Students in private schools in grades 9 to 12 (high school): 436
Here:
37.2%
California:
8.5%
Students in private undergraduate colleges: 248
Here:
54.3%
California:
15.9%
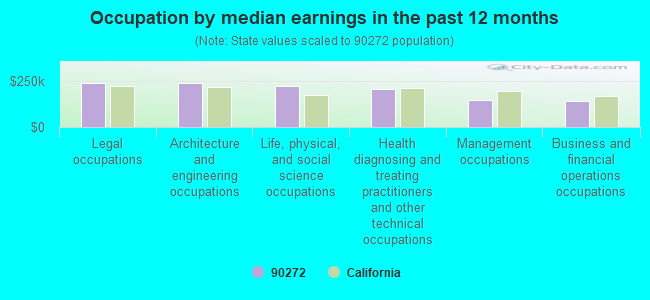
Occupation by median earnings in the past 12 months ($)
237,352Legal occupations
236,850Architecture and engineering occupations
223,498Life, physical, and social science occupations
203,587Health diagnosing and treating practitioners and other technical occupations
145,403Management occupations
139,953Business and financial operations occupations
Companies with federal contracts located in this zip code:
CALIFORNIA INVESTORS IV, A CAL (401 EL MEDIO AVE in PACIFIC PALISA, CA; small business) : $3,407,278 in 2 contractsin 1999
$3,407,278 with Air Force for Lease or Rental of Facilities -- Family Housing Facilities. Signed on 1999-12-23. Completion date: 2000-09-30.
$0, same as above.Signed on 1999-12-23. Completion date: 2000-09-30.
LEVEL SET SYSTEMS INC (1058 EMBURY ST in PACIFIC PALISA, CA; small business) : $2,562,114 in 14 contractsfrom 2000 to 2006
Contracts for Other Professional Services, Other Defense -- Applied Research and Exploratory Development (R&D), Other Defense -- Basic Research (R&D), Other Defense -- Operational Systems Development (R&D), and moreby Department of Defense, Army, Navy, National Geospatial-Intelligence Agency, and others Signed by year:2000: $119,975; 2001: $399,944; 2002: $180,009; 2003: $298,969; 2004: $474,978; 2005: $849,900; 2006: $238,339.
Biggest contracts:
$475,000 with Department of Defense for Other Professional Services. Signed on 2005-04-08. Completion date: 2008-05-24.
$375,000 with Army for Other Defense -- Applied Research and Exploratory Development (R&D). Signed on 2004-04-12. Completion date: 2006-07-24.
$374,900, same as above.Signed on 2005-05-27. Completion date: 2006-07-24.
$300,000 with Navy for Other Defense -- Applied Research and Exploratory Development (R&D). Signed on 2001-05-21. Completion date: 2003-04-30.
TRANS TECHNOLOGY GROUP (554 RADCLIFFE ST in PACIFIC PALISA, CA; small business) : $262,743 in 16 contractsfrom 2003 to 2006
Contracts for ADPE System Configuration, Automated News Services, Data Services, or Other Information Services. Buying data, the electronic equivalent of books, periodicals, newspapers, etc., ADP Facility Operation and Maintenance Services, Miscellaneous Communication Equipment, and moreby Army Signed by year:2000: $0; 2001: $0; 2002: $0; 2003: $54,000; 2004: $70,942; 2005: $143,671; 2006: -$5,870.
Biggest contracts:
$108,320 with Army for ADPE System Configuration. Signed on 2005-07-27. Completion date: 2006-07-28.
$77,121 with Army for Automated News Services, Data Services, or Other Information Services. Buying data, the electronic equivalent of books, periodicals, newspapers, etc.. Taking place in TX. Signed on 2005-11-30. Completion date: 2008-09-30.
$75,327 with Army for ADP Facility Operation and Maintenance Services. Signed on 2005-08-03. Effective on 2005-08-08. Completion date: 2006-06-14.
$54,000 with Army for Automated News Services, Data Services, or Other Information Services. Buying data, the electronic equivalent of books, periodicals, newspapers, etc.. Taking place in TX. Signed on 2003-11-12. Completion date: 2004-09-30.
LANCEY, KATHRYN (17211 AVENIDA DE LA HERRAD in PACIFIC PALISA, CA; small business) : $160,416 in 4 contractsfrom 2000 to 2003
$41,376 with Department of Defense for Miscellaneous Items. Signed on 2003-02-26. Completion date: 2004-03-14.
$40,560, same as above.Signed on 2002-04-03. Completion date: 2002-04-20.
$39,600, same as above.Signed on 2001-04-19. Completion date: 2001-05-01.
$38,880, same as above.Signed on 2000-03-01. Completion date: 2000-03-27.
LASSOM TECHNOLOGIES (1331 AVENIDA DE CORTEZ in PACIFIC PALISA, CA; small business)
$133,700 with Navy for Other Research and Development -- Applied Research and Exploratory Development (R&D). Signed on 2000-01-17. Completion date: 2000-09-30.
f. michael ferrante (1562 Chastain Parkway West in Pacific Palisades, CA; small business)
$35,400 with Offices, Boards and Divisions (includes Attorney General, Deputy Attorney General, etc.) for Expert Witness. Signed on 2004-01-01. Completion date: 2004-06-30.
DIVERSTECH CO (15515 SUNSET BLVD , SUITE in PACIFIC PALISA, CA; small business) : $29,349 in 2 contractsin 2001
$381,901 with Defense Logistics Agency for Notions and Apparel Findings. Taking place in NJ. Signed on 2001-11-06. Completion date: 2002-02-01.
-$352,552, same as above.Signed on 2001-11-06. Completion date: 2002-03-01.
Top industries in this zip code by the number of employees in 2005:
2005 - 2018 National Fire Incident Reporting System (NFIRS) incidents
According to the data from the years 2005 - 2018 the average number of fires per year is 36. The highest number of fire incidents - 52 took place in 2005, and the least - 19 in 2012. The data has a declining trend.
When looking into fire subcategories, the most reports belonged to: Structure Fires (55.5%), and Outside Fires (26.7%).
Fire incident types reported to NFIRS in Zip Code 90272


 Nearest zip codes: 90049, 90402, 91356, 90290, 90403, 91316.


 According to the data from the years 2005 - 2018 the average number of fires per year is 36. The highest number of fire incidents - 52 took place in 2005, and the least - 19 in 2012. The data has a declining trend.
 When looking into fire subcategories, the most reports belonged to: Structure Fires (55.5%), and Outside Fires (26.7%).