Estimated zip code population in 2022: 10,998 Zip code population in 2010: 10,506 Zip code population in 2000: 9,852
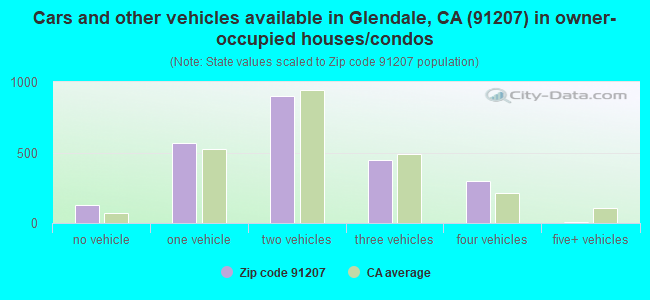
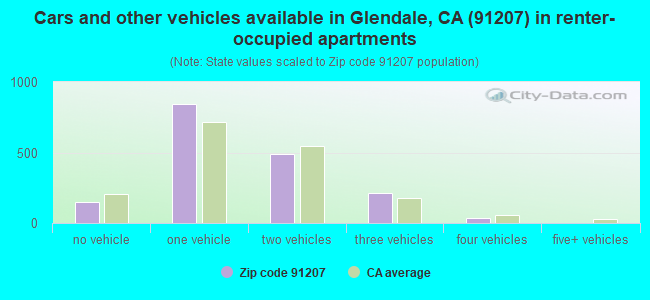
Houses and condos: 4,307 Renter-occupied apartments: 1,722
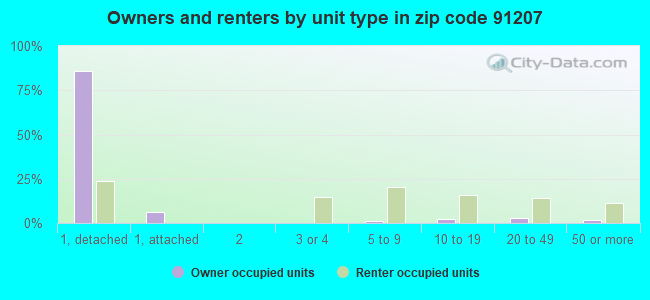
% of renters here:
42%
State:
44%
March 2022 cost of living index in zip code 91207: 140.7 (very high, U.S. average is 100)
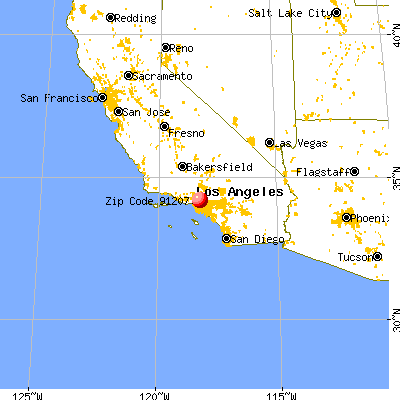
Land area: 4.5 sq. mi. Water area: 0.0 sq. mi.
Population density: 2,421 people per square mile
(low).
OSM Map
General Map
Google Map
MSN Map
OSM Map
General Map
Google Map
MSN Map
OSM Map
General Map
Google Map
MSN Map
OSM Map
General Map
Google Map
MSN Map
Please wait while loading the map...
Real estate property taxes paid for housing units in 2022:
This zip code:
0.7% ($8,751)
California:
0.7% ($4,831)
Median real estate property taxes paid for housing units with mortgages in 2022: $8,783 (0.7%) Median real estate property taxes paid for housing units with no mortgage in 2022: $8,998 (0.8%)
Business Search- 14 Million verified businesses
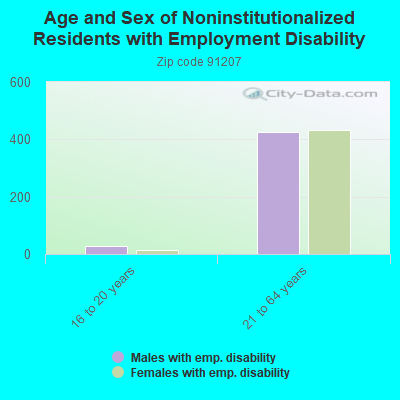
Males: 5,526
(50.2%)
Females: 5,472
(49.8%)
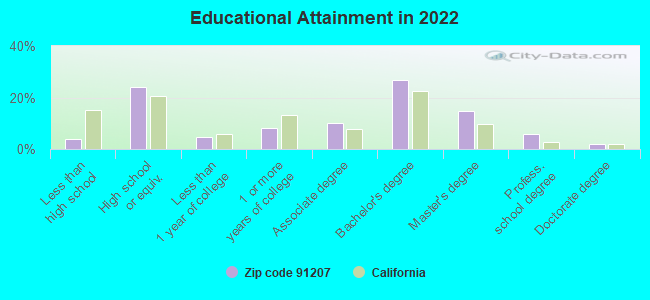
For population 25 years and over in 91207:
High school or higher: 97.0%
Bachelor's degree or higher: 49.5%
Graduate or professional degree: 22.5%
Unemployed: 3.6%
Mean travel time to work (commute): 30.0 minutes
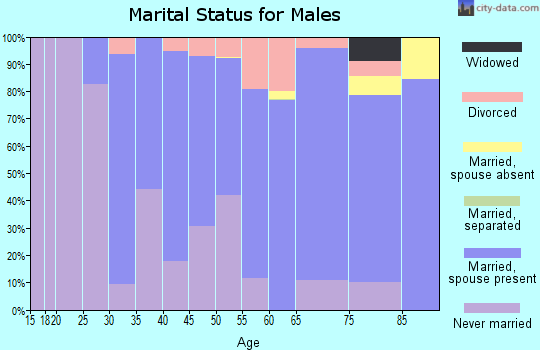
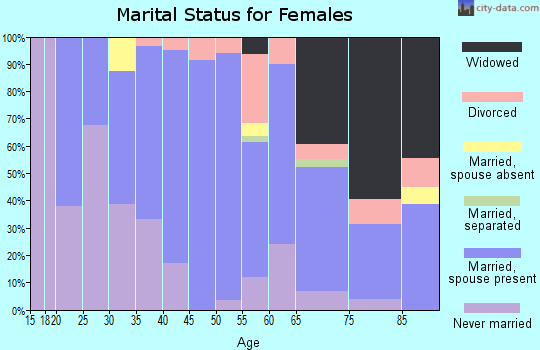
For population 15 years and over in 91207:
Never married: 33.4%
Now married: 51.4%
Separated: 3.2%
Widowed: 5.5%
Divorced: 6.5%
Zip code 91207 compared to state average:
Median house value above state average.
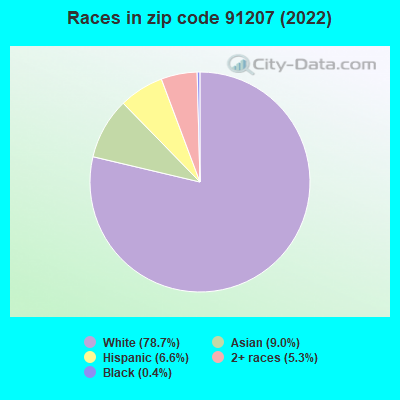
Black race population percentage significantly below state average.
Hispanic race population percentage significantly below state average.
Median age above state average.
Foreign-born population percentage above state average.
Length of stay since moving in above state average.
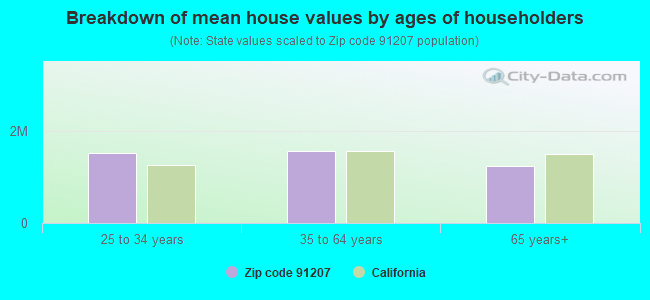
Estimated median house/condo value in 2022: $1,262,842
91207:
$1,262,842
California:
$715,900
According to our research of California and other state lists, there were 2 registered sex offenders living in 91207 zip code as of April 27, 2024. The ratio of all residents to sex offenders in zip code 91207 is 5,108 to 1. The ratio of registered sex offenders to all residents in this zip code is much lower than the state average.
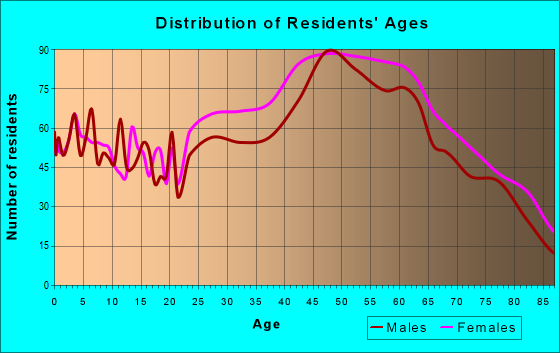
Median resident age:
This zip code:
44.0 years
California median age:
37.9 years
Average household size:
This zip code:
2.7 people
California:
2.8 people
Averages for the 2020 tax year for zip code 91207, filed in 2021:
Average Adjusted Gross Income (AGI) in 2020: $154,164 (Individual Income Tax Returns)
Here:
$154,164
State:
$95,910
Salary/wage: $98,146 (reported on 73.6% of returns)
Here:
$98,146
State:
$77,331
(% of AGI for various income ranges: 1245.1% for AGIs below $25k, 4334.0% for AGIs $25k-50k, 7756.0% for AGIs $50k-75k, 12530.9% for AGIs $75k-100k, 24256.9% for AGIs $100k-200k, 101387.9% for AGIs over 200k)
Taxable interest for individuals: $3,339 (reported on 47.5% of returns)
This zip code:
$3,339
California:
$2,294
(% of AGI for various income ranges: 44.3% for AGIs below $25k, 83.0% for AGIs $25k-50k, 124.9% for AGIs $50k-75k, 258.2% for AGIs $75k-100k, 484.4% for AGIs $100k-200k, 2396.3% for AGIs over 200k)
Ordinary dividends: $9,207 (reported on 31.4% of returns)
Here:
$9,207
State:
$10,949
(% of AGI for various income ranges: 52.2% for AGIs below $25k, 73.6% for AGIs $25k-50k, 218.0% for AGIs $50k-75k, 315.0% for AGIs $75k-100k, 700.8% for AGIs $100k-200k, 5201.6% for AGIs over 200k)
Net capital gain/loss in AGI: +$36,900 (reported on 31.6% of returns)
Here:
+$36,900
State:
+$49,306
(% of AGI for various income ranges: 8.2% for AGIs below $25k, 95.7% for AGIs $25k-50k, 116.6% for AGIs $50k-75k, 346.8% for AGIs $75k-100k, 1136.9% for AGIs $100k-200k, 27844.2% for AGIs over 200k)
Profit/loss from business: +$19,676 (reported on 27.8% of returns)
Here:
+$19,676
State:
+$15,671
(% of AGI for various income ranges: 331.1% for AGIs below $25k, 430.9% for AGIs $25k-50k, 629.7% for AGIs $50k-75k, 695.9% for AGIs $75k-100k, 1361.7% for AGIs $100k-200k, 7753.7% for AGIs over 200k)
Taxable individual retirement arrangement distribution: $26,384 (reported on 8.5% of returns)
91207:
$26,384
California:
$23,505
(% of AGI for various income ranges: 67.7% for AGIs below $25k, 94.7% for AGIs $25k-50k, 248.3% for AGIs $50k-75k, 421.4% for AGIs $75k-100k, 886.7% for AGIs $100k-200k, 2880.0% for AGIs over 200k)
Self-employed (Keogh) retirement plans: $32,322 (reported on 1.8% of returns)
91207:
$32,322
California:
$30,163
(% of AGI for various income ranges: 130.5% for AGIs $75k-100k, 1380.0% for AGIs over 200k)
Total itemized deductions: $87,406 (reported on 27.8% of returns)
Here:
$87,406
State:
$39,517
(% of AGI for various income ranges: 255.7% for AGIs below $25k, 540.2% for AGIs $25k-50k, 1165.4% for AGIs $50k-75k, 1784.1% for AGIs $75k-100k, 4260.6% for AGIs $100k-200k, 49908.4% for AGIs over 200k)
Charity contributions: $11,303 (reported on 23.9% of returns)
Here:
$11,303
State:
$12,598
(% of AGI for various income ranges: 9.4% for AGIs below $25k, 37.0% for AGIs $25k-50k, 100.6% for AGIs $50k-75k, 213.2% for AGIs $75k-100k, 596.9% for AGIs $100k-200k, 5452.1% for AGIs over 200k)
Taxes paid: $9,049 (reported on 27.6% of returns)
91207:
$9,049
State:
$8,807
(% of AGI for various income ranges: 47.5% for AGIs below $25k, 136.6% for AGIs $25k-50k, 264.6% for AGIs $50k-75k, 458.2% for AGIs $75k-100k, 1034.7% for AGIs $100k-200k, 3141.1% for AGIs over 200k)
Earned income credit: $1,484 (reported on 8.5% of returns)
Here:
$1,484
State:
$2,074
(% of AGI for various income ranges: 59.5% for AGIs below $25k, 53.4% for AGIs $25k-50k)
Percentage of individuals using paid preparers for their 2020 taxes: 91.3%
Here:
91%
State:
92%
(% for various income ranges: 90.6% for AGIs below $25k, 91.4% for AGIs $25k-50k, 90.6% for AGIs $50k-75k, 89.4% for AGIs $75k-100k, 91.4% for AGIs $100k-200k, 93.3% for AGIs over 200k)
Averages for the 2012 tax year for zip code 91207, filed in 2013:
Average Adjusted Gross Income (AGI) in 2012: $119,198 (Individual Income Tax Returns)
Here:
$119,198
State:
$72,726
Salary/wage: $85,104 (reported on 76.4% of returns)
Here:
$85,104
State:
$59,079
(% of AGI for various income ranges: 63.3% for AGIs below $25k, 69.0% for AGIs $25k-50k, 67.5% for AGIs $50k-75k, 67.7% for AGIs $75k-100k, 69.7% for AGIs $100k-200k, 44.2% for AGIs over 200k)
Taxable interest for individuals: $2,790 (reported on 50.7% of returns)
This zip code:
$2,790
California:
$2,146
(% of AGI for various income ranges: 2.2% for AGIs below $25k, 1.5% for AGIs $25k-50k, 1.2% for AGIs $50k-75k, 1.7% for AGIs $75k-100k, 1.3% for AGIs $100k-200k, 1.0% for AGIs over 200k)
Ordinary dividends: $8,805 (reported on 29.9% of returns)
Here:
$8,805
State:
$9,308
(% of AGI for various income ranges: 2.9% for AGIs below $25k, 1.4% for AGIs $25k-50k, 2.4% for AGIs $50k-75k, 2.2% for AGIs $75k-100k, 2.4% for AGIs $100k-200k, 2.1% for AGIs over 200k)
Net capital gain/loss in AGI: +$14,428 (reported on 28.6% of returns)
Here:
+$14,428
State:
+$30,460
(% of AGI for various income ranges: 0.4% for AGIs $50k-75k, 0.6% for AGIs $75k-100k, 1.4% for AGIs $100k-200k, 5.5% for AGIs over 200k)
Profit/loss from business: +$21,442 (reported on 25.9% of returns)
Here:
+$21,442
State:
+$17,064
(% of AGI for various income ranges: 19.1% for AGIs below $25k, 10.2% for AGIs $25k-50k, 5.2% for AGIs $50k-75k, 5.1% for AGIs $75k-100k, 5.0% for AGIs $100k-200k, 3.2% for AGIs over 200k)
Taxable individual retirement arrangement distribution: $19,382 (reported on 10.4% of returns)
91207:
$19,382
California:
$19,557
(% of AGI for various income ranges: 3.6% for AGIs below $25k, 2.7% for AGIs $25k-50k, 2.0% for AGIs $50k-75k, 2.0% for AGIs $75k-100k, 2.7% for AGIs $100k-200k, 1.1% for AGIs over 200k)
Self-employment retirement plans: $33,230 (reported on 2.1% of returns)
91207:
$33,230
California:
$24,530
(% of AGI for various income ranges: 1.4% for AGIs below $25k, 0.5% for AGIs $100k-200k, 0.8% for AGIs over 200k)
Total itemized deductions: $44,185 (22% of AGI, reported on 51.4% of returns)
Here:
$44,185
State:
$34,004
Here:
22.0% of AGI
State:
22.7% of AGI
(% of AGI for various income ranges: 22.8% for AGIs below $25k, 18.7% for AGIs $25k-50k, 19.2% for AGIs $50k-75k, 21.2% for AGIs $75k-100k, 22.9% for AGIs $100k-200k, 17.2% for AGIs over 200k)
Charity contributions: $5,738 (reported on 43.6% of returns)
Here:
$5,738
State:
$4,659
(% of AGI for various income ranges: 1.1% for AGIs below $25k, 1.5% for AGIs $25k-50k, 1.7% for AGIs $50k-75k, 1.9% for AGIs $75k-100k, 2.1% for AGIs $100k-200k, 2.3% for AGIs over 200k)
Taxes paid: $19,975 (reported on 51.4% of returns)
91207:
$19,975
State:
$14,448
(% of AGI for various income ranges: 4.7% for AGIs below $25k, 4.5% for AGIs $25k-50k, 5.1% for AGIs $50k-75k, 7.0% for AGIs $75k-100k, 8.7% for AGIs $100k-200k, 9.8% for AGIs over 200k)
Earned income credit: $1,665 (reported on 11.5% of returns)
Here:
$1,665
State:
$2,286
(% of AGI for various income ranges: 4.4% for AGIs below $25k, 0.7% for AGIs $25k-50k)
Percentage of individuals using paid preparers for their 2012 taxes: 73.5%
Here:
73%
State:
64%
(% for various income ranges: 69.8% for AGIs below $25k, 72.6% for AGIs $25k-50k, 67.7% for AGIs $50k-75k, 75.0% for AGIs $75k-100k, 75.9% for AGIs $100k-200k, 84.1% for AGIs over 200k)
Averages for the 2004 tax year for zip code 91207, filed in 2005:
Average Adjusted Gross Income (AGI) in 2004: $85,949 (Individual Income Tax Returns)
Here:
$85,949
State:
$58,600
Salary/wage: $68,715 (reported on 74.2% of returns)
Here:
$68,715
State:
$49,455
(% of AGI for various income ranges: 65.0% for AGIs $10k-25k, 70.1% for AGIs $25k-50k, 70.7% for AGIs $50k-75k, 65.5% for AGIs $75k-100k, 51.9% for AGIs over 100k)
Taxable interest for individuals: $3,651 (reported on 62.1% of returns)
This zip code:
$3,651
California:
$2,365
(% of AGI for various income ranges: 3.8% for AGIs $10k-25k, 3.4% for AGIs $25k-50k, 1.8% for AGIs $50k-75k, 3.0% for AGIs $75k-100k, 2.2% for AGIs over 100k)
Taxable dividends: $5,625 (reported on 37.8% of returns)
Here:
$5,625
State:
$4,746
(% of AGI for various income ranges: 3.4% for AGIs $10k-25k, 2.0% for AGIs $25k-50k, 1.8% for AGIs $50k-75k, 2.1% for AGIs $75k-100k, 2.3% for AGIs over 100k)
Net capital gain/loss: +$21,502 (reported on 34.9% of returns)
Here:
+$21,502
State:
+$23,418
(% of AGI for various income ranges: -0.1% for AGIs $10k-25k, 0.7% for AGIs $25k-50k, 1.4% for AGIs $50k-75k, 0.9% for AGIs $75k-100k, 11.7% for AGIs over 100k)
Profit/loss from business: +$25,630 (reported on 28.1% of returns)
Here:
+$25,630
State:
+$16,826
(% of AGI for various income ranges: 15.6% for AGIs $10k-25k, 10.0% for AGIs $25k-50k, 6.7% for AGIs $50k-75k, 7.7% for AGIs $75k-100k, 7.8% for AGIs over 100k)
IRA payment deduction: $3,884 (reported on 4.7% of returns)
91207:
$3,884
California:
$3,192
(% of AGI for various income ranges: 0.5% for AGIs $10k-25k, 0.5% for AGIs $25k-50k, 0.3% for AGIs $50k-75k, 0.3% for AGIs $75k-100k, 0.1% for AGIs over 100k)
Self-employed pension: $21,857 (reported on 2.9% of returns)
Here:
$21,857
California:
$17,688
(% of AGI for various income ranges: 0.3% for AGIs $10k-25k, 0.3% for AGIs $50k-75k, 0.3% for AGIs $75k-100k, 0.9% for AGIs over 100k)
Total itemized deductions: $35,935 (25% of AGI, reported on 52.6% of returns)
Here:
$35,935
State:
$28,113
Here:
24.7% of AGI
State:
25.3% of AGI
(% of AGI for various income ranges: 24.0% for AGIs $10k-25k, 21.2% for AGIs $25k-50k, 23.0% for AGIs $50k-75k, 25.2% for AGIs $75k-100k, 20.0% for AGIs over 100k)
Charity contributions deductions: $5,568 (4% of AGI, reported on 47.3% of returns)
Here:
$5,568
State:
$3,923
Here:
3.7% of AGI
State:
3.3% of AGI
(% of AGI for various income ranges: 1.7% for AGIs $10k-25k, 2.2% for AGIs $25k-50k, 2.5% for AGIs $50k-75k, 2.4% for AGIs $75k-100k, 3.2% for AGIs over 100k)
Total tax: $17,645 (reported on 83.9% of returns)
91207:
$17,645
State:
$10,761
(% of AGI for various income ranges: 5.9% for AGIs $10k-25k, 8.3% for AGIs $25k-50k, 10.1% for AGIs $50k-75k, 11.1% for AGIs $75k-100k, 19.7% for AGIs over 100k)
Earned income credit: $1,332 (reported on 8.4% of returns)
Here:
$1,332
State:
$1,763
Percentage of individuals using paid preparers for their 2004 taxes: 74.4%
Here:
74%
State:
66%
(% for various income ranges: 69.5% for AGIs below $10k, 72.7% for AGIs $10k-25k, 67.9% for AGIs $25k-50k, 76.9% for AGIs $50k-75k, 74.6% for AGIs $75k-100k, 83.0% for AGIs over 100k)
Household received Food Stamps/SNAP in the past 12 months: 779 Household did not receive Food Stamps/SNAP in the past 12 months: 3,335
Women who had a birth in the past 12 months: 125 (124 now married, 0 unmarried) Women who did not have a birth in the past 12 months: 2,301 (841 now married, 1,463 unmarried)
Housing units in zip code 91207 with a mortgage: 1,582 (289 second mortgage, 175 both second mortgage and home equity loan) Median monthly owner costs for units with a mortgage: $3,876 Median monthly owner costs for units without a mortgage: $1,556
Residents with income below the poverty level in 2022:
This zip code:
9.6%
Whole state:
12.2%
Residents with income below 50% of the poverty level in 2022:
This zip code:
2.8%
Whole state:
6.2%
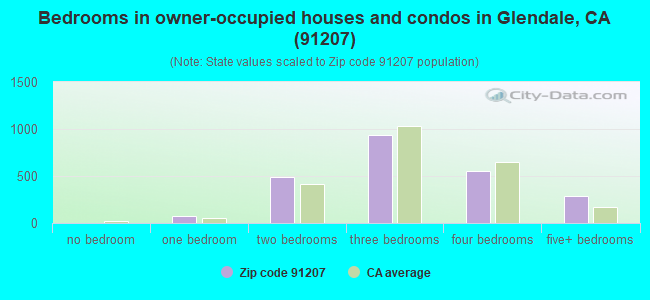
Median number of rooms in houses and condos:
Here:
7.5
State:
6.0
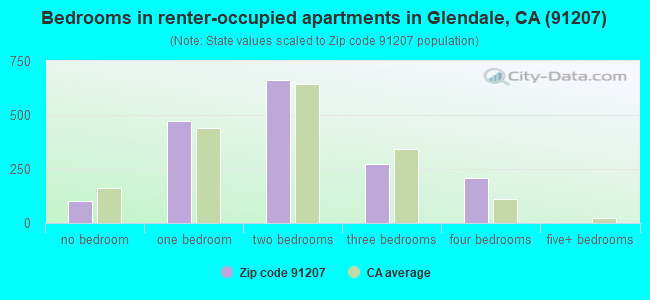
Median number of rooms in apartments:
Here:
4.4
State:
3.9
Notable locations in this zip code not listed on our city pages
1,464 married couples with children.
140 single-parent households (140 women).
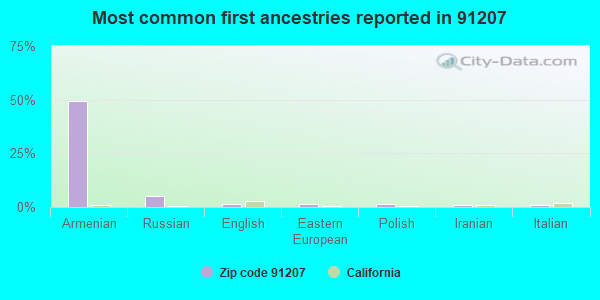
41.1% of residents of 91207 zip code speak English at home.
4.0% of residents speak Spanish at home (71% very well, 29% well).
47.7% of residents speak other Indo-European language at home (66% very well, 17% well, 12% not well, 6% not at all).
6.9% of residents speak Asian or Pacific Island language at home (52% very well, 30% well, 18% not well).
2.7% of residents speak other language at home (61% very well, 11% well, 20% not well, 7% not at all).
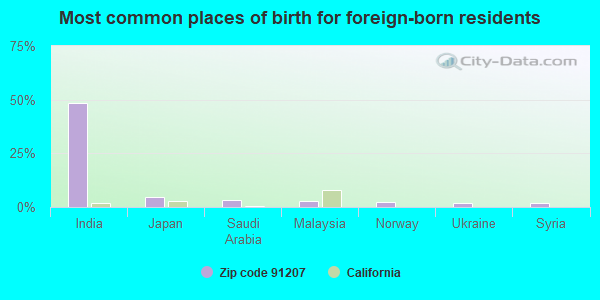
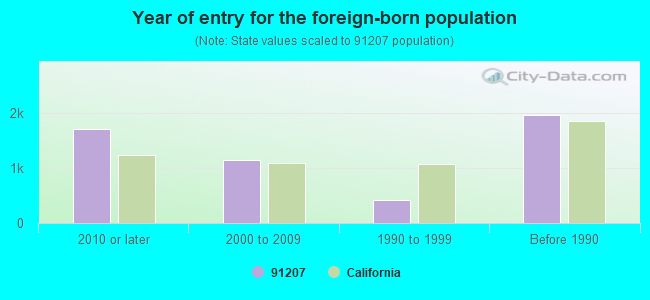
Foreign born population: 5,048 (45.9%) (72.8% of them are naturalized citizens)
Facilities with environmental interests located in this zip code:
MAGIC CLEANERS (419 E GLENOAKS BLVD in GLENDALE, CA)
STATE MASTER (California - Hazardous Waste Tracking) - HAZARDOU WASTE PROGRAM Small Quantity Generators, between 100 kg and 1000 kg of hazardous waste/month (Resource Conservation and Recovery Act (tracking hazardous waste)) - notification Organizations: SANG JUNG HOON (CONTACT/OWNER)
Housing units lacking complete plumbing facilities: 1.2% Housing units lacking complete kitchen facilities: 5.2%
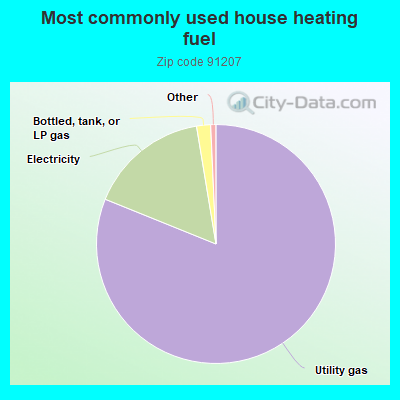
81.2%Utility gas
16.3%Electricity
1.9%Bottled, tank, or LP gas
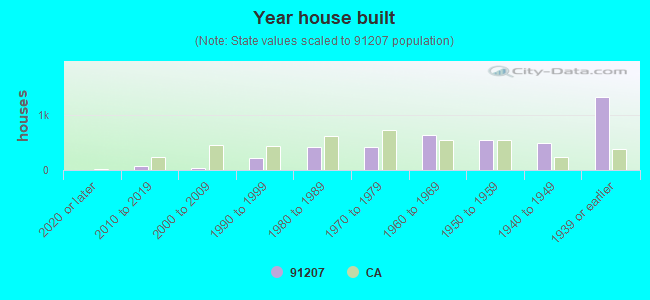
Population in 1990: 8,911. Population change in the 1990s: +941 (+10.6%).
Place of birth for U.S.-born residents:
This state: 4,464
Northeast: 393
Midwest: 499
South: 209
West: 289
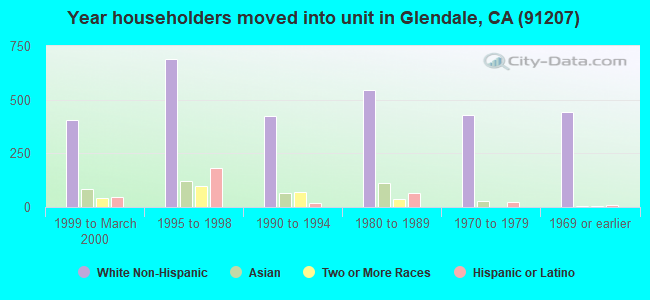
62% of the 91207 zip code residents lived in the same house 5 years ago. Out of people who lived in different houses, 85% lived in this county. Out of people who lived in different counties, 50% lived in California.
85% of the 91207 zip code residents lived in the same house 1 year ago. Out of people who lived in different houses, 79% moved from this county. Out of people who lived in different houses, 10% moved from different county within same state. Out of people who lived in different houses, 4% moved from different state. Out of people who lived in different houses, 2% moved from abroad.
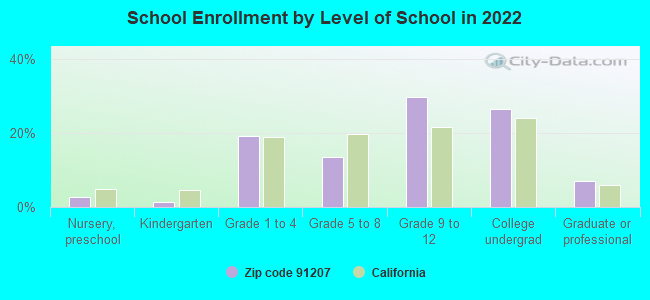
Private vs. public school enrollment:
Students in private schools in grades 1 to 8 (elementary and middle school): 235
Here:
32.2%
California:
10.5%
Students in private schools in grades 9 to 12 (high school): 51
Here:
8.0%
California:
8.5%
Students in private undergraduate colleges: 225
Here:
38.6%
California:
15.9%
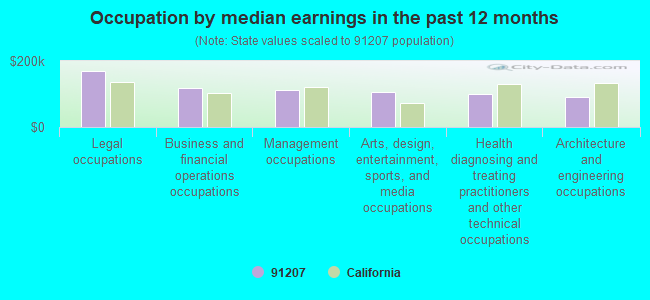
Occupation by median earnings in the past 12 months ($)
168,677Legal occupations
119,107Business and financial operations occupations
111,623Management occupations
107,458Arts, design, entertainment, sports, and media occupations
99,683Health diagnosing and treating practitioners and other technical occupations
90,373Architecture and engineering occupations
Top industries in this zip code by the number of employees in 2005:
Finance and Insurance: Trust, Fiduciary, and Custody Activities (100-249 employees: 1 establishment, 1-4 employees: 1 establishment)
Administrative and Support and Waste Management and Remediation Services: Employment Placement Agencies (100-249: 1, 1-4: 1)
Health Care and Social Assistance: Homes for the Elderly (50-99: 1)
Health Care and Social Assistance: Offices of Dentists (5-9: 4, 1-4: 6)
Administrative and Support and Waste Management and Remediation Services: Office Administrative Services (20-49: 1, 1-4: 2)
Health Care and Social Assistance: Offices of All Other Miscellaneous Health Practitioners (20-49: 1, 1-4: 1)
Health Care and Social Assistance: Offices of Physicians (except Mental Health Specialists) (10-19: 1, 1-4: 10)
Health Care and Social Assistance: Home Health Care Services (20-49: 1)
Professional, Scientific, and Technical Services: Payroll Services (20-49: 1)
Real Estate and Rental and Leasing: Residential Property Managers (5-9: 3, 1-4: 2)
People in group quarters in 2010:
10 people in residential treatment centers for adults
2 people in workers' group living quarters and job corps centers
People in group quarters in 2000:
12 people in homes for the mentally retarded
Home Mortgage Disclosure Act Aggregated Statistics For Year 2009 (Based on 2 full and 2 partial tracts)
A) FHA, FSA/RHS & VA Home Purchase Loans
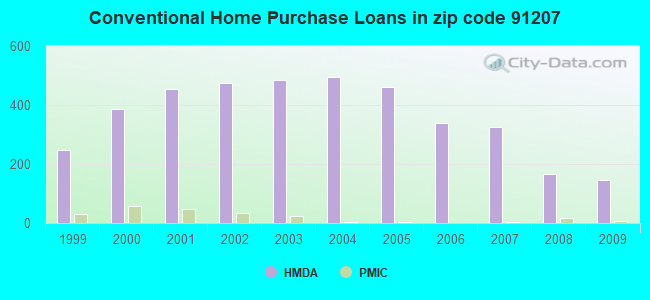
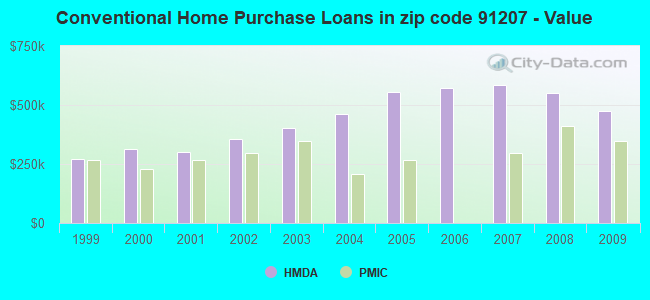
B) Conventional Home Purchase Loans
C) Refinancings
D) Home Improvement Loans
E) Loans on Dwellings For 5+ Families
F) Non-occupant Loans on < 5 Family Dwellings (A B C & D)
Number
Average Value
Number
Average Value
Number
Average Value
Number
Average Value
Number
Average Value
Number
Average Value
LOANS ORIGINATED
13
$603,802
145
$474,841
663
$373,687
28
$312,948
2
$1,072,570
30
$356,782
APPLICATIONS APPROVED, NOT ACCEPTED
2
$633,215
20
$469,958
46
$412,440
0
$0
0
$0
6
$184,260
APPLICATIONS DENIED
7
$610,873
20
$588,993
187
$487,724
8
$173,930
0
$0
12
$286,292
APPLICATIONS WITHDRAWN
6
$370,035
41
$536,971
111
$394,661
3
$122,933
0
$0
8
$354,786
FILES CLOSED FOR INCOMPLETENESS
0
$0
5
$653,386
29
$478,128
2
$130,470
0
$0
4
$279,632
Aggregated Statistics For Year 2008 (Based on 2 full and 2 partial tracts)
A) FHA, FSA/RHS & VA Home Purchase Loans
B) Conventional Home Purchase Loans
C) Refinancings
D) Home Improvement Loans
E) Loans on Dwellings For 5+ Families
F) Non-occupant Loans on < 5 Family Dwellings (A B C & D)
G) Loans On Manufactured Home Dwelling (A B C & D)
Number
Average Value
Number
Average Value
Number
Average Value
Number
Average Value
Number
Average Value
Number
Average Value
Number
Average Value
LOANS ORIGINATED
4
$635,628
166
$548,840
235
$454,134
11
$350,541
2
$999,600
21
$328,088
0
$0
APPLICATIONS APPROVED, NOT ACCEPTED
0
$0
29
$516,828
53
$446,901
2
$434,900
2
$799,680
2
$390,845
0
$0
APPLICATIONS DENIED
7
$602,099
51
$672,685
118
$478,802
9
$603,983
0
$0
10
$271,803
2
$79,970
APPLICATIONS WITHDRAWN
3
$400,687
60
$525,267
85
$469,218
7
$452,889
0
$0
10
$252,499
0
$0
FILES CLOSED FOR INCOMPLETENESS
0
$0
9
$605,712
8
$533,786
6
$404,552
0
$0
0
$0
0
$0
Aggregated Statistics For Year 2007 (Based on 2 full and 2 partial tracts)
B) Conventional Home Purchase Loans
C) Refinancings
D) Home Improvement Loans
E) Loans on Dwellings For 5+ Families
F) Non-occupant Loans on < 5 Family Dwellings (A B C & D)
G) Loans On Manufactured Home Dwelling (A B C & D)
Number
Average Value
Number
Average Value
Number
Average Value
Number
Average Value
Number
Average Value
Number
Average Value
LOANS ORIGINATED
327
$585,036
409
$539,790
48
$415,613
24
$1,062,075
43
$529,824
2
$80,970
APPLICATIONS APPROVED, NOT ACCEPTED
74
$537,261
82
$540,262
5
$645,364
0
$0
15
$402,244
0
$0
APPLICATIONS DENIED
95
$660,537
198
$490,681
21
$204,190
0
$0
27
$490,729
0
$0
APPLICATIONS WITHDRAWN
55
$677,880
96
$473,654
15
$513,595
6
$1,426,097
12
$641,560
0
$0
FILES CLOSED FOR INCOMPLETENESS
7
$757,680
36
$474,764
6
$493,400
0
$0
6
$547,732
0
$0
Aggregated Statistics For Year 2006 (Based on 2 full and 2 partial tracts)
B) Conventional Home Purchase Loans
C) Refinancings
D) Home Improvement Loans
E) Loans on Dwellings For 5+ Families
F) Non-occupant Loans on < 5 Family Dwellings (A B C & D)
G) Loans On Manufactured Home Dwelling (A B C & D)
Number
Average Value
Number
Average Value
Number
Average Value
Number
Average Value
Number
Average Value
Number
Average Value
LOANS ORIGINATED
339
$571,865
468
$500,204
60
$370,472
6
$446,488
47
$424,685
0
$0
APPLICATIONS APPROVED, NOT ACCEPTED
65
$560,551
97
$498,350
11
$336,819
0
$0
3
$338,063
0
$0
APPLICATIONS DENIED
161
$509,941
233
$514,740
26
$320,539
0
$0
29
$502,789
0
$0
APPLICATIONS WITHDRAWN
54
$556,438
147
$445,132
13
$627,796
0
$0
11
$380,981
2
$169,930
FILES CLOSED FOR INCOMPLETENESS
13
$630,507
38
$510,756
3
$487,087
0
$0
2
$939,385
0
$0
Aggregated Statistics For Year 2005 (Based on 2 full and 2 partial tracts)
B) Conventional Home Purchase Loans
C) Refinancings
D) Home Improvement Loans
E) Loans on Dwellings For 5+ Families
F) Non-occupant Loans on < 5 Family Dwellings (A B C & D)
Number
Average Value
Number
Average Value
Number
Average Value
Number
Average Value
Number
Average Value
LOANS ORIGINATED
461
$554,331
647
$492,356
91
$401,393
22
$867,571
53
$457,215
APPLICATIONS APPROVED, NOT ACCEPTED
93
$511,196
86
$470,394
15
$184,991
2
$1,149,540
17
$331,695
APPLICATIONS DENIED
113
$588,434
211
$538,158
24
$371,988
0
$0
11
$401,213
APPLICATIONS WITHDRAWN
90
$590,479
154
$443,604
13
$216,624
2
$429,830
9
$576,884
FILES CLOSED FOR INCOMPLETENESS
24
$457,614
53
$422,003
3
$371,113
0
$0
2
$399,840
Aggregated Statistics For Year 2004 (Based on 2 full and 2 partial tracts)
B) Conventional Home Purchase Loans
C) Refinancings
D) Home Improvement Loans
E) Loans on Dwellings For 5+ Families
F) Non-occupant Loans on < 5 Family Dwellings (A B C & D)
G) Loans On Manufactured Home Dwelling (A B C & D)
Number
Average Value
Number
Average Value
Number
Average Value
Number
Average Value
Number
Average Value
Number
Average Value
LOANS ORIGINATED
494
$461,778
864
$381,254
56
$314,365
16
$955,118
63
$358,456
2
$52,980
APPLICATIONS APPROVED, NOT ACCEPTED
66
$459,470
161
$372,330
7
$256,889
0
$0
6
$172,088
0
$0
APPLICATIONS DENIED
108
$490,554
178
$378,118
19
$100,685
6
$531,453
18
$358,686
0
$0
APPLICATIONS WITHDRAWN
79
$549,653
175
$377,235
9
$271,481
0
$0
13
$421,142
0
$0
FILES CLOSED FOR INCOMPLETENESS
18
$501,234
50
$412,485
8
$176,679
0
$0
4
$494,802
0
$0
Aggregated Statistics For Year 2003 (Based on 2 full and 2 partial tracts)
B) Conventional Home Purchase Loans
C) Refinancings
D) Home Improvement Loans
E) Loans on Dwellings For 5+ Families
F) Non-occupant Loans on < 5 Family Dwellings (A B C & D)
Number
Average Value
Number
Average Value
Number
Average Value
Number
Average Value
Number
Average Value
LOANS ORIGINATED
486
$400,475
2,195
$326,766
20
$120,404
20
$894,642
75
$282,220
APPLICATIONS APPROVED, NOT ACCEPTED
55
$422,419
276
$318,326
9
$122,390
0
$0
7
$382,203
APPLICATIONS DENIED
71
$437,953
272
$349,683
15
$162,685
0
$0
5
$193,234
APPLICATIONS WITHDRAWN
53
$417,442
290
$308,369
3
$48,130
0
$0
3
$564,210
FILES CLOSED FOR INCOMPLETENESS
22
$395,734
78
$372,153
0
$0
0
$0
0
$0
Aggregated Statistics For Year 2002 (Based on 2 full and 2 partial tracts)
A) FHA, FSA/RHS & VA Home Purchase Loans
B) Conventional Home Purchase Loans
C) Refinancings
D) Home Improvement Loans
E) Loans on Dwellings For 5+ Families
F) Non-occupant Loans on < 5 Family Dwellings (A B C & D)
Number
Average Value
Number
Average Value
Number
Average Value
Number
Average Value
Number
Average Value
Number
Average Value
LOANS ORIGINATED
2
$183,925
475
$357,435
1,466
$320,097
22
$162,170
8
$889,644
58
$283,880
APPLICATIONS APPROVED, NOT ACCEPTED
0
$0
55
$343,172
222
$324,951
7
$109,720
0
$0
6
$200,587
APPLICATIONS DENIED
0
$0
88
$337,740
257
$336,293
23
$83,463
2
$1,074,570
11
$229,178
APPLICATIONS WITHDRAWN
2
$183,925
68
$387,427
227
$310,459
7
$148,176
2
$444,820
4
$296,962
FILES CLOSED FOR INCOMPLETENESS
0
$0
15
$334,505
64
$305,858
0
$0
0
$0
5
$338,566
Aggregated Statistics For Year 2001 (Based on 2 full and 2 partial tracts)
A) FHA, FSA/RHS & VA Home Purchase Loans
B) Conventional Home Purchase Loans
C) Refinancings
D) Home Improvement Loans
E) Loans on Dwellings For 5+ Families
F) Non-occupant Loans on < 5 Family Dwellings (A B C & D)
Number
Average Value
Number
Average Value
Number
Average Value
Number
Average Value
Number
Average Value
Number
Average Value
LOANS ORIGINATED
21
$211,188
453
$300,652
962
$279,695
43
$70,941
20
$598,870
44
$234,213
APPLICATIONS APPROVED, NOT ACCEPTED
0
$0
35
$286,903
129
$288,385
3
$111,913
0
$0
0
$0
APPLICATIONS DENIED
0
$0
43
$348,526
218
$297,813
26
$55,545
4
$701,720
5
$175,090
APPLICATIONS WITHDRAWN
4
$170,932
82
$232,515
159
$305,191
16
$98,803
0
$0
12
$191,590
FILES CLOSED FOR INCOMPLETENESS
0
$0
13
$336,755
63
$308,611
0
$0
4
$1,436,925
2
$129,950
Aggregated Statistics For Year 2000 (Based on 2 full and 2 partial tracts)
A) FHA, FSA/RHS & VA Home Purchase Loans
B) Conventional Home Purchase Loans
C) Refinancings
D) Home Improvement Loans
E) Loans on Dwellings For 5+ Families
F) Non-occupant Loans on < 5 Family Dwellings (A B C & D)
Number
Average Value
Number
Average Value
Number
Average Value
Number
Average Value
Number
Average Value
Number
Average Value
LOANS ORIGINATED
2
$84,965
388
$314,991
273
$258,894
49
$65,710
8
$760,945
20
$189,867
APPLICATIONS APPROVED, NOT ACCEPTED
0
$0
66
$346,410
44
$253,234
7
$43,356
0
$0
2
$299,880
APPLICATIONS DENIED
0
$0
67
$316,040
97
$245,249
23
$54,939
0
$0
4
$23,868
APPLICATIONS WITHDRAWN
0
$0
66
$227,121
80
$203,572
7
$43,560
0
$0
2
$103,960
FILES CLOSED FOR INCOMPLETENESS
2
$57,975
16
$395,432
18
$275,721
2
$62,975
0
$0
6
$254,398
Aggregated Statistics For Year 1999 (Based on 2 partial tracts)
A) FHA, FSA/RHS & VA Home Purchase Loans
B) Conventional Home Purchase Loans
C) Refinancings
D) Home Improvement Loans
E) Loans on Dwellings For 5+ Families
F) Non-occupant Loans on < 5 Family Dwellings (A B C & D)


 Nearest zip codes: 91202, 91208, 91203, 91201, 91501, 91046.