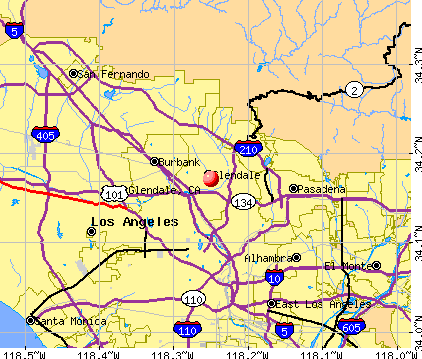
Glendale, California
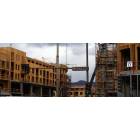
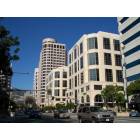
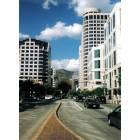
Glendale: Future New Town Center - The Americana at Brand Sept 2007 pic 2
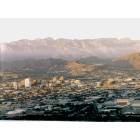
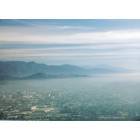
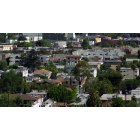
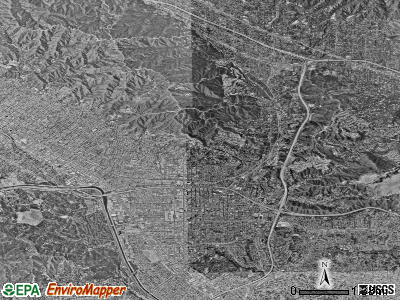
Glendale: Glendale from distance
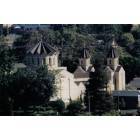
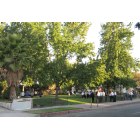
Glendale: Armenian Church in Glendale
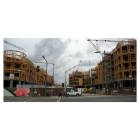
Glendale: Future New Town Center - The Americana at Brand Sept 2007
Glendale: Brand Blvd. in Glendale
Glendale: Brand Blvd
Glendale: Glendale "2000 years ago" :)
Glendale: near colorado st
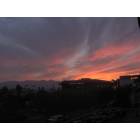
Glendale: Sunset in Glendale
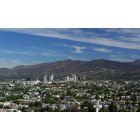
Glendale: from distance
Glendale: ARMENIANS IN GLENDALE " LITTLE ARMENIA"
- see
17
more - add
your
Submit your own pictures of this city and show them to the world
- OSM Map
- General Map
- Google Map
- MSN Map
Population change since 2000: -3.0%
 |
| Males: 88,589 | |
| Females: 100,632 |
| Median resident age: | 42.9 years |
| California median age: | 37.9 years |
Zip codes: 90039, 91011, 91020, 91046, 91201, 91202, 91203, 91204, 91205, 91206, 91207, 91208, 91210, 91214.
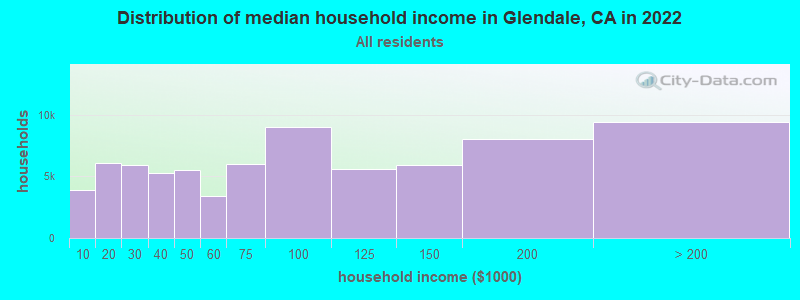
Glendale Zip Code Map| Glendale: | $77,483 |
| CA: | $91,551 |
Estimated per capita income in 2022: $43,262 (it was $22,227 in 2000)
Glendale city income, earnings, and wages data
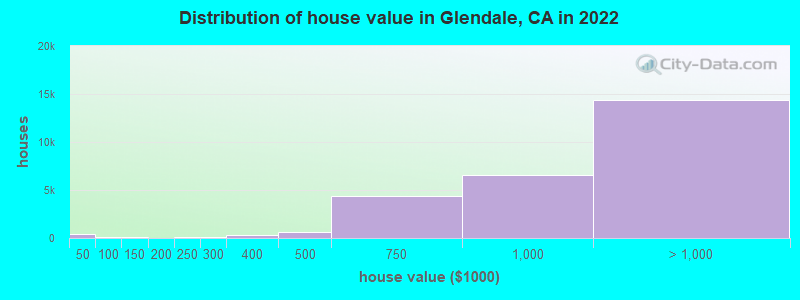
Estimated median house or condo value in 2022: over $1,000,000 (it was $290,400 in 2000)
| Glendale: | over $1,000,000 |
| CA: | $715,900 |
Mean prices in 2022: all housing units: over $1,000,000; detached houses: over $1,000,000; townhouses or other attached units: $797,501; in 2-unit structures: $725,409; in 3-to-4-unit structures: $678,213; in 5-or-more-unit structures: $608,891; mobile homes: $917,250
Median gross rent in 2022: $2,009.
(15.1% for White Non-Hispanic residents, 20.5% for Black residents, 13.6% for Hispanic or Latino residents, 9.1% for American Indian residents, 11.0% for Native Hawaiian and other Pacific Islander residents, 17.0% for other race residents, 8.1% for two or more races residents)
Detailed information about poverty and poor residents in Glendale, CA


Compare current foreclosures in Glendale, CA:
| Photo | Address | Area | Beds / Baths | Price | Details |
|---|---|---|---|---|---|

|
#1
N Everett St
Glendale, CA 91206
|
724 sq. feet
|
1 baths 2 beds |
show details | |

|
#2
Via Saldivar St
Glendale, CA 91208
|
1,771 sq. feet
|
2 baths 2 beds |
show details | |

|
#3
N Howard St
Glendale, CA 91207
|
1,904 sq. feet
|
3 baths 4 beds |
show details | |

|
#4
Las Palmas Ave
Glendale, CA 91208
|
1,265 sq. feet
|
1 baths 2 beds |
show details | |

|
#5
N Jackson St Apt 210
Glendale, CA 91206
|
- sq. feet
|
1 baths 1 beds |
show details | |

|
#6
Flintridge Dr
Glendale, CA 91206
|
2,648 sq. feet
|
3 baths 5 beds |
show details | |

|
#7
Campbell St
Glendale, CA 91207
|
1,920 sq. feet
|
4 baths 5 beds |
show details | |

|
#8
Fischer St
Glendale, CA 91205
|
1,040 sq. feet
|
1 baths 2 beds |
show details | |

|
#9
Thompson Ave
Glendale, CA 91201
|
1,402 sq. feet
|
2 baths 4 beds |
show details | |

|
#10
Canada Blvd
Glendale, CA 91208
|
3,139 sq. feet
|
2 baths 3 beds |
show details |
| Photo | Address | Area | Beds / Baths | Price | Details |
|---|---|---|---|---|---|

|
#11
S Pacific Ave
Glendale, CA 91204
|
872 sq. feet
|
3 baths 4 beds |
show details | |

|
#12
W Dryden St
Glendale, CA 91202
|
1,600 sq. feet
|
2 baths 3 beds |
show details | |

|
#13
Aspen Oak Ln
Glendale, CA 91207
|
6,056 sq. feet
|
4 baths 5 beds |
show details | |

|
#14
Alexander St Unit 3
Glendale, CA 91203
|
1,366 sq. feet
|
3 baths 3 beds |
show details | |

|
#15
N Howard St
Glendale, CA 91207
|
1,904 sq. feet
|
3 baths 4 beds |
show details | |

|
#16
Campbell St
Glendale, CA 91207
|
1,920 sq. feet
|
4 baths 5 beds |
show details | |

|
#17
Las Palmas Ave
Glendale, CA 91208
|
1,265 sq. feet
|
1 baths 2 beds |
show details | |

|
#18
Burchett St Unit 12
Glendale, CA 91203
|
799 sq. feet
|
2 baths 2 beds |
show details | |

|
#19
Valley View Rd Apt 5
Glendale, CA 91202
|
1,183 sq. feet
|
2 baths 2 beds |
show details | |

|
#20
W Maple St Unit 16
Glendale, CA 91204
|
1,262 sq. feet
|
3 baths 2 beds |
show details |
| Photo | Address | Area | Beds / Baths | Price | Details |
|---|---|---|---|---|---|

|
#21
Oakengate Dr
Glendale, CA 91207
|
2,310 sq. feet
|
3 baths 3 beds |
show details | |

|
#22
Burchett St Apt 105
Glendale, CA 91203
|
1,067 sq. feet
|
2 baths 2 beds |
show details | |

|
#23
Opechee Way
Glendale, CA 91208
|
2,145 sq. feet
|
3 baths 3 beds |
show details | |

|
#24
Canada Blvd
Glendale, CA 91208
|
3,139 sq. feet
|
2 baths 3 beds |
show details | |

|
#25
1/2 N Verdugo Rd
Glendale, CA 91206
|
3,344 sq. feet
|
3 baths 6 beds |
show details | |

|
#26
Dale Ave
Glendale, CA 91202
|
1,238 sq. feet
|
2 baths 3 beds |
show details | |

|
#27
N Howard St Apt 7
Glendale, CA 91206
|
1,256 sq. feet
|
3 baths 3 beds |
show details | |

|
#28
Cottage Grove Ave
Glendale, CA 91205
|
784 sq. feet
|
1 baths 2 beds |
show details | |

|
#29
Thompson Ave
Glendale, CA 91201
|
765 sq. feet
|
1 baths 2 beds |
show details | |

|
#30
Irving Ave
Glendale, CA 91201
|
1,128 sq. feet
|
1 baths 2 beds |
show details |
| Photo | Address | Area | Beds / Baths | Price | Details |
|---|---|---|---|---|---|

|
#31
Alma St
Glendale, CA 91202
|
1,802 sq. feet
|
3 baths 3 beds |
show details | |

|
#32
Norton Ave
Glendale, CA 91202
|
1,845 sq. feet
|
2 baths 3 beds |
show details | |

|
#33
Calle Allegre
Glendale, CA 91208
|
2,984 sq. feet
|
4 baths 4 beds |
show details | |

|
#34
Eden Ave
Glendale, CA 91206
|
1,752 sq. feet
|
1 baths 3 beds |
show details | |

|
#35
Gardena Ave
Glendale, CA 91204
|
1,436 sq. feet
|
2 baths 3 beds |
show details | |

|
#36
Val Verde Ct
Glendale, CA 91208
|
1,456 sq. feet
|
2 baths 3 beds |
show details | |

|
#37
Crestview Ave
Glendale, CA 91202
|
2,048 sq. feet
|
2 baths 3 beds |
show details | |

|
#38
Canada Blvd
Glendale, CA 91208
|
1,735 sq. feet
|
2 baths 2 beds |
show details | |

|
#39
Granada St
Glendale, CA 91205
|
1,172 sq. feet
|
1 baths 2 beds |
show details | |

|
#40
W Kenneth Rd
Glendale, CA 91201
|
1,476 sq. feet
|
2 baths 2 beds |
show details |
| Photo | Address | Area | Beds / Baths | Price | Details |
|---|---|---|---|---|---|

|
#41
Crescent Dr
Glendale, CA 91205
|
528 sq. feet
|
2 baths 3 beds |
show details | |

|
#42
W California Ave Apt 108
Glendale, CA 91203
|
1,222 sq. feet
|
3 baths 2 beds |
show details | |

|
#43
Palm Dr Apt 1
Glendale, CA 91202
|
- sq. feet
|
6 baths 5 beds |
show details | |

|
#44
Milford St Apt 3
Glendale, CA 91203
|
- sq. feet
|
- baths - beds |
show details | |

|
#45
Raleigh St Apt 211
Glendale, CA 91205
|
- sq. feet
|
- baths - beds |
show details | |

|
#46
Stanley Ave Apt 101
Glendale, CA 91206
|
- sq. feet
|
- baths - beds |
show details | |

|
#47
W Windsor Rd Apt A
Glendale, CA 91204
|
- sq. feet
|
- baths - beds |
show details | |

|
#48
N Orange St, Apt 108
Glendale, CA 91203
|
- sq. feet
|
- baths - beds |
show details | |

|
#49
Virginia Pl Apt 3
Glendale, CA 91204
|
- sq. feet
|
- baths - beds |
show details | |

|
Check over 1 million property listings on Foreclosure.com!
|
browse all offers | |||


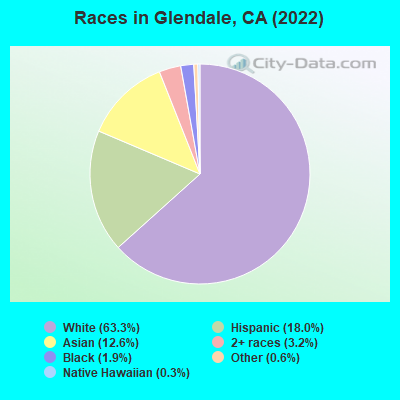
- 119,80663.3%White alone
- 34,01818.0%Hispanic
- 23,93312.6%Asian alone
- 6,1473.2%Two or more races
- 3,5601.9%Black alone
- 1,1260.6%Other race alone
- 5540.3%Native Hawaiian and Other
Pacific Islander alone - 840.04%American Indian alone
According to our research of California and other state lists, there were 70 registered sex offenders living in Glendale, California as of April 27, 2024.
The ratio of all residents to sex offenders in Glendale is 2,869 to 1.
The ratio of registered sex offenders to all residents in this city is much lower than the state average.
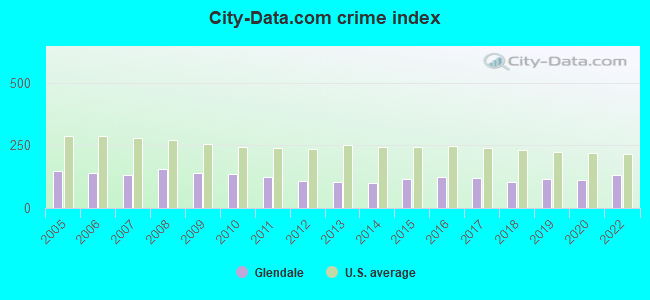
The City-Data.com crime index weighs serious crimes and violent crimes more heavily. Higher means more crime, U.S. average is 246.1. It adjusts for the number of visitors and daily workers commuting into cities.
- means the value is smaller than the state average.- means the value is about the same as the state average.
- means the value is bigger than the state average.
Crime rate in Glendale detailed stats: murders, rapes, robberies, assaults, burglaries, thefts, arson
Full-time law enforcement employees in 2021, including police officers: 328 (228 officers - 205 male; 23 female).
| Officers per 1,000 residents here: | 1.15 |
| California average: | 2.30 |
 Recent articles from our blog. Our writers, many of them Ph.D. graduates or candidates, create easy-to-read articles on a wide variety of topics.

 | 🌳 🏠 I Wish I Lived in Glendale -- What a Magnificent City 🏠 🌳 (73 replies) |
| Glendale--why not? (24 replies) |
| Moving to from Hollywood to Glendale (5 replies) |
| Renting apartment in Glendale (5 replies) |
| Race wars at Glendale High School (11 replies) |
| Victim ejected onto 5 Freeway sign after crash near Glendale (108 replies) |
Latest news from Glendale, CA collected exclusively by city-data.com from local newspapers, TV, and radio stations
Ancestries: Armenian (45.5%), Iranian (1.3%), Russian (1.2%), German (1.1%).
Current Local Time: PST time zone
Land area: 30.6 square miles.
Population density: 6,175 people per square mile (high).
96,661 residents are foreign born (39.9% Asia, 7.3% Latin America).
| This city: | 50.8% |
| California: | 26.5% |
Median real estate property taxes paid for housing units with mortgages in 2022: $7,027 (0.7%)
Median real estate property taxes paid for housing units with no mortgage in 2022: $4,517 (0.5%)
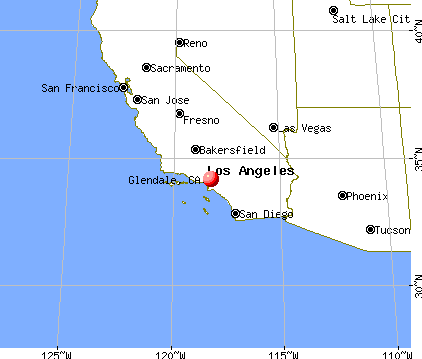
Nearest city with pop. 200,000+: Los Angeles, CA  (9.3 miles , pop. 3,694,820).
Nearest cities:
Latitude: 34.17 N, Longitude: 118.25 W
Daytime population change due to commuting: +5,626 (+3.0%)
Workers who live and work in this city: 38,160 (43.1%)
Area code: 818
Property values in Glendale, CA
Glendale tourist attractions:
Glendale, California accommodation & food services, waste management - Economy and Business Data
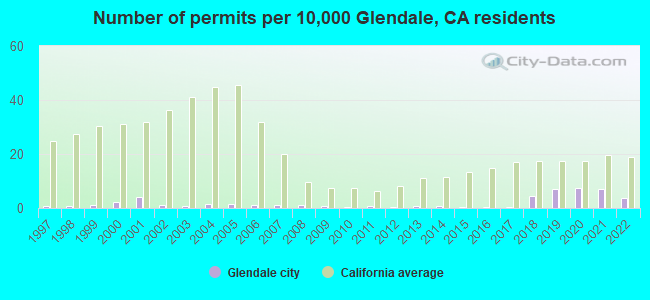
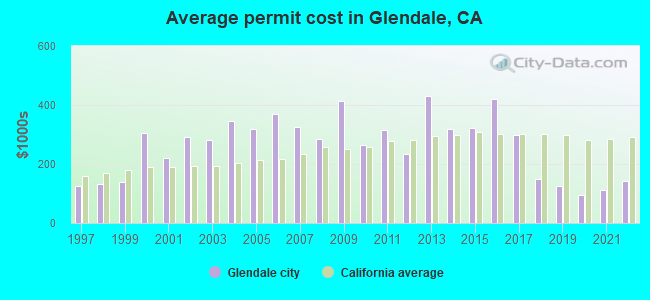
Single-family new house construction building permits:
- 2022: 72 buildings, average cost: $143,000
- 2021: 134 buildings, average cost: $113,100
- 2020: 145 buildings, average cost: $93,900
- 2019: 138 buildings, average cost: $124,800
- 2018: 90 buildings, average cost: $150,100
- 2017: 8 buildings, average cost: $296,500
- 2016: 9 buildings, average cost: $419,000
- 2015: 9 buildings, average cost: $323,000
- 2014: 17 buildings, average cost: $319,700
- 2013: 12 buildings, average cost: $428,900
- 2012: 10 buildings, average cost: $232,500
- 2011: 11 buildings, average cost: $315,600
- 2010: 7 buildings, average cost: $262,900
- 2009: 14 buildings, average cost: $414,900
- 2008: 23 buildings, average cost: $284,100
- 2007: 23 buildings, average cost: $325,300
- 2006: 23 buildings, average cost: $370,800
- 2005: 28 buildings, average cost: $319,100
- 2004: 26 buildings, average cost: $346,000
- 2003: 15 buildings, average cost: $279,500
- 2002: 23 buildings, average cost: $291,700
- 2001: 76 buildings, average cost: $222,100
- 2000: 42 buildings, average cost: $303,600
- 1999: 19 buildings, average cost: $137,500
- 1998: 17 buildings, average cost: $132,600
- 1997: 11 buildings, average cost: $126,700
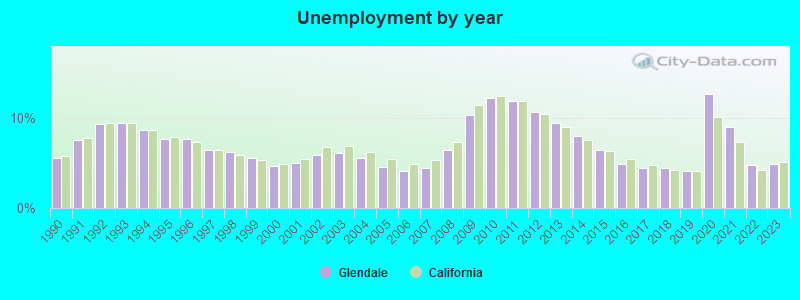
| Here: | 4.9% |
| California: | 5.1% |
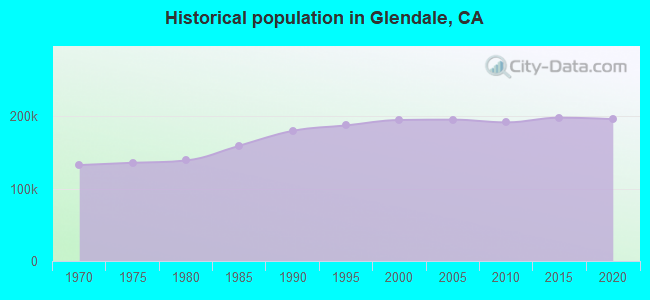
Population change in the 1990s: +14,662 (+8.1%).
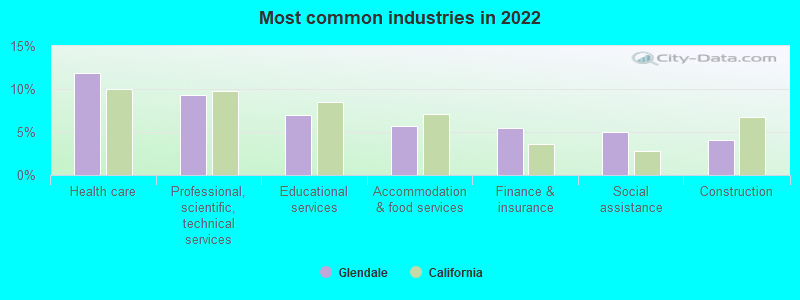
- Health care (11.9%)
- Professional, scientific, technical services (9.3%)
- Educational services (6.9%)
- Accommodation & food services (5.7%)
- Finance & insurance (5.5%)
- Social assistance (5.0%)
- Construction (4.1%)
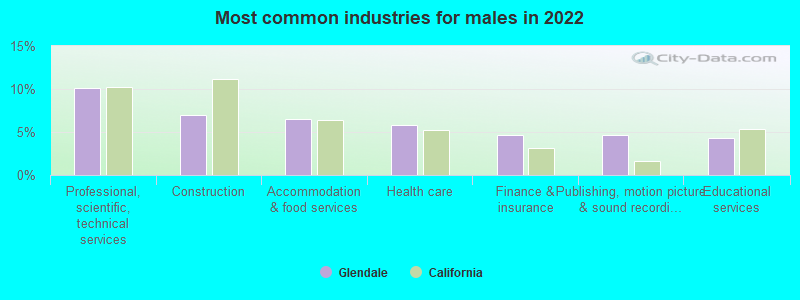
- Professional, scientific, technical services (10.1%)
- Construction (6.9%)
- Accommodation & food services (6.5%)
- Health care (5.8%)
- Finance & insurance (4.7%)
- Publishing, motion picture & sound recording industries (4.7%)
- Educational services (4.3%)
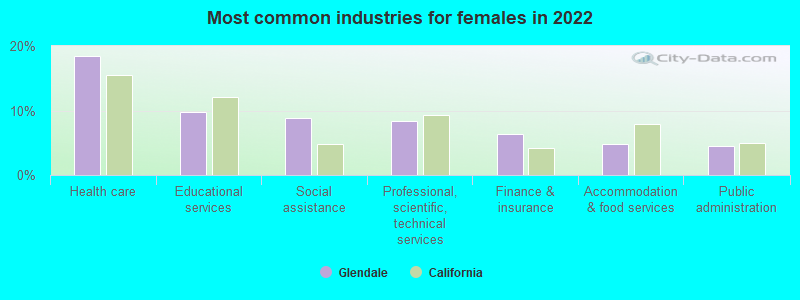
- Health care (18.5%)
- Educational services (9.8%)
- Social assistance (8.9%)
- Professional, scientific, technical services (8.4%)
- Finance & insurance (6.4%)
- Accommodation & food services (4.7%)
- Public administration (4.5%)
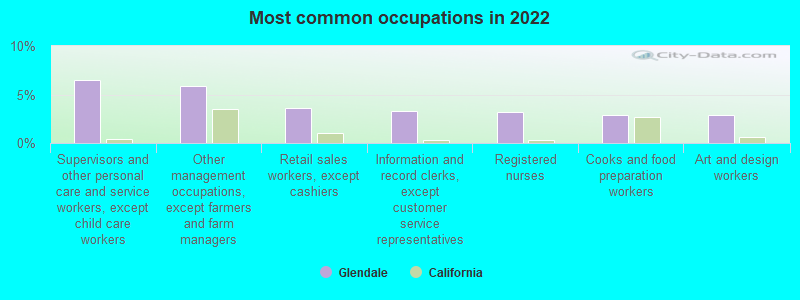
- Supervisors and other personal care and service workers, except child care workers (6.5%)
- Other management occupations, except farmers and farm managers (5.9%)
- Retail sales workers, except cashiers (3.7%)
- Information and record clerks, except customer service representatives (3.3%)
- Registered nurses (3.2%)
- Cooks and food preparation workers (2.8%)
- Art and design workers (2.8%)
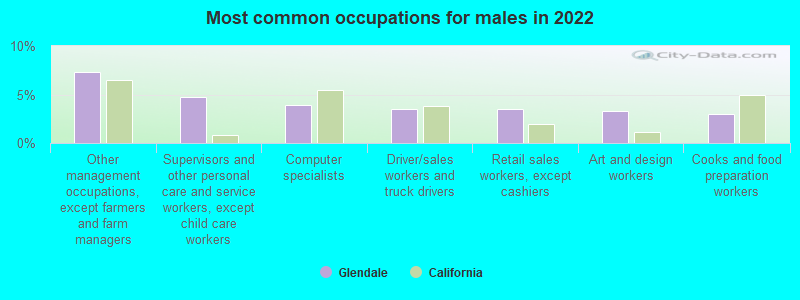
- Other management occupations, except farmers and farm managers (7.4%)
- Supervisors and other personal care and service workers, except child care workers (4.7%)
- Computer specialists (3.9%)
- Driver/sales workers and truck drivers (3.5%)
- Retail sales workers, except cashiers (3.5%)
- Art and design workers (3.3%)
- Cooks and food preparation workers (3.0%)
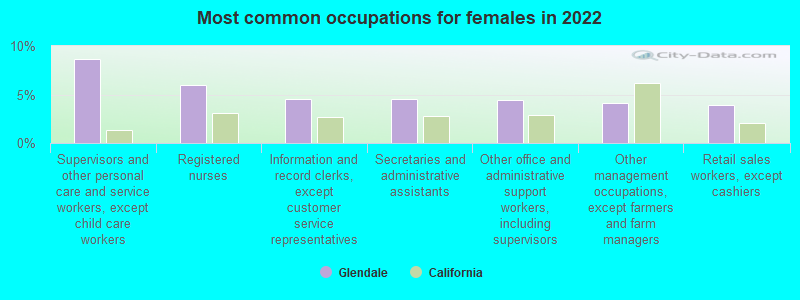
- Supervisors and other personal care and service workers, except child care workers (8.6%)
- Registered nurses (6.0%)
- Information and record clerks, except customer service representatives (4.6%)
- Secretaries and administrative assistants (4.5%)
- Other office and administrative support workers, including supervisors (4.4%)
- Other management occupations, except farmers and farm managers (4.1%)
- Retail sales workers, except cashiers (3.9%)
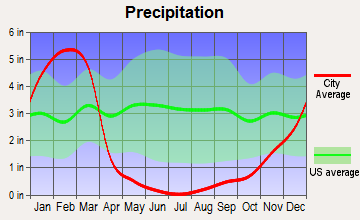
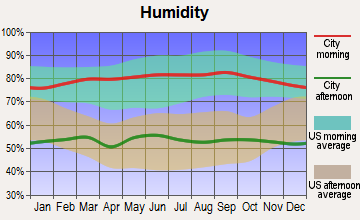
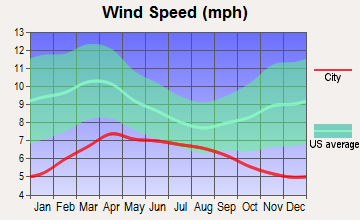
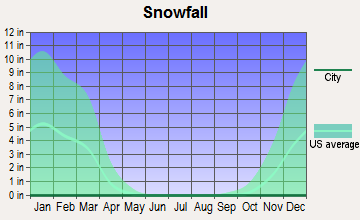
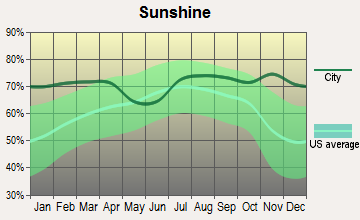
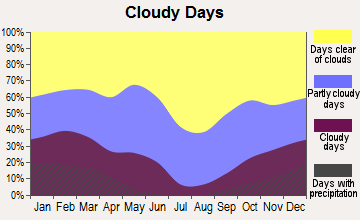
Average climate in Glendale, California
Based on data reported by over 4,000 weather stations

|
|

(lower is better)
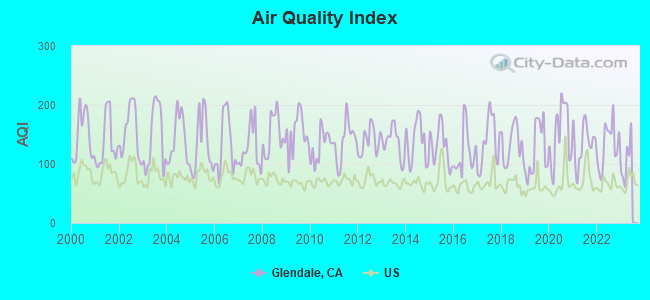
Air Quality Index (AQI) level in 2022 was 132. This is significantly worse than average.
| City: | 132 |
| U.S.: | 73 |
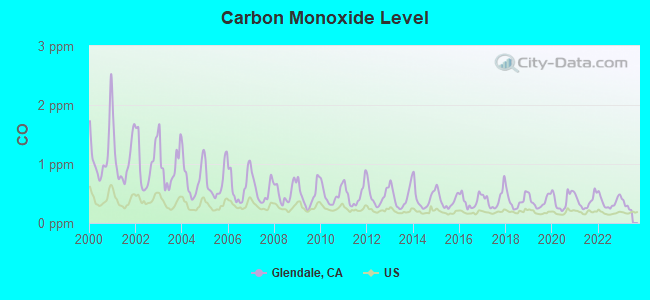
Carbon Monoxide (CO) [ppm] level in 2022 was 0.357. This is significantly worse than average. Closest monitor was 3.9 miles away from the city center.
| City: | 0.357 |
| U.S.: | 0.251 |
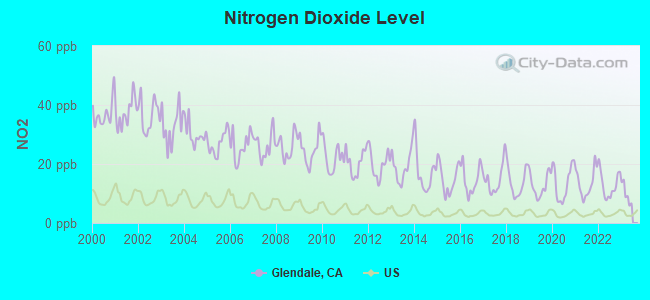
Nitrogen Dioxide (NO2) [ppb] level in 2022 was 13.0. This is significantly worse than average. Closest monitor was 1.6 miles away from the city center.
| City: | 13.0 |
| U.S.: | 5.1 |
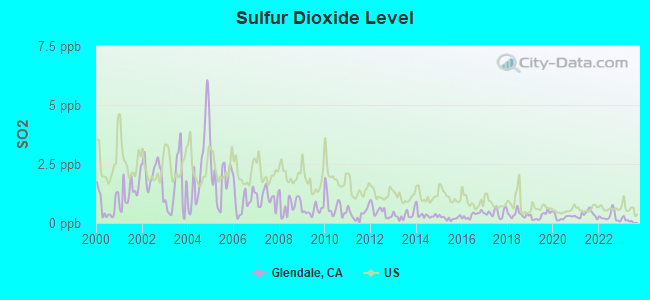
Sulfur Dioxide (SO2) [ppb] level in 2022 was 0.266. This is significantly better than average. Closest monitor was 1.6 miles away from the city center.
| City: | 0.266 |
| U.S.: | 1.515 |
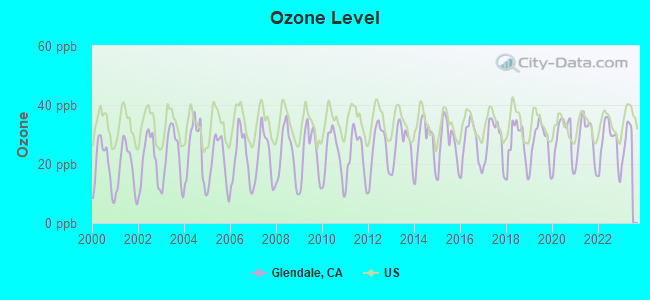
Ozone [ppb] level in 2022 was 27.2. This is better than average. Closest monitor was 1.1 miles away from the city center.
| City: | 27.2 |
| U.S.: | 33.3 |
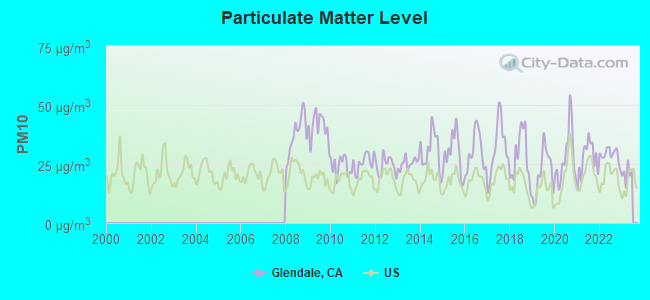
Particulate Matter (PM10) [µg/m3] level in 2022 was 28.9. This is significantly worse than average. Closest monitor was 3.9 miles away from the city center.
| City: | 28.9 |
| U.S.: | 19.2 |
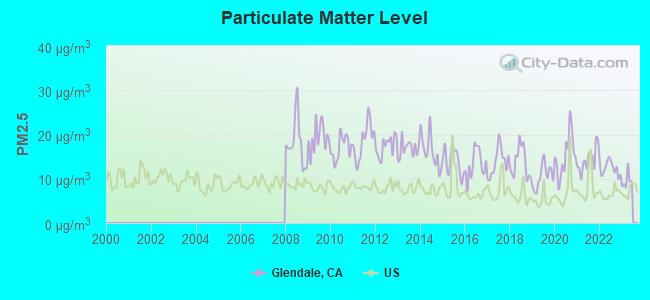
Particulate Matter (PM2.5) [µg/m3] level in 2022 was 12.4. This is significantly worse than average. Closest monitor was 3.9 miles away from the city center.
| City: | 12.4 |
| U.S.: | 8.1 |
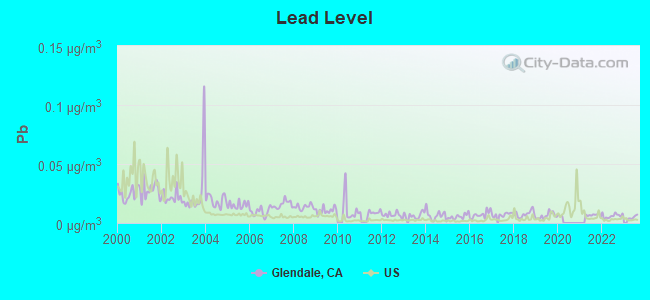
Lead (Pb) [µg/m3] level in 2022 was 0.00605. This is significantly better than average. Closest monitor was 1.6 miles away from the city center.
| City: | 0.00605 |
| U.S.: | 0.00931 |
Earthquake activity:
Glendale-area historical earthquake activity is significantly above California state average. It is 7129% greater than the overall U.S. average.On 7/21/1952 at 11:52:14, a magnitude 7.7 (7.7 UK, Class: Major, Intensity: VIII - XII) earthquake occurred 71.5 miles away from the city center, causing $50,000,000 total damage
On 6/28/1992 at 11:57:34, a magnitude 7.6 (6.2 MB, 7.6 MS, 7.3 MW, Depth: 0.7 mi) earthquake occurred 98.3 miles away from Glendale center, causing 3 deaths (1 shaking deaths, 2 other deaths) and 400 injuries, causing $100,000,000 total damage and $40,000,000 insured losses
On 10/16/1999 at 09:46:44, a magnitude 7.4 (6.3 MB, 7.4 MS, 7.2 MW, 7.3 ML) earthquake occurred 106.4 miles away from Glendale center
On 11/4/1927 at 13:51:53, a magnitude 7.5 (7.5 UK) earthquake occurred 166.6 miles away from the city center
On 1/17/1994 at 12:30:55, a magnitude 6.8 (6.4 MB, 6.8 MS, 6.7 MW, Depth: 11.4 mi, Class: Strong, Intensity: VII - IX) earthquake occurred 18.6 miles away from the city center, causing 60 deaths (60 shaking deaths) and 7000 injuries
On 4/21/1918 at 22:32:30, a magnitude 6.8 (6.8 UK) earthquake occurred 52.7 miles away from Glendale center
Magnitude types: body-wave magnitude (MB), local magnitude (ML), surface-wave magnitude (MS), moment magnitude (MW)
Natural disasters:
The number of natural disasters in Los Angeles County (57) is a lot greater than the US average (15).Major Disasters (Presidential) Declared: 27
Emergencies Declared: 3
Causes of natural disasters: Fires: 37, Floods: 16, Storms: 9, Winter Storms: 6, Landslides: 5, Mudslides: 5, Earthquakes: 3, Freeze: 1, Heavy Rain: 1, Hurricane: 1, Snow: 1, Tornado: 1, Wind: 1, Other: 1 (Note: some incidents may be assigned to more than one category).
Main business address for: American Reprographics CO (SERVICES-MAILING, REPRODUCTION, COMMERCIAL ART & PHOTOGRAPHY), DreamWorks Animation SKG, Inc. (SERVICES-MOTION PICTURE & VIDEO TAPE PRODUCTION), PUBLIC STORAGE INC /CA (REAL ESTATE INVESTMENT TRUSTS), PUBLIC STORAGE PROPERTIES IV LTD (LESSORS OF REAL PROPERTY, NEC), PS BUSINESS PARKS INC/CA (REAL ESTATE INVESTMENT TRUSTS), PUBLIC STORAGE PROPERTIES V LTD (LESSORS OF REAL PROPERTY, NEC), IHOP CORP (PATENT OWNERS & LESSORS), PUBLIC STORAGE PROPERTIES LTD (LESSORS OF REAL PROPERTY, NEC).
Hospitals in Glendale:
- ALL CARE HOME HEALTH PROVIDER (100 W BROADWAY AVENUE, SUITE 810)
- GLENDALE ADVENTIST MEDICAL CENTER (Voluntary non-profit - Church, provides emergency services, 1509 E WILSON TERRACE)
- GLENDALE MEM HOSPITAL & HLTH CENTER (Voluntary non-profit - Private, provides emergency services, 1420 S CENTRAL AVE)
- ST ANN HOSPICE (1612 WEST GLENOAKS AVENUE)
- ST ANTHONY HOSPICE (512 E WILSON AVE SUITE 208)
- USC VERDUGO HILLS HOSPITAL (Voluntary non-profit - Other, 1812 VERDUGO BLVD)
Nursing Homes in Glendale:
- ALLEN CARE CENTER, INC (201 ALLEN AVE.)
- AUTUMN HILLS HEALTHCARE (430 N.GLENDALE AVE)
- CAL HAVEN CONVALESCENT HOSPITAL (445 WEST BROADWAY)
- CHANDLER CONV HOSP (525 S CENTRAL AVE)
- COUNTRY VILLA GLENDALE HEALTHCARE CENTER (1208 S. CENTRAL AVE)
- ELMS CONVALESCENT HOSPITAL (212 WEST CHEVY CHASE DRIVE)
- GLENDALE MEM HOSP DP/SNF (1420 SO.CENTRAL AVE.)
- LEISURE GLEN POST ACUTE CARE CENTER (330 MISSION ROAD)
- ROYAL OAKS CONVALESCENT HOSP (250 N. VERDUGO ROAD)
- ROYAL VILLA HEALTH CARE (130 W. LOS FELIZ BLVD)
- WINDSOR MANOR (1230 E. WINDSOR RD.)
Dialysis Facilities in Glendale:
- DAVITA-NORTH GLENDALE (1505 WILSON TERRACE, SUITE 190)
- GLENDALE DIALYSIS (1000 E. PALMER AVENUE)
- GLENDALE KIDNEY CENTER (1427 S. GLENDALE AVENUE)
- KIDNEY DIALYSIS CENTER OF VERDUGO HILLS (1808 VERDUGO BLVD., SUITE 200)
Home Health Centers in Glendale:
- AAA HOME CARE, INC (541 WEST COLORADO ST SUITE 207)
- AMERICAN HOME HEALTH, INC. (415 E HARVARD STREET, SUITE 100)
- CARE FOR ALL HEALTH SERVICES INC (126 S JACKSON ST, SUITE 204)
- CONSTANT CARE HOME HEALTH AGENCY, INC (1612 N VICTORY BLVD)
- EXPRESS HOME HEALTH CARE (644 W BROADWAY, #102)
- GOOD SPIRIT HOME HEALTH SERVICES, INC (805 E BROADWAY, SUITE D)
- LIBERTY HOME HEALTH CARE, INC (125 E GLENOAKS BLVD, UNIT 104)
- OPTIMA HEALTH CARE, INC (1545 N VERDUGO ROAD, SUITE 108)
- R AND A HOME HEALTH SERVICES, INC (600 WEST BROADWAY SUITE 210)
- ULTIMATE HOME CARE (616 GLENOAKS BLVD #204)
Heliports located in Glendale:
- Heliports: 7
Colleges/Universities in Glendale:
- Glendale Community College (Full-time enrollment: 11,348; Location: 1500 N Verdugo Rd; Public; Website: www.glendale.edu)
- Glendale Career College (Full-time enrollment: 420; Location: 240 North Brand Boulevard Lower Level; Private, for-profit; Website: www.success.edu)
- North-West College-Glendale (Full-time enrollment: 216; Location: 221 North Brand; Private, for-profit; Website: www.north-westcollege.edu)
- American Medical Sciences Center (Full-time enrollment: 145; Location: 225 West Broadway, Suite 115; Private, for-profit; Website: www.amscedu.com)
- Brand College (Full-time enrollment: 25; Location: 529 Hahn Ave Ste 101; Private, for-profit; Website: brandcollege.edu)
Other colleges/universities with over 2000 students near Glendale:
- Art Center College of Design (about 4 miles; Pasadena, CA; Full-time enrollment: 2,346)
- Occidental College (about 4 miles; Los Angeles, CA; FT enrollment: 2,276)
- Los Angeles City College (about 7 miles; Los Angeles, CA; FT enrollment: 10,027)
- New York Film Academy (about 7 miles; Universal City, CA; FT enrollment: 4,714)
- Le Cordon Bleu College of Culinary Arts-Pasadena (about 7 miles; Pasadena, CA; FT enrollment: 2,934)
- Los Angeles Film School (about 7 miles; Hollywood, CA; FT enrollment: 3,189)
- California Institute of Technology (about 8 miles; Pasadena, CA; FT enrollment: 2,246)
Public high schools in Glendale:
- GLENDALE HIGH (Students: 2,072, Location: 1440 E. BRD.WAY, Grades: 9-12)
- HERBERT HOOVER HIGH (Students: 1,417, Location: 651 GLENWOOD RD., Grades: 9-12)
- DAILY (ALLAN F.) HIGH (CONTINUATION) (Students: 60, Location: 220 N. KENWOOD, Grades: 9-12)
- COLLEGE VIEW (Students: 36, Location: 440 W. LOMITA AVE., Grades: KG-12)
- JEWEL CITY COMMUNITY DAY (Students: 4, Location: 440 W. LOMITA, Grades: 7-10)
Private high schools in Glendale:
Biggest public elementary/middle schools in Glendale:
- WOODROW WILSON MIDDLE (Students: 1,258, Location: 1221 MONTEREY RD., Grades: 6-8)
- ELEANOR J. TOLL MIDDLE (Students: 1,251, Location: 700 GLENWOOD RD., Grades: 6-8)
- THEODORE ROOSEVELT MIDDLE (Students: 941, Location: 222 E. ACACIA AVE., Grades: 6-8)
- MARK KEPPEL ELEMENTARY (Students: 506, Location: 730 GLENWOOD RD., Grades: KG-5)
- JOHN MUIR ELEMENTARY (Students: 476, Location: 912 S. CHEVY CHASE DR., Grades: KG-6)
- R. D. WHITE ELEMENTARY (Students: 466, Location: 744 E. DORAN ST., Grades: KG-5)
- JOHN C. FREMONT ELEMENTARY (Students: 453, Location: 3320 LAS PALMAS AVE., Grades: KG-6)
- VERDUGO WOODLANDS ELEMENTARY (Students: 437, Location: 1751 N. VERDUGO RD., Grades: KG-6)
- HORACE MANN ELEMENTARY (Students: 428, Location: 501 E. ACACIA AVE., Grades: KG-5)
- GLENOAKS ELEMENTARY (Students: 410, Location: 2015 E. GLENOAKS BLVD., Grades: KG-6)
Private elementary/middle schools in Glendale:
- CHAMLIAN ARMENIAN SCHOOL (Students: 500, Location: 4444 LOWELL AVE, Grades: 1-8)
- INCARNATION PARISH SCHOOL (Students: 280, Location: 123 W GLENOAKS BLVD, Grades: KG-8)
- HOLY FAMILY GRADE SCHOOL (Students: 275, Location: 400 S LOUISE ST, Grades: KG-8)
- SALEM LUTHERAN SCHOOL (Students: 160, Location: 1211 N BRAND BLVD, Grades: PK-6)
- FIRST LUTHERAN SCHOOL (Students: 95, Location: 1300 E COLORADO ST, Grades: PK-8)
- GLENDALE MONTESSORI ELEMENTARY SCHOOL (Students: 53, Location: 1212 N PACIFIC AVE, Grades: UG-6)
Points of interest:
Notable locations in Glendale: Oakmont Country Club (A), Chevy Chase Golf Course (B), Chevy Chase Country Club (C), Western Sub-Station (D), Grand Central Industrial Centre (E), Fremont Sub-Station (F), Verdugo Metropolitan Pumping Station (G), Hall of Crucifixion (H), Casa Verdugo Branch Glendale Public Library (I), Sons of the American Revolution Genealogical Library (J), Grandview Branch Glendale Public Library (K), Glendale Public Library (L), El Miradero (M), Chevy Chase Branch Glendale Public Library (N), Brand Art and Music Branch Glendale Public Library (O), Glendale Civic Auditorium (P), Glendale City Hall (Q), Glendale Civic Auditorium (R), Schaefer Ambulance Service (S), Northwest Medical Transportation (T). Display/hide their locations on the map
Shopping Centers: Glendale Galleria Shopping Center (1), Glendale Fashion Center Shopping Center (2), Glendale Plaza Shopping Center (3). Display/hide their locations on the map
Main business address in Glendale include: American Reprographics CO (A), DreamWorks Animation SKG, Inc. (B), PUBLIC STORAGE INC /CA (C), PUBLIC STORAGE PROPERTIES IV LTD (D), PS BUSINESS PARKS INC/CA (E), PUBLIC STORAGE PROPERTIES V LTD (F), IHOP CORP (G), PUBLIC STORAGE PROPERTIES LTD (H). Display/hide their locations on the map
Churches in Glendale include: Glendale Presbyterian Church (A), Central Christian Church (B), United Community Church (C), Church of Christ (D), Bethel Chapel Assembly of God Church (E), Glendale Missionary Baptist Church (F), First Church of Christ Scientist (G), Free Methodist Church (H), Glendale Community Church of God (I). Display/hide their locations on the map
Cemetery: Grand View Memorial Park (1). Display/hide its location on the map
Reservoirs: Diederich Street Reservoir (A), Western Reservoir (B). Display/hide their locations on the map
Streams, rivers, and creeks: Deer Creek (A), Verdugo Wash (B). Display/hide their locations on the map
Parks in Glendale include: Stengel Field (1), Moyse Stadium (2), Brand Park (3), Crescenta Valley Park (4), Fremont Park (5), Griffith Manor Park (6), Maple Park (7), Pacific Park (8), Palmer Park (9). Display/hide their locations on the map
Tourist attractions: Cesar E Chavez Foundation (Cultural Attractions- Events- & Facilities; 500 North Brand Boulevard) (1), Amusing Amusements (Amusement & Theme Parks; 3430 Ocean View Boulevard Suite G) (2), Charles Billiard (224 North Brand Boulevard) (3), African Travel (Tours & Charters; 1100 East Broadway) (4). Display/hide their approximate locations on the map
Hotels: American Motel (1541 East Colorado Street) (1), 99 Palms Motel Inc (1012 Winchester Avenue) (2), Best Western Golden Key Motor (123 West Colorado Street) (3), Astro Glendale Motel (326 East Colorado Street) (4), Brentwood Hotel (339 North Brand Boulevard) (5). Display/hide their approximate locations on the map
Birthplace of: Captain Beefheart - (born 1941), avant garde blues musician and painter, Allison Iraheta - Singer, Daryl Gates - Chief of Los Angeles Police Department, David Brin - Novelist, Nathan Kress - Actor, Michael Shermer - Science writer, Edward Furlong - Child actor, John Doolittle - Politician, Gary Chartier - Legal scholar, Kathy Ireland - Businesswoman.
| This city: | 2.6 people |
| California: | 2.9 people |
| This city: | 69.3% |
| Whole state: | 68.7% |
| This city: | 4.1% |
| Whole state: | 7.2% |
Likely homosexual households (counted as self-reported same-sex unmarried-partner households)
- Lesbian couples: 0.4% of all households
- Gay men: 0.5% of all households
People in group quarters in Glendale in 2010:
- 1,181 people in nursing facilities/skilled-nursing facilities
- 86 people in other noninstitutional facilities
- 70 people in emergency and transitional shelters (with sleeping facilities) for people experiencing homelessness
- 29 people in workers' group living quarters and job corps centers
- 23 people in mental (psychiatric) hospitals and psychiatric units in other hospitals
- 20 people in group homes intended for adults
- 18 people in residential treatment centers for adults
- 2 people in in-patient hospice facilities
People in group quarters in Glendale in 2000:
- 1,689 people in nursing homes
- 676 people in other noninstitutional group quarters
- 363 people in other nonhousehold living situations
- 82 people in homes for the mentally retarded
- 23 people in religious group quarters
- 19 people in institutions for the deaf
- 7 people in local jails and other confinement facilities (including police lockups)
- 5 people in homes for the physically handicapped
Banks with most branches in Glendale (2011 data):
- Bank of America, National Association: Wilson And Glendale Branch, Gateway Branch, American Glendale Branch, Glendale Main Branch, West Glendale Branch. Info updated 2009/11/18: Bank assets: $1,451,969.3 mil, Deposits: $1,077,176.8 mil, headquarters in Charlotte, NC, positive income, 5782 total offices, Holding Company: Bank Of America Corporation
- U.S. Bank National Association: West Los Feliz Blvd. Vons Branch, Glendale Ralphs Branch, Glendale Branch, North Glendale Avenue Vons Branch. Info updated 2012/01/30: Bank assets: $330,470.8 mil, Deposits: $236,091.5 mil, headquarters in Cincinnati, OH, positive income, 3121 total offices, Holding Company: U.S. Bancorp
- Wells Fargo Bank, National Association: Glendale-East Colorado Branch, Wilson & Glendale Branch, Glendale Branch. Info updated 2011/04/05: Bank assets: $1,161,490.0 mil, Deposits: $905,653.0 mil, headquarters in Sioux Falls, SD, positive income, 6395 total offices, Holding Company: Wells Fargo & Company
- JPMorgan Chase Bank, National Association: 500 N Glendale Ave Branch, Colorado & Central Banking Center Br, Glendale Branch. Info updated 2011/11/10: Bank assets: $1,811,678.0 mil, Deposits: $1,190,738.0 mil, headquarters in Columbus, OH, positive income, International Specialization, 5577 total offices, Holding Company: Jpmorgan Chase & Co.
- Citibank, National Association: 414 North Central Avenue Branch, 1201 North Central Avenue Branch, Glendale Branch. Info updated 2012/01/10: Bank assets: $1,288,658.0 mil, Deposits: $882,541.0 mil, headquarters in Sioux Falls, SD, positive income, International Specialization, 1048 total offices, Holding Company: Citigroup Inc.
- Seacoast Commerce Bank: North Maryland Branch at 200 North Maryland Avenue, branch established on 2010/08/19. Info updated 2009/07/13: Bank assets: $149.6 mil, Deposits: $129.7 mil, headquarters in Chula Vista, CA, positive income, Commercial Lending Specialization, 4 total offices
- Community Bank: North Brand Branch at 500 North Brand Boulevard, branch established on 1990/01/08. Info updated 2010/02/16: Bank assets: $2,601.3 mil, Deposits: $1,941.4 mil, headquarters in Pasadena, CA, positive income, Commercial Lending Specialization, 17 total offices
- National Bank of California: Glendale Regional Office at 520 North Brand Boulevard, branch established on 2004/09/20. Info updated 2006/11/03: Bank assets: $382.7 mil, Deposits: $351.8 mil, headquarters in Los Angeles, CA, negative income in the last year, Commercial Lending Specialization, 6 total offices, Holding Company: Ncal Bancorp
- First-Citizens Bank & Trust Company: Glendale Office at 655 North Central Avenue, Suite 1500, branch established on 2000/07/05. Info updated 2011/10/11: Bank assets: $20,566.4 mil, Deposits: $17,596.8 mil, headquarters in Raleigh, NC, positive income, Commercial Lending Specialization, 433 total offices, Holding Company: First Citizens Bancshares, Inc.
- 13 other banks with 13 local branches
For population 15 years and over in Glendale:

- Never married: 36.1%
- Now married: 48.0%
- Separated: 1.8%
- Widowed: 6.6%
- Divorced: 7.5%
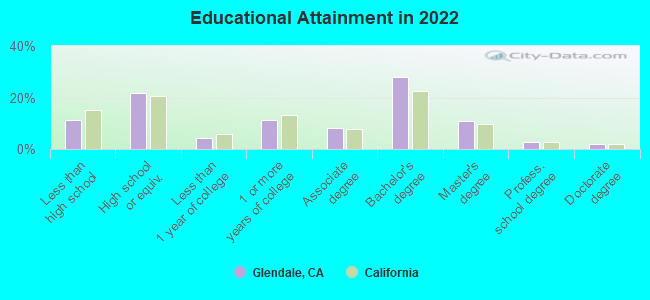
For population 25 years and over in Glendale:
- High school or higher: 88.6%
- Bachelor's degree or higher: 43.5%
- Graduate or professional degree: 15.6%
- Unemployed: 7.2%
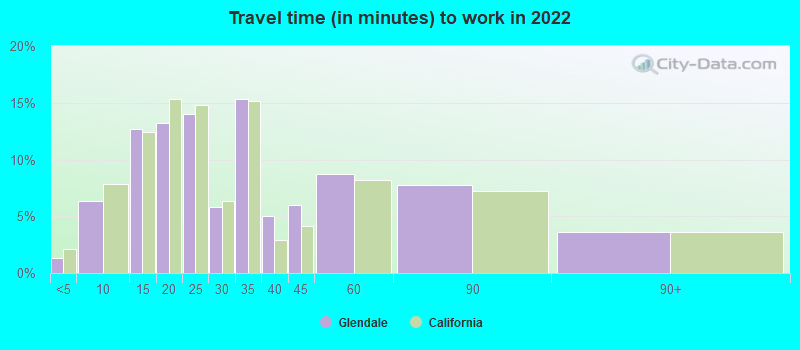
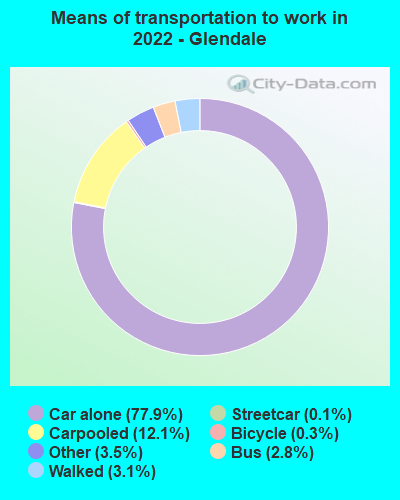
- Mean travel time to work (commute): 20.7 minutes
| Here: | 14.5 |
| California average: | 15.5 |


Graphs represent county-level data. Detailed 2008 Election Results
Neighborhoods in Glendale:
(Glendale, California Neighborhood Map)- Adams Hill Square neighborhood
- Broadway Civic Corridor neighborhood
- Brockment neighborhood
- Castle Heights neighborhood
- Chevy Chase Canyon neighborhood
- Citrus Grove neighborhood
- College Hills neighborhood
- Cumberland Heights neighborhood
- Downtown Glendale neighborhood
- Emerald Isle neighborhood
- Glendale neighborhood
- Glendale Galleria neighborhood
- Glendale North neighborhood
- Glenoaks Canyon neighborhood
- Glenwood neighborhood
- Grand Central neighborhood
- Grandview neighborhood
- Hillside neighborhood
- Historic Old Town Montrose (Montrose Shopping Park) neighborhood
- Mariposa neighborhood
- Milford Industrial neighborhood
- Montecito Park neighborhood
- Moorpark neighborhood
- Oakmont neighborhood
- Pacific Edison neighborhood
- Pioneer Homes neighborhood
- Rancho San Rafael neighborhood
- Riverside Rancho neighborhood
- Rossmoyne neighborhood
- Royal Canyon neighborhood
- San Rafael Hills neighborhood
- Somerset neighborhood
- South Brand neighborhood
- Sparr Heights neighborhood
- Tropico neighborhood
- Verdugo Viejo neighborhood
- Verdugo Woodlands neighborhood
- West Glendale neighborhood
- Woodbury neighborhood
Religion statistics for Glendale, CA (based on Los Angeles County data)


| Religion | Adherents | Congregations |
|---|---|---|
| Catholic | 3,542,994 | 275 |
| Evangelical Protestant | 814,611 | 3,249 |
| Other | 451,594 | 1,023 |
| Mainline Protestant | 229,056 | 860 |
| Black Protestant | 112,338 | 290 |
| Orthodox | 63,517 | 76 |
| None | 4,604,495 | - |
Food Environment Statistics:
| Los Angeles County: | 2.12 / 10,000 pop. |
| State: | 2.14 / 10,000 pop. |
| Los Angeles County: | 0.03 / 10,000 pop. |
| California: | 0.04 / 10,000 pop. |
| This county: | 0.58 / 10,000 pop. |
| State: | 0.62 / 10,000 pop. |
| This county: | 1.23 / 10,000 pop. |
| State: | 1.49 / 10,000 pop. |
| Los Angeles County: | 7.15 / 10,000 pop. |
| California: | 7.42 / 10,000 pop. |
| This county: | 7.5% |
| California: | 7.3% |
| Here: | 20.4% |
| California: | 21.3% |
| Here: | 18.6% |
| California: | 17.9% |
Health and Nutrition:
| Here: | 51.6% |
| California: | 49.4% |
| Glendale: | 49.3% |
| California: | 48.0% |
| Glendale: | 27.8 |
| California: | 28.1 |
| Glendale: | 19.7% |
| California: | 20.2% |
| This city: | 12.5% |
| California: | 11.2% |
| This city: | 6.8 |
| California: | 6.8 |
| This city: | 31.4% |
| California: | 31.5% |
| This city: | 57.4% |
| State: | 56.4% |
| Here: | 80.6% |
| California: | 80.9% |
More about Health and Nutrition of Glendale, CA Residents
| Local government employment and payroll (March 2022) | |||||
| Function | Full-time employees | Monthly full-time payroll | Average yearly full-time wage | Part-time employees | Monthly part-time payroll |
|---|---|---|---|---|---|
| Police Protection - Officers | 234 | $1,670,261 | $85,654 | 0 | $0 |
| Electric Power | 233 | $2,127,900 | $109,591 | 8 | $22,487 |
| Firefighters | 168 | $2,833,358 | $202,383 | 0 | $0 |
| Other and Unallocable | 151 | $1,044,343 | $82,994 | 72 | $125,062 |
| Streets and Highways | 131 | $982,000 | $89,954 | 6 | $31,480 |
| Police - Other | 98 | $835,662 | $102,326 | 29 | $41,725 |
| Water Supply | 93 | $789,238 | $101,837 | 8 | $43,971 |
| Financial Administration | 93 | $816,863 | $105,402 | 21 | $119,331 |
| Parks and Recreation | 84 | $504,547 | $72,078 | 124 | $165,527 |
| Solid Waste Management | 81 | $473,154 | $70,097 | 2 | $5,635 |
| Other Government Administration | 73 | $690,021 | $113,428 | 14 | $30,888 |
| Local Libraries | 53 | $374,523 | $84,798 | 62 | $63,060 |
| Housing and Community Development (Local) | 51 | $400,482 | $94,231 | 14 | $48,675 |
| Fire - Other | 18 | $130,881 | $87,254 | 0 | $0 |
| Judicial and Legal | 18 | $255,038 | $170,025 | 2 | $5,093 |
| Health | 0 | $0 | 59 | $126,959 | |
| Totals for Government | 1,579 | $13,928,271 | $105,851 | 421 | $829,893 |
Glendale government finances - Expenditure in 2021 (per resident):
- Construction - Regular Highways: $17,167,000 ($90.72)
Parks and Recreation: $2,601,000 ($13.75)
Police Protection: $1,908,000 ($10.08)
General - Other: $884,000 ($4.67)
Housing and Community Development: $112,000 ($0.59)
Health - Other: $51,000 ($0.27)
- Current Operations - Electric Utilities: $141,137,000 ($745.88)
General - Other: $116,146,000 ($613.81)
Police Protection: $92,802,000 ($490.44)
Local Fire Protection: $58,796,000 ($310.73)
Housing and Community Development: $46,949,000 ($248.12)
Water Utilities: $41,347,000 ($218.51)
Central Staff Services: $26,152,000 ($138.21)
Solid Waste Management: $24,531,000 ($129.64)
Transit Utilities: $20,585,000 ($108.79)
Sewerage: $16,695,000 ($88.23)
Parks and Recreation: $14,858,000 ($78.52)
Regular Highways: $12,191,000 ($64.43)
Libraries: $10,961,000 ($57.93)
Parking Facilities: $8,440,000 ($44.60)
Protective Inspection and Regulation - Other: $7,909,000 ($41.80)
Health - Other: $6,967,000 ($36.82)
- Electric Utilities - Interest on Debt: $5,715,000 ($30.20)
- General - Interest on Debt: $2,334,000 ($12.33)
- Water Utilities - Interest on Debt: $1,929,000 ($10.19)
Glendale government finances - Revenue in 2021 (per resident):
- Charges - Other: $60,873,000 ($321.70)
Sewerage: $27,517,000 ($145.42)
Solid Waste Management: $23,766,000 ($125.60)
Parking Facilities: $4,435,000 ($23.44)
Parks and Recreation: $1,742,000 ($9.21)
Housing and Community Development: $1,175,000 ($6.21)
- Federal Intergovernmental - Other: $48,986,000 ($258.88)
Housing and Community Development: $3,020,000 ($15.96)
- Local Intergovernmental - Other: $434,000 ($2.29)
- Miscellaneous - Interest Earnings: $16,171,000 ($85.46)
Fines and Forfeits: $3,807,000 ($20.12)
Donations From Private Sources: $1,533,000 ($8.10)
Special Assessments: $1,406,000 ($7.43)
Rents: $1,076,000 ($5.69)
General Revenue - Other: $515,000 ($2.72)
Sale of Property: $29,000 ($0.15)
- Revenue - Electric Utilities: $232,312,000 ($1227.73)
Water Utilities: $56,397,000 ($298.05)
Transit Utilities: $1,004,000 ($5.31)
- State Intergovernmental - Highways: $8,239,000 ($43.54)
Other: $5,602,000 ($29.61)
Public Welfare: $3,788,000 ($20.02)
General Local Government Support: $178,000 ($0.94)
- Tax - Property: $78,359,000 ($414.11)
General Sales and Gross Receipts: $77,236,000 ($408.18)
Other: $29,439,000 ($155.58)
Public Utilities Sales: $28,618,000 ($151.24)
Other License: $8,132,000 ($42.98)
Other Selective Sales: $4,118,000 ($21.76)
Documentary and Stock Transfer: $1,297,000 ($6.85)
Glendale government finances - Debt in 2021 (per resident):
- Long Term Debt - Beginning Outstanding - Unspecified Public Purpose: $263,510,000 ($1392.60)
Outstanding Unspecified Public Purpose: $245,018,000 ($1294.88)
Retired Unspecified Public Purpose: $53,987,000 ($285.31)
Issue, Unspecified Public Purpose: $35,495,000 ($187.58)
Glendale government finances - Cash and Securities in 2021 (per resident):
- Bond Funds - Cash and Securities: $191,407,000 ($1011.55)
- Other Funds - Cash and Securities: $266,579,000 ($1408.82)
- Sinking Funds - Cash and Securities: $46,898,000 ($247.85)
2.98% of this county's 2021 resident taxpayers lived in other counties in 2020 ($81,235 average adjusted gross income)
| Here: | 2.98% |
| California average: | 5.19% |
0.01% of residents moved from foreign countries ($155 average AGI)
Los Angeles County: 0.01% California average: 0.03%
Top counties from which taxpayers relocated into this county between 2020 and 2021:
| from Orange County, CA | |
| from San Bernardino County, CA | |
| from Riverside County, CA |
4.68% of this county's 2020 resident taxpayers moved to other counties in 2021 ($97,324 average adjusted gross income)
| Here: | 4.68% |
| California average: | 6.14% |
0.01% of residents moved to foreign countries ($196 average AGI)
Los Angeles County: 0.01% California average: 0.02%
Top counties to which taxpayers relocated from this county between 2020 and 2021:
| to Orange County, CA | |
| to San Bernardino County, CA | |
| to Riverside County, CA |
| Businesses in Glendale, CA | ||||
| Name | Count | Name | Count | |
|---|---|---|---|---|
| 24 Hour Fitness | 2 | Jamba Juice | 1 | |
| 7-Eleven | 6 | Jones New York | 5 | |
| 99 Cents Only Stores | 1 | Juicy Couture | 1 | |
| ALDO | 2 | Just Tires | 1 | |
| AT&T | 1 | Justice | 1 | |
| Abercrombie & Fitch | 1 | KFC | 3 | |
| Abercrombie Kids | 1 | Kincaid | 1 | |
| Aeropostale | 1 | Kroger | 4 | |
| Aerosoles | 1 | LA Fitness | 1 | |
| Albertsons | 1 | Lane Bryant | 1 | |
| American Eagle Outfitters | 2 | LensCrafters | 1 | |
| Ann Taylor | 2 | Little Caesars Pizza | 1 | |
| Apple Store | 1 | Macy's | 1 | |
| AutoZone | 1 | MasterBrand Cabinets | 2 | |
| Avenue | 1 | Mazda | 1 | |
| BMW | 1 | McDonald's | 5 | |
| Bakers | 2 | Men's Wearhouse | 1 | |
| Bally Total Fitness | 1 | Motherhood Maternity | 1 | |
| Banana Republic | 1 | New Balance | 2 | |
| Barnes & Noble | 1 | Nike | 18 | |
| Baskin-Robbins | 3 | Nissan | 1 | |
| Bath & Body Works | 1 | Nordstrom | 2 | |
| Bebe | 1 | Office Depot | 1 | |
| Big O Tires | 1 | Old Navy | 1 | |
| Blockbuster | 2 | Olive Garden | 1 | |
| Brookstone | 1 | Outback | 1 | |
| Budget Car Rental | 1 | Outback Steakhouse | 1 | |
| Burger King | 4 | Pac Sun | 1 | |
| CVS | 2 | Panda Express | 5 | |
| Cache | 1 | Panera Bread | 1 | |
| Carl\s Jr. | 3 | Papa John's Pizza | 1 | |
| Casual Male XL | 1 | Payless | 3 | |
| Charlotte Russe | 1 | Pier 1 Imports | 1 | |
| Chevrolet | 1 | Pizza Hut | 2 | |
| Chico's | 1 | Popeyes | 1 | |
| Chipotle | 1 | Quiznos | 2 | |
| Cinnabon | 1 | RadioShack | 1 | |
| Circle K | 1 | Red Robin | 1 | |
| Clarks | 1 | Rite Aid | 2 | |
| Cold Stone Creamery | 1 | Rodeway Inn | 1 | |
| Curves | 2 | Ryder Rental & Truck Leasing | 1 | |
| DHL | 3 | Safeway | 2 | |
| Days Inn | 1 | Sears | 2 | |
| Decora Cabinetry | 1 | Sephora | 2 | |
| Discount Tire | 1 | Skechers USA | 1 | |
| Domino's Pizza | 4 | Soma Intimates | 1 | |
| Econo Lodge | 1 | Spencer Gifts | 1 | |
| El Pollo Loco | 2 | Sprint Nextel | 1 | |
| Express | 1 | Staples | 1 | |
| Famous Footwear | 1 | Starbucks | 12 | |
| FedEx | 27 | Subaru | 1 | |
| Firestone Complete Auto Care | 1 | Subway | 8 | |
| Foot Locker | 1 | T-Mobile | 5 | |
| Ford | 1 | T.J.Maxx | 1 | |
| Forever 21 | 3 | Taco Bell | 2 | |
| Fredericks Of Hollywood | 1 | Target | 1 | |
| GNC | 2 | The Cheesecake Factory | 1 | |
| GameStop | 1 | The Limited | 1 | |
| Gap | 3 | The Room Place | 3 | |
| Gymboree | 1 | Torrid | 1 | |
| H&M | 1 | Toyota | 1 | |
| H&R Block | 2 | Trader Joe's | 1 | |
| Haagen-Dazs | 1 | U-Haul | 3 | |
| Hilton | 1 | UPS | 26 | |
| Hollister Co. | 1 | Urban Outfitters | 1 | |
| Home Depot | 1 | Vans | 3 | |
| Homestead Studio Suites | 1 | Verizon Wireless | 2 | |
| Honda | 1 | Victoria's Secret | 1 | |
| Hot Topic | 1 | Volkswagen | 1 | |
| IHOP | 1 | Vons | 2 | |
| J. Jill | 1 | Whole Foods Market | 1 | |
| J.Crew | 1 | World Gym | 1 | |
| JCPenney | 2 | YMCA | 1 | |
| Jack In The Box | 3 | |||
Strongest AM radio stations in Glendale:
- KRLA (870 AM; 20 kW; GLENDALE, CA; Owner: NEW INSPIRATION BROADCASTING COMPANY)
- KBLA (1580 AM; 50 kW; SANTA MONICA, CA)
- KFWB (980 AM; 50 kW; LOS ANGELES, CA; Owner: INFINITY BROADCASTING OPERATIONS, INC.)
- KSPN (710 AM; 50 kW; LOS ANGELES, CA; Owner: KABC-AM RADIO, INC.)
- KMPC (1540 AM; 50 kW; LOS ANGELES, CA; Owner: ROSE CITY RADIO CORPORATION)
- KXMX (1190 AM; 25 kW; ANAHEIM, CA; Owner: NEW INSPIRATION BROADCASTING COMPANY)
- KLAC (570 AM; 50 kW; LOS ANGELES, CA; Owner: AMFM RADIO LICENSES, L.L.C.)
- KDIS (1110 AM; 50 kW; PASADENA, CA; Owner: ABC,INC.)
- KTNQ (1020 AM; 50 kW; LOS ANGELES, CA; Owner: KTNQ-AM LICENSE CORP.)
- KXTA (1150 AM; 50 kW; LOS ANGELES, CA; Owner: CITICASTERS LICENSES, L.P.)
- KFI (640 AM; 50 kW; LOS ANGELES, CA; Owner: CAPSTAR TX LIMITED PARTNERSHIP)
- KSUR (1260 AM; 25 kW; BEVERLY HILLS, CA)
- KNX (1070 AM; 50 kW; LOS ANGELES, CA; Owner: INFINITY BROADCASTING OPERATIONS, INC.)
Strongest FM radio stations in Glendale:
- KRTH-FM (101.1 FM; LOS ANGELES, CA; Owner: INFINITY BROADCASTING OPERATIONS, INC.)
- KZLA-FM (93.9 FM; LOS ANGELES, CA; Owner: EMMIS RADIO LICENSE CORPORATION)
- KPWR (105.9 FM; LOS ANGELES, CA; Owner: EMMIS RADIO LICENSE CORPORATION)
- KLSX (97.1 FM; LOS ANGELES, CA; Owner: INFINITY BROADCASTING OPERATIONS, INC.)
- KUSC (91.5 FM; LOS ANGELES, CA; Owner: UNIVERSITY OF SOUTHERN CALIFORNIA)
- KKLA-FM (99.5 FM; LOS ANGELES, CA; Owner: NEW INSPIRATION BROADCASTING CO., INC.)
- KROQ-FM (106.7 FM; PASADENA, CA; Owner: INFINITY BROADCASTING CORP. OF LOS ANGELES)
- KKBT (100.3 FM; LOS ANGELES, CA; Owner: RADIO ONE LICENSES, LLC)
- KCBS-FM (93.1 FM; LOS ANGELES, CA; Owner: INFINITY BROADCASTING OPERATIONS, INC.)
- K212FA (90.3 FM; TEMPLE CITY, CA; Owner: EDUCATIONAL MEDIA FOUNDATION)
- KSCA (101.9 FM; GLENDALE, CA; Owner: HBC LICENSE CORPORATION)
- KLOS (95.5 FM; LOS ANGELES, CA; Owner: KLOS-FM RADIO, INC.)
- KOST (103.5 FM; LOS ANGELES, CA; Owner: CAPSTAR TX LIMITED PARTNERSHIP)
- KLVE (107.5 FM; LOS ANGELES, CA; Owner: KLVE-FM LICENSE CORP.)
- KIIS-FM (102.7 FM; LOS ANGELES, CA; Owner: CITICASTERS LICENSES, L.P.)
- KPCC (89.3 FM; PASADENA, CA; Owner: PASADENA AREA COMMUNITY COLLEGE DISTRICT)
- KBIG-FM (104.3 FM; LOS ANGELES, CA; Owner: AMFM RADIO LICENSES, L.L.C.)
- KHHT (92.3 FM; LOS ANGELES, CA; Owner: AMFM RADIO LICENSES, L.L.C.)
- KMZT-FM (105.1 FM; LOS ANGELES, CA; Owner: MOUNT WILSON FM BROADCASTERS, INC.)
- KPFK (90.7 FM; LOS ANGELES, CA; Owner: PACIFICA FOUNDATION, INC)
TV broadcast stations around Glendale:
- KCBS-TV (Channel 2; LOS ANGELES, CA; Owner: CBS BROADCASTING INC.)
- KTRO-LP (Channel 50; LANCASTER, CA; Owner: ROBERT D. ADELMAN)
- KTLA-TV (Channel 5; LOS ANGELES, CA; Owner: KTLA INC.)
- KABC-TV (Channel 7; LOS ANGELES, CA; Owner: ABC HOLDING COMPANY, INC.)
- KCAL-TV (Channel 9; LOS ANGELES, CA; Owner: VIACOM TELEVISION STATIONS GROUP OF LOS ANGELES LLC)
- KNBC (Channel 4; LOS ANGELES, CA; Owner: NBC SUBSIDIARY (KNBC-TV), INC.)
- KMEX-TV (Channel 34; LOS ANGELES, CA; Owner: KMEX LICENSE PARTNERSHIP, G.P.)
- KAZA-TV (Channel 54; AVALON, CA; Owner: PAPPAS SOUTHERN CALIFORNIA LICENSE LLC)
- KDOC-TV (Channel 56; ANAHEIM, CA; Owner: GOLDEN ORANGE BROADCASTING CO., INC.)
- KOCE-TV (Channel 50; HUNTINGTON BEACH, CA; Owner: BD. OF TRUSTEES, COAST COMMUNITY COLLEGE DIST.)
- KSCI (Channel 18; LONG BEACH, CA; Owner: KSLS, INC.)
- KXLA (Channel 44; RANCHO PALOS VERDES, CA; Owner: RANCHO PALOS VERDES BROADCASTERS, INC.)
- KCET (Channel 28; LOS ANGELES, CA; Owner: COMMUNITY TELEVISION OF SOUTHERN CALIFORNIA)
- KFTR (Channel 46; ONTARIO, CA; Owner: TELEFUTURA LOS ANGELES LLC)
- KTTV (Channel 11; LOS ANGELES, CA; Owner: FOX TELEVISION STATIONS, INC.)
- KWHY-TV (Channel 22; LOS ANGELES, CA; Owner: TELEMUNDO OF LOS ANGELES LICENSE CORPORATION)
- KVEA (Channel 52; CORONA, CA; Owner: ESTRELLA LICENSE CORPORATION)
- KCOP-TV (Channel 13; LOS ANGELES, CA; Owner: FOX TELEVISION STATIONS, INC.)
- KHIZ (Channel 64; BARSTOW, CA; Owner: SUNBELT TELEVISION, INC.)
- KTBN-TV (Channel 40; SANTA ANA, CA; Owner: TRINITY BROADCASTING NETWORK, INC.)
- KLCS (Channel 58; LOS ANGELES, CA; Owner: LOS ANGELES UNIFIED SCHOOL DISTRICT)
- KSFV-LP (Channel 26; SAN FERNANDO VALLEY, CA; Owner: VENTURE TECHNOLOGIES GROUP, LLC)
- K38CY (Channel 38; VAN NUYS, CA; Owner: CAPITAL BROADCASTING CORPORATION)
- KSMV-LP (Channel 33; LOS ANGELES, CA; Owner: KJLA, LLC)
- KWJD-LP (Channel 25; VAN NUYS, CA; Owner: FRIENDLY BROADCASTING COMPANY)
Medal of Honor Recipients
Medal of Honor Recipient born in Glendale: Larry Leonard Maxam.
- National Bridge Inventory (NBI) Statistics
- 125Number of bridges
- 1,962ft / 598mTotal length
- $3,343,000Total costs
- 8,355,215Total average daily traffic
- 454,342Total average daily truck traffic
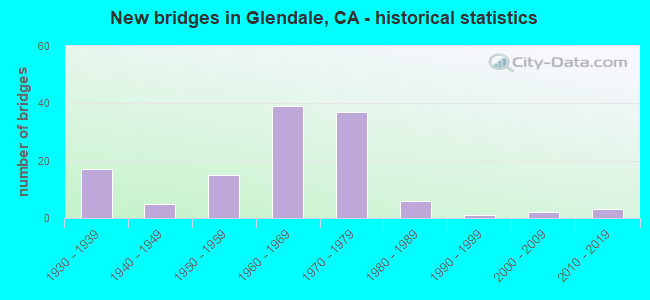
- New bridges - historical statistics
- 171930-1939
- 51940-1949
- 151950-1959
- 391960-1969
- 371970-1979
- 61980-1989
- 11990-1999
- 22000-2009
- 32010-2019
FCC Registered Private Land Mobile Towers: 15 (See the full list of FCC Registered Private Land Mobile Towers in Glendale, CA)
FCC Registered Broadcast Land Mobile Towers: 129 (See the full list of FCC Registered Broadcast Land Mobile Towers)
FCC Registered Microwave Towers: 175 (See the full list of FCC Registered Microwave Towers in this town)
FCC Registered Paging Towers: 24 (See the full list of FCC Registered Paging Towers)
FCC Registered Maritime Coast & Aviation Ground Towers: 1 (See the full list of FCC Registered Maritime Coast & Aviation Ground Towers)
FCC Registered Amateur Radio Licenses: 892 (See the full list of FCC Registered Amateur Radio Licenses in Glendale)
FAA Registered Aircraft Manufacturers and Dealers: 3 (See the full list of FAA Registered Manufacturers and Dealers in Glendale)
FAA Registered Aircraft: 76 (See the full list of FAA Registered Aircraft)
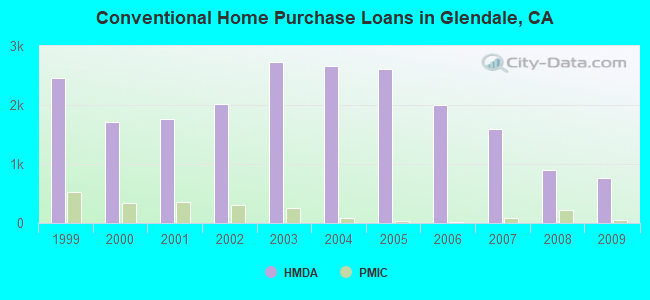
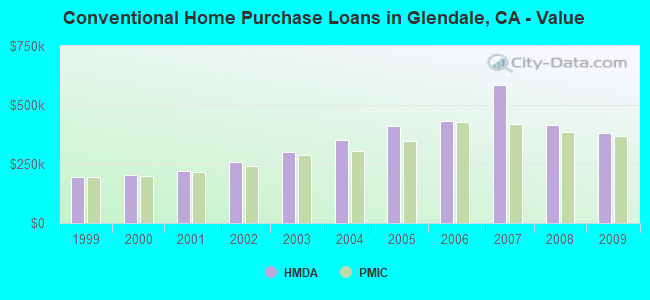
| Home Mortgage Disclosure Act Aggregated Statistics For Year 2009 (Based on 35 full tracts) | ||||||||||||||
| A) FHA, FSA/RHS & VA Home Purchase Loans | B) Conventional Home Purchase Loans | C) Refinancings | D) Home Improvement Loans | E) Loans on Dwellings For 5+ Families | F) Non-occupant Loans on < 5 Family Dwellings (A B C & D) | G) Loans On Manufactured Home Dwelling (A B C & D) | ||||||||
|---|---|---|---|---|---|---|---|---|---|---|---|---|---|---|
| Number | Average Value | Number | Average Value | Number | Average Value | Number | Average Value | Number | Average Value | Number | Average Value | Number | Average Value | |
| LOANS ORIGINATED | 146 | $446,055 | 757 | $383,194 | 2,703 | $340,900 | 144 | $266,501 | 59 | $1,200,849 | 190 | $314,197 | 0 | $0 |
| APPLICATIONS APPROVED, NOT ACCEPTED | 14 | $404,518 | 108 | $383,662 | 291 | $377,115 | 15 | $203,583 | 2 | $587,500 | 34 | $251,308 | 1 | $66,000 |
| APPLICATIONS DENIED | 54 | $431,186 | 151 | $434,616 | 897 | $393,260 | 64 | $220,466 | 18 | $1,185,421 | 92 | $326,877 | 0 | $0 |
| APPLICATIONS WITHDRAWN | 37 | $409,509 | 184 | $399,390 | 552 | $361,369 | 46 | $278,548 | 4 | $2,306,080 | 53 | $311,524 | 0 | $0 |
| FILES CLOSED FOR INCOMPLETENESS | 12 | $447,467 | 27 | $374,769 | 140 | $394,272 | 4 | $194,740 | 0 | $0 | 9 | $284,444 | 0 | $0 |
Detailed mortgage data for all 35 tracts in Glendale, CA
| Private Mortgage Insurance Companies Aggregated Statistics For Year 2009 (Based on 32 full tracts) | ||||||
| A) Conventional Home Purchase Loans | B) Refinancings | C) Non-occupant Loans on < 5 Family Dwellings (A & B) | ||||
|---|---|---|---|---|---|---|
| Number | Average Value | Number | Average Value | Number | Average Value | |
| LOANS ORIGINATED | 52 | $370,607 | 10 | $366,327 | 0 | $0 |
| APPLICATIONS APPROVED, NOT ACCEPTED | 39 | $374,445 | 12 | $415,812 | 0 | $0 |
| APPLICATIONS DENIED | 15 | $371,439 | 9 | $422,232 | 0 | $0 |
| APPLICATIONS WITHDRAWN | 7 | $355,349 | 2 | $472,000 | 0 | $0 |
| FILES CLOSED FOR INCOMPLETENESS | 9 | $308,106 | 0 | $0 | 1 | $216,000 |
2005 - 2018 National Fire Incident Reporting System (NFIRS) incidents
- Fire incident types reported to NFIRS in Glendale, CA
- 74833.2%Structure Fires
- 64028.4%Outside Fires
- 49121.8%Mobile Property/Vehicle Fires
- 37316.6%Other
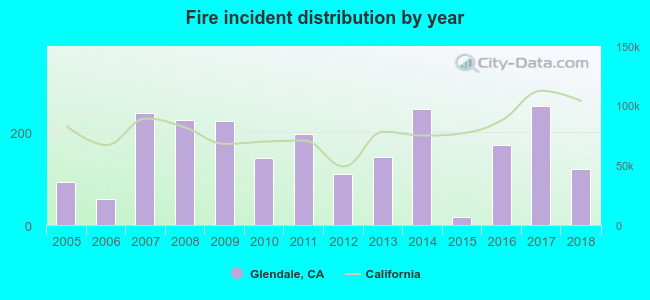 Based on the data from the years 2005 - 2018 the average number of fires per year is 161. The highest number of reported fire incidents - 257 took place in 2017, and the least - 17 in 2015. The data has an increasing trend.
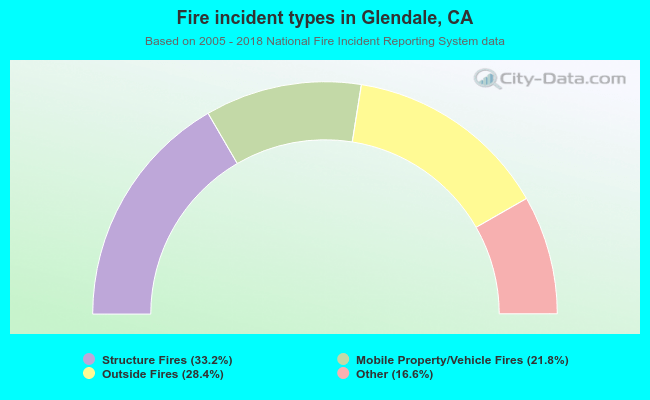 When looking into fire subcategories, the most incidents belonged to: Structure Fires (33.2%), and Outside Fires (28.4%).
Fire-safe hotels and motels in Glendale, California:
- Days Inn Glendale, 600 N Pacific, Glendale, California 91203 , Phone: (818) 956-0202
- Best Western Golden Key Motor Hotel, 123 W Colorado St, Glendale, California 91204 , Phone: (818) 247-0111, Fax: (818) 545-9393
- Hilton Los Angeles North/Glendale, 100 W Glenoaks Blvd, Glendale, California 91202 , Phone: (818) 956-5466, Fax: (818) 956-5490
- Vagabond Inn, 120 W Colorado St, Glendale, California 91204 , Phone: (818) 240-1700, Fax: (818) 548-8428
- Extended Stay America - Los Angeles - Glendale, 1377 W Glenoaks Blvd, Glendale, California 91201 , Phone: (818) 956-6665, Fax: (818) 956-6667
- Glen Capri Inn & Suites - Colorado St, 326 E Colorado St, Glendale, California 91205 , Phone: (818) 246-7401, Fax: (818) 246-7651
- Glen Capri Inn & Suites - San Fernando Rd, 6700 San Fernando Rd, Glendale, California 91201 , Phone: (818) 244-8434, Fax: (818) 240-6911
- Embassy Suites Los Angeles-Glendale, 800 N Central Ave, Glendale, California 91203 , Phone: (818) 550-0828, Fax: (818) 550-1289
- 2 other hotels and motels
| Most common first names in Glendale, CA among deceased individuals | ||
| Name | Count | Lived (average) |
|---|---|---|
| Mary | 942 | 80.4 years |
| John | 887 | 75.7 years |
| William | 841 | 75.0 years |
| Robert | 685 | 71.1 years |
| George | 554 | 76.6 years |
| James | 549 | 73.3 years |
| Charles | 517 | 76.1 years |
| Helen | 513 | 81.3 years |
| Margaret | 444 | 80.4 years |
| Joseph | 436 | 76.2 years |
| Most common last names in Glendale, CA among deceased individuals | ||
| Last name | Count | Lived (average) |
|---|---|---|
| Smith | 335 | 78.7 years |
| Johnson | 257 | 78.3 years |
| Miller | 207 | 76.9 years |
| Brown | 197 | 77.2 years |
| Jones | 158 | 78.4 years |
| Anderson | 151 | 78.2 years |
| Wilson | 130 | 78.0 years |
| Martin | 125 | 76.3 years |
| Davis | 116 | 75.9 years |
| Williams | 116 | 76.7 years |
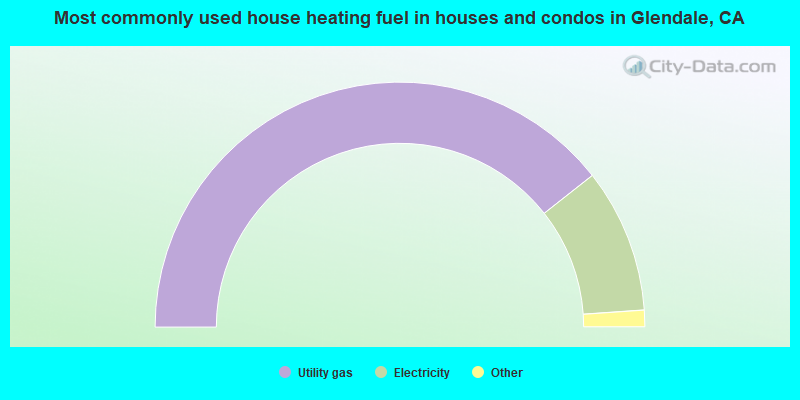
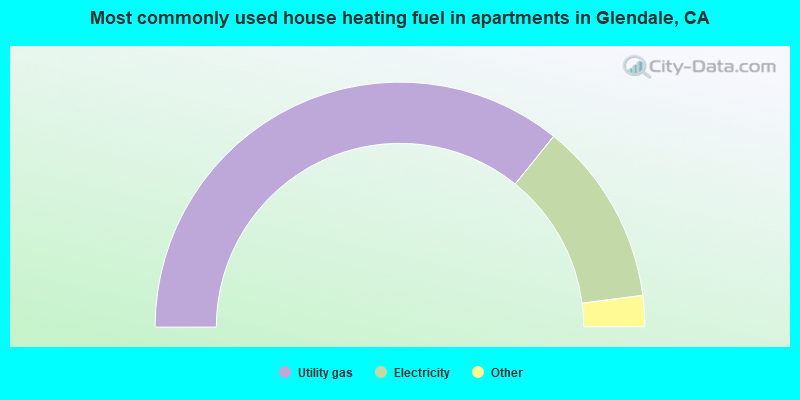
- 78.7%Utility gas
- 19.0%Electricity
- 1.0%Bottled, tank, or LP gas
- 0.7%No fuel used
- 0.3%Solar energy
- 0.2%Wood
- 71.6%Utility gas
- 24.3%Electricity
- 2.3%No fuel used
- 1.4%Bottled, tank, or LP gas
- 0.2%Solar energy
- 0.1%Fuel oil, kerosene, etc.
Glendale compared to California state average:
- Unemployed percentage below state average.
- Black race population percentage below state average.
- Hispanic race population percentage below state average.
- Median age significantly above state average.
- Foreign-born population percentage above state average.
- Percentage of population with a bachelor's degree or higher above state average.
Glendale, CA compared to other similar cities:
Glendale on our top lists:
- #1 on the list of "Top 101 cities with the most residents born in Armenia (population 500+)"
- #2 on the list of "Top 101 cities with the most residents born in Western Asia (population 500+)"
- #2 on the list of "Top 100 cities with highest ratio of median house value to median household income (pop. 50,000+)"
- #3 on the list of "Top 101 cities with largest percentage of males in occupations: arts, design, entertainment, sports, and media occupations (population 50,000+)"
- #6 on the list of "Top 101 cities with the most residents born in Iran (population 500+)"
- #10 on the list of "Top 100 cities with highest percentage of foreign-born residents (pop. 50,000+)"
- #12 on the list of "Top 101 cities with the most residents born in Lebanon (population 500+)"
- #14 on the list of "Top 101 cities with the most residents born in Asia (population 500+)"
- #18 on the list of "Top 100 cities with smallest houses (pop. 50,000+)"
- #19 on the list of "Top 101 cities with the lowest number of rapes per 100,000 residents (population 50,000+)"
- #21 on the list of "Top 101 cities with the smallest sunshine amount differences during a year (population 50,000+)"
- #22 on the list of "Top 101 cities with the most residents born in Other Western Asia (population 500+)"
- #24 on the list of "Top 101 cities with largest percentage of males in industries: information (population 50,000+)"
- #33 on the list of "Top 101 cities with the most residents born in South Central Asia (population 500+)"
- #35 on the list of "Top 101 cities with the lowest number of murders per 100,000 residents (population 50,000+)"
- #35 on the list of "Top 101 cities with the largest percentage of people in institutions for the deaf (population 1,000+)"
- #36 on the list of "Top 101 cities with the lowest city-data.com crime index (population 50,000+)"
- #39 on the list of "Top 100 safest cities (lowest city-data.com crime index) (pop. 50,000+)"
- #42 on the list of "Top 100 cities with highest percentage of renters (pop. 50,000+)"
- #43 on the list of "Top 101 cities with largest percentage of females in occupations: arts, design, entertainment, sports, and media occupations (population 50,000+)"
- #18 (91203) on the list of "Top 101 zip codes with the largest percentage of Arab first ancestries"
- #51 (91201) on the list of "Top 101 zip codes with the largest percentage of taxpayers reporting profit/loss from business in 2012 (pop 5,000+)"
- #70 (91204) on the list of "Top 101 zip codes with the largest percentage of Greek first ancestries (pop 5,000+)"
- #1 on the list of "Top 101 counties with the most Evangelical Protestant congregations"
- #1 on the list of "Top 101 counties with the most Mainline Protestant congregations"
- #1 on the list of "Top 101 counties with the most Orthodox adherents"
- #1 on the list of "Top 101 counties with the highest ground withdrawal of fresh water for public supply (pop. 50,000+)"
- #1 on the list of "Top 101 counties with the most Catholic adherents (pop. 50,000+)"

|
|
Total of 1972 patent applications in 2008-2024.