Estimated zip code population in 2022: 20,219 Zip code population in 2010: 20,280 Zip code population in 2000: 20,187
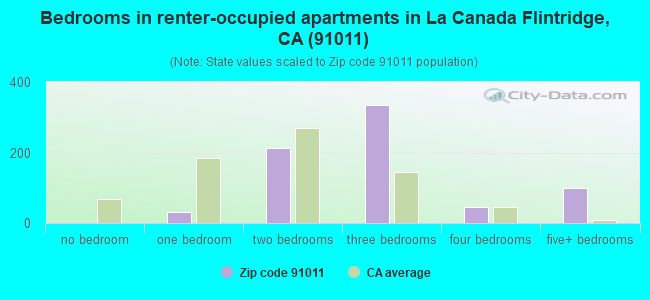
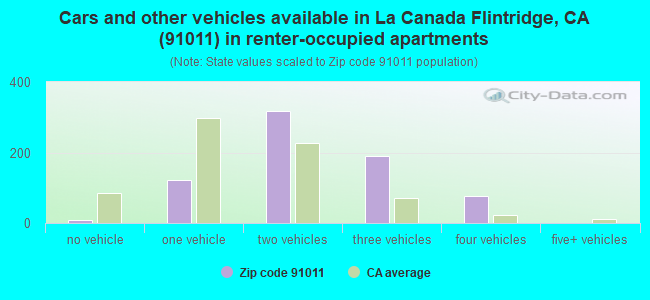
Houses and condos: 7,085 Renter-occupied apartments: 721
% of renters here:
11%
State:
44%
March 2022 cost of living index in zip code 91011: 142.2 (very high, U.S. average is 100)
Land area: 11.9 sq. mi. Water area: 0.0 sq. mi.
Population density: 1,706 people per square mile
(low).
OSM Map
General Map
Google Map
MSN Map
OSM Map
General Map
Google Map
MSN Map
OSM Map
General Map
Google Map
MSN Map
OSM Map
General Map
Google Map
MSN Map
Please wait while loading the map...
Real estate property taxes paid for housing units in 2022:
This zip code:
0.5% ($10,292)
California:
0.7% ($4,831)
Median real estate property taxes paid for housing units with mortgages in 2022: $10,330 (0.5%) Median real estate property taxes paid for housing units with no mortgage in 2022: $8,386 (0.5%)
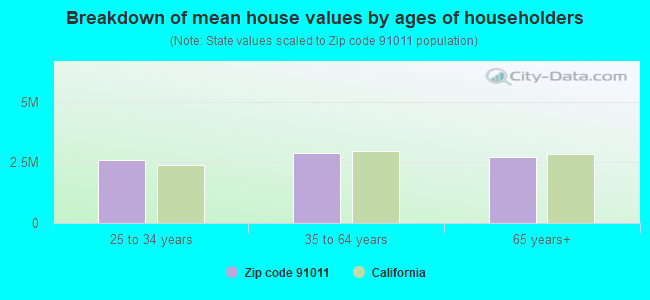
Estimated median house/condo value in 2022: $2,152,803
91011:
$2,152,803
California:
$715,900
According to our research of California and other state lists, there was 1 registered sex offender living in 91011 zip code as of April 27, 2024. The ratio of all residents to sex offenders in zip code 91011 is 20,975 to 1. The ratio of registered sex offenders to all residents in this zip code is much lower than the state average.
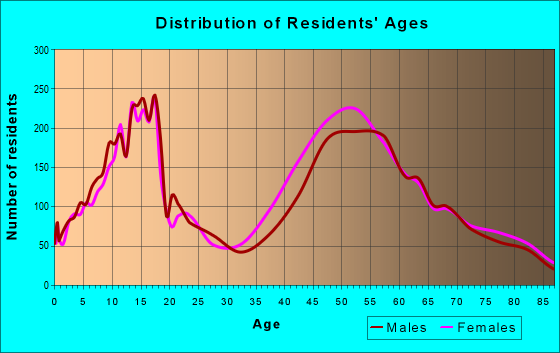
Median resident age:
This zip code:
45.8 years
California median age:
37.9 years
Average household size:
This zip code:
3.1 people
California:
2.8 people
Averages for the 2020 tax year for zip code 91011, filed in 2021:
Average Adjusted Gross Income (AGI) in 2020: $337,119 (Individual Income Tax Returns)
Here:
$337,119
State:
$95,910
Salary/wage: $202,467 (reported on 72.6% of returns)
Here:
$202,467
State:
$77,331
(% of AGI for various income ranges: 1355.3% for AGIs below $25k, 4310.7% for AGIs $25k-50k, 7714.0% for AGIs $50k-75k, 11246.3% for AGIs $75k-100k, 20207.9% for AGIs $100k-200k, 159422.7% for AGIs over 200k)
Taxable interest for individuals: $7,745 (reported on 64.8% of returns)
This zip code:
$7,745
California:
$2,294
(% of AGI for various income ranges: 82.2% for AGIs below $25k, 162.4% for AGIs $25k-50k, 185.2% for AGIs $50k-75k, 370.0% for AGIs $75k-100k, 784.5% for AGIs $100k-200k, 5347.4% for AGIs over 200k)
Ordinary dividends: $28,432 (reported on 54.5% of returns)
Here:
$28,432
State:
$10,949
(% of AGI for various income ranges: 199.6% for AGIs below $25k, 335.0% for AGIs $25k-50k, 488.8% for AGIs $50k-75k, 981.9% for AGIs $75k-100k, 1747.1% for AGIs $100k-200k, 17418.2% for AGIs over 200k)
Net capital gain/loss in AGI: +$114,774 (reported on 53.2% of returns)
Here:
+$114,774
State:
+$49,306
(% of AGI for various income ranges: 93.5% for AGIs below $25k, 332.8% for AGIs $25k-50k, 622.2% for AGIs $50k-75k, 1076.3% for AGIs $75k-100k, 1745.8% for AGIs $100k-200k, 76436.6% for AGIs over 200k)
Profit/loss from business: +$43,530 (reported on 23.2% of returns)
Here:
+$43,530
State:
+$15,671
(% of AGI for various income ranges: 273.9% for AGIs below $25k, 572.4% for AGIs $25k-50k, 650.2% for AGIs $50k-75k, 1313.3% for AGIs $75k-100k, 1822.0% for AGIs $100k-200k, 9856.3% for AGIs over 200k)
Taxable individual retirement arrangement distribution: $44,969 (reported on 12.4% of returns)
91011:
$44,969
California:
$23,505
(% of AGI for various income ranges: 80.3% for AGIs below $25k, 232.2% for AGIs $25k-50k, 448.2% for AGIs $50k-75k, 789.6% for AGIs $75k-100k, 1987.6% for AGIs $100k-200k, 4623.0% for AGIs over 200k)
Self-employed (Keogh) retirement plans: $45,508 (reported on 5.2% of returns)
91011:
$45,508
California:
$30,163
(% of AGI for various income ranges: 84.5% for AGIs $50k-75k, 240.8% for AGIs $100k-200k, 2790.7% for AGIs over 200k)
Total itemized deductions: $62,210 (reported on 40.7% of returns)
Here:
$62,210
State:
$39,517
(% of AGI for various income ranges: 361.4% for AGIs below $25k, 985.2% for AGIs $25k-50k, 1313.0% for AGIs $50k-75k, 2737.8% for AGIs $75k-100k, 4787.9% for AGIs $100k-200k, 25662.6% for AGIs over 200k)
Charity contributions: $28,662 (reported on 36.6% of returns)
Here:
$28,662
State:
$12,598
(% of AGI for various income ranges: 21.9% for AGIs below $25k, 83.3% for AGIs $25k-50k, 147.0% for AGIs $50k-75k, 396.7% for AGIs $75k-100k, 812.4% for AGIs $100k-200k, 12542.7% for AGIs over 200k)
Taxes paid: $9,486 (reported on 40.7% of returns)
91011:
$9,486
State:
$8,807
(% of AGI for various income ranges: 77.0% for AGIs below $25k, 182.2% for AGIs $25k-50k, 288.2% for AGIs $50k-75k, 662.6% for AGIs $75k-100k, 1127.0% for AGIs $100k-200k, 3367.3% for AGIs over 200k)
Earned income credit: $1,360 (reported on 4.2% of returns)
Here:
$1,360
State:
$2,074
(% of AGI for various income ranges: 38.0% for AGIs below $25k, 40.7% for AGIs $25k-50k)
Percentage of individuals using paid preparers for their 2020 taxes: 92.5%
Here:
92%
State:
92%
(% for various income ranges: 91.3% for AGIs below $25k, 92.3% for AGIs $25k-50k, 92.3% for AGIs $50k-75k, 93.8% for AGIs $75k-100k, 92.4% for AGIs $100k-200k, 93.0% for AGIs over 200k)
Averages for the 2012 tax year for zip code 91011, filed in 2013:
Average Adjusted Gross Income (AGI) in 2012: $288,965 (Individual Income Tax Returns)
Here:
$288,965
State:
$72,726
Salary/wage: $178,177 (reported on 73.4% of returns)
Here:
$178,177
State:
$59,079
(% of AGI for various income ranges: 72.2% for AGIs below $25k, 64.5% for AGIs $25k-50k, 57.6% for AGIs $50k-75k, 47.2% for AGIs $75k-100k, 59.4% for AGIs $100k-200k, 42.8% for AGIs over 200k)
Taxable interest for individuals: $8,131 (reported on 65.5% of returns)
This zip code:
$8,131
California:
$2,146
(% of AGI for various income ranges: 3.6% for AGIs below $25k, 2.3% for AGIs $25k-50k, 2.4% for AGIs $50k-75k, 2.4% for AGIs $75k-100k, 1.5% for AGIs $100k-200k, 1.8% for AGIs over 200k)
Ordinary dividends: $34,605 (reported on 51.4% of returns)
Here:
$34,605
State:
$9,308
(% of AGI for various income ranges: 6.9% for AGIs below $25k, 3.4% for AGIs $25k-50k, 3.9% for AGIs $50k-75k, 5.6% for AGIs $75k-100k, 3.3% for AGIs $100k-200k, 6.6% for AGIs over 200k)
Net capital gain/loss in AGI: +$63,975 (reported on 48.0% of returns)
Here:
+$63,975
State:
+$30,460
(% of AGI for various income ranges: 1.0% for AGIs below $25k, 0.5% for AGIs $25k-50k, 2.9% for AGIs $50k-75k, 1.9% for AGIs $75k-100k, 1.2% for AGIs $100k-200k, 12.4% for AGIs over 200k)
Profit/loss from business: +$46,374 (reported on 23.6% of returns)
Here:
+$46,374
State:
+$17,064
(% of AGI for various income ranges: 15.2% for AGIs below $25k, 11.4% for AGIs $25k-50k, 8.2% for AGIs $50k-75k, 7.9% for AGIs $75k-100k, 6.6% for AGIs $100k-200k, 3.0% for AGIs over 200k)
Taxable individual retirement arrangement distribution: $39,771 (reported on 15.3% of returns)
91011:
$39,771
California:
$19,557
(% of AGI for various income ranges: 4.1% for AGIs below $25k, 3.8% for AGIs $25k-50k, 5.2% for AGIs $50k-75k, 7.0% for AGIs $75k-100k, 5.2% for AGIs $100k-200k, 1.5% for AGIs over 200k)
Self-employment retirement plans: $38,183 (reported on 5.1% of returns)
91011:
$38,183
California:
$24,530
(% of AGI for various income ranges: 1.0% for AGIs below $25k, 0.8% for AGIs $50k-75k, 0.6% for AGIs $100k-200k, 0.7% for AGIs over 200k)
Total itemized deductions: $83,816 (19% of AGI, reported on 63.1% of returns)
Here:
$83,816
State:
$34,004
Here:
19.1% of AGI
State:
22.7% of AGI
(% of AGI for various income ranges: 29.7% for AGIs below $25k, 21.6% for AGIs $25k-50k, 26.4% for AGIs $50k-75k, 27.4% for AGIs $75k-100k, 25.9% for AGIs $100k-200k, 16.8% for AGIs over 200k)
Charity contributions: $16,005 (reported on 56.6% of returns)
Here:
$16,005
State:
$4,659
(% of AGI for various income ranges: 1.5% for AGIs below $25k, 1.9% for AGIs $25k-50k, 2.2% for AGIs $50k-75k, 3.1% for AGIs $75k-100k, 3.0% for AGIs $100k-200k, 3.2% for AGIs over 200k)
Taxes paid: $44,610 (reported on 63.0% of returns)
91011:
$44,610
State:
$14,448
(% of AGI for various income ranges: 6.7% for AGIs below $25k, 6.2% for AGIs $25k-50k, 7.9% for AGIs $50k-75k, 8.9% for AGIs $75k-100k, 10.2% for AGIs $100k-200k, 9.8% for AGIs over 200k)
Earned income credit: $1,418 (reported on 4.7% of returns)
Here:
$1,418
State:
$2,286
(% of AGI for various income ranges: 1.9% for AGIs below $25k, 0.5% for AGIs $25k-50k)
Percentage of individuals using paid preparers for their 2012 taxes: 71.0%
Here:
71%
State:
64%
(% for various income ranges: 60.9% for AGIs below $25k, 67.0% for AGIs $25k-50k, 73.3% for AGIs $50k-75k, 73.0% for AGIs $75k-100k, 71.8% for AGIs $100k-200k, 79.6% for AGIs over 200k)
Averages for the 2004 tax year for zip code 91011, filed in 2005:
Average Adjusted Gross Income (AGI) in 2004: $183,960 (Individual Income Tax Returns)
Here:
$183,960
State:
$58,600
Salary/wage: $140,564 (reported on 70.6% of returns)
Here:
$140,564
State:
$49,455
(% of AGI for various income ranges: 58.6% for AGIs $10k-25k, 57.0% for AGIs $25k-50k, 54.4% for AGIs $50k-75k, 53.8% for AGIs $75k-100k, 52.7% for AGIs over 100k)
Taxable interest for individuals: $6,855 (reported on 74.3% of returns)
This zip code:
$6,855
California:
$2,365
(% of AGI for various income ranges: 6.5% for AGIs $10k-25k, 4.5% for AGIs $25k-50k, 4.9% for AGIs $50k-75k, 2.5% for AGIs $75k-100k, 2.5% for AGIs over 100k)
Taxable dividends: $18,430 (reported on 58.1% of returns)
Here:
$18,430
State:
$4,746
(% of AGI for various income ranges: 6.3% for AGIs $10k-25k, 4.9% for AGIs $25k-50k, 4.3% for AGIs $50k-75k, 3.4% for AGIs $75k-100k, 5.8% for AGIs over 100k)
Net capital gain/loss: +$38,176 (reported on 53.2% of returns)
Here:
+$38,176
State:
+$23,418
(% of AGI for various income ranges: 2.6% for AGIs $10k-25k, 1.2% for AGIs $25k-50k, 1.5% for AGIs $50k-75k, 2.5% for AGIs $75k-100k, 11.5% for AGIs over 100k)
Profit/loss from business: +$36,854 (reported on 24.7% of returns)
Here:
+$36,854
State:
+$16,826
(% of AGI for various income ranges: 11.5% for AGIs $10k-25k, 10.9% for AGIs $25k-50k, 9.6% for AGIs $50k-75k, 9.5% for AGIs $75k-100k, 4.3% for AGIs over 100k)
Profit/loss from farming: +$8,882 (reported on 0.2% of returns)
Here:
+$8,882
State:
-$7,562
IRA payment deduction: $4,042 (reported on 5.0% of returns)
91011:
$4,042
California:
$3,192
(% of AGI for various income ranges: 0.5% for AGIs $10k-25k, 0.5% for AGIs $25k-50k, 0.4% for AGIs $50k-75k, 0.3% for AGIs $75k-100k, 0.1% for AGIs over 100k)
Self-employed pension: $27,447 (reported on 6.0% of returns)
Here:
$27,447
California:
$17,688
(% of AGI for various income ranges: 0.3% for AGIs $25k-50k, 0.7% for AGIs $50k-75k, 0.8% for AGIs $75k-100k, 0.9% for AGIs over 100k)
Total itemized deductions: $59,129 (21% of AGI, reported on 62.8% of returns)
Here:
$59,129
State:
$28,113
Here:
20.8% of AGI
State:
25.3% of AGI
(% of AGI for various income ranges: 33.7% for AGIs $10k-25k, 30.6% for AGIs $25k-50k, 30.6% for AGIs $50k-75k, 30.6% for AGIs $75k-100k, 18.7% for AGIs over 100k)
Charity contributions deductions: $11,427 (4% of AGI, reported on 57.9% of returns)
Here:
$11,427
State:
$3,923
Here:
3.8% of AGI
State:
3.3% of AGI
(% of AGI for various income ranges: 2.0% for AGIs $10k-25k, 2.9% for AGIs $25k-50k, 3.2% for AGIs $50k-75k, 4.0% for AGIs $75k-100k, 3.6% for AGIs over 100k)
Total tax: $46,361 (reported on 82.4% of returns)
91011:
$46,361
State:
$10,761
(% of AGI for various income ranges: 5.3% for AGIs $10k-25k, 8.0% for AGIs $25k-50k, 9.4% for AGIs $50k-75k, 10.4% for AGIs $75k-100k, 21.8% for AGIs over 100k)
Earned income credit: $1,159 (reported on 3.7% of returns)
Here:
$1,159
State:
$1,763
Percentage of individuals using paid preparers for their 2004 taxes: 73.9%
Here:
74%
State:
66%
(% for various income ranges: 65.7% for AGIs below $10k, 69.2% for AGIs $10k-25k, 72.7% for AGIs $25k-50k, 77.3% for AGIs $50k-75k, 76.5% for AGIs $75k-100k, 78.1% for AGIs over 100k)
Household received Food Stamps/SNAP in the past 12 months: 139 Household did not receive Food Stamps/SNAP in the past 12 months: 6,280
Women who had a birth in the past 12 months: 162 (90 now married, 73 unmarried) Women who did not have a birth in the past 12 months: 3,524 (2,051 now married, 1,446 unmarried)
Housing units in zip code 91011 with a mortgage: 3,900 (628 second mortgage, 55 home equity loan, 548 both second mortgage and home equity loan) Houses without a mortgage: 53
Median monthly owner costs for units with a mortgage: $3,876 Median monthly owner costs for units without a mortgage: $1,276
Residents with income below the poverty level in 2022:
This zip code:
3.3%
Whole state:
12.2%
Residents with income below 50% of the poverty level in 2022:
This zip code:
1.7%
Whole state:
6.2%
Median number of rooms in houses and condos:
Here:
7.7
State:
6.0
Median number of rooms in apartments:
Here:
5.1
State:
3.9
Notable locations in this zip code not listed on our city pages
Notable locations in zip code 91011: La Canada Water Reclamation Plant (A), California Institute of Technology - Jet Propulsion Laboratory (B), La Canada Country Club (C), La Canada Flintridge Branch Los Angeles County Public Library (D), Los Angeles County Fire Department Station 82 (E), Los Angeles County Fire Department Station 19 (F). Display/hide their locations on the map
Churches in zip code 91011 include: Church of the Lighted Window (A), La Canada Presbyterian Church (B), La Canada United Methodist Church (C), Lutheran Church In The Foothills (D), Saint Bede The Venerable Church (E), Saint George's Episcopal Church (F). Display/hide their locations on the map
In group quarters: 52 (-1 institutionalized population)
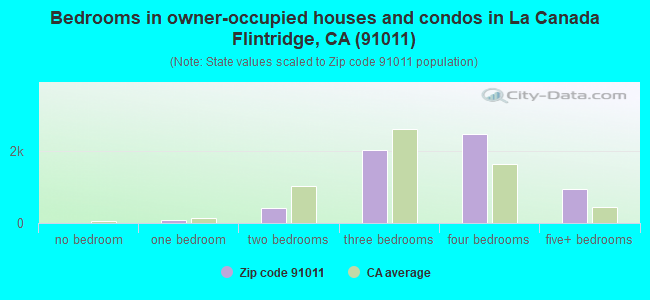
Size of family households: 1,993 2-persons, 1,138 3-persons, 1,552 4-persons, 752 5-persons, 105 6-persons, 68 7-or-more-persons
Size of nonfamily households: 728 1-person, 158 2-persons, 9 3-persons
4,899 married couples with children.
415 single-parent households (123 men, 292 women).
67.8% of residents of 91011 zip code speak English at home.
5.8% of residents speak Spanish at home (76% very well, 20% well, 5% not well).
9.9% of residents speak other Indo-European language at home (83% very well, 9% well, 7% not well).
16.1% of residents speak Asian or Pacific Island language at home (60% very well, 26% well, 13% not well, 1% not at all).
0.7% of residents speak other language at home (86% very well, 14% not at all).
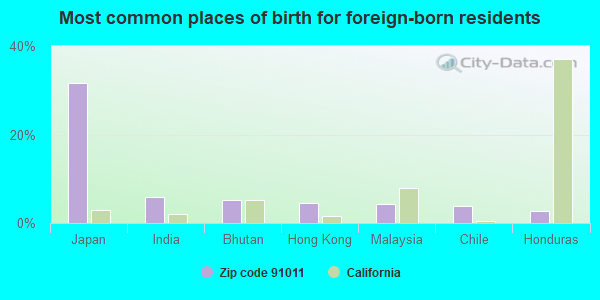
Foreign born population: 5,177 (25.6%) (74.1% of them are naturalized citizens)
This zip code:
25.6%
Whole state:
26.7%
32%Japan
6%India
5%Bhutan
4%Hong Kong
4%Malaysia
4%Chile
3%Honduras
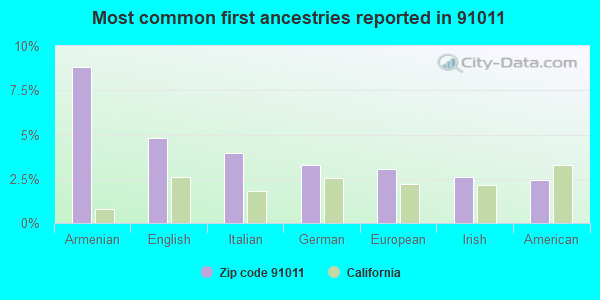
9%Armenian
5%English
4%Italian
3%German
3%European
3%Irish
2%American
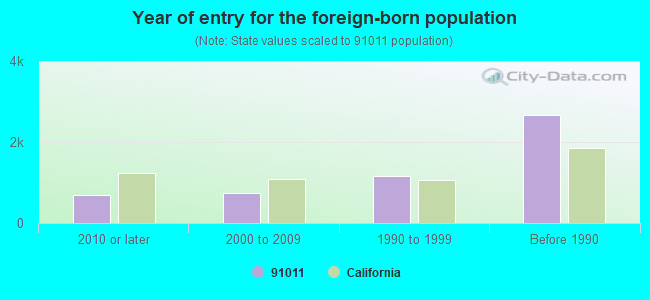
Year of entry for the foreign-born population
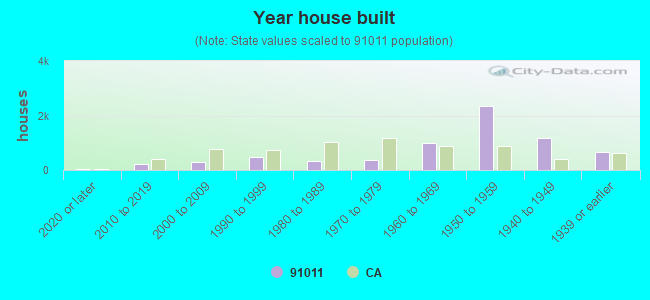
6882010 or later
7332000 to 2009
1,1581990 to 1999
2,670Before 1990
Major facilities with environmental interests located in this zip code:
FLINTRIDGE CLEANERS (1121 FOOTHILL BLVD in LA CANADA, CA)
SUPERFUND (Superfund database) STATE MASTER (California - Hazardous Waste Tracking) - HAZARDOU WASTE PROGRAM Small Quantity Generators, between 100 kg and 1000 kg of hazardous waste/month (Resource Conservation and Recovery Act (tracking hazardous waste))
FOOTHILL CHEVROLET (1919 VERDUGO BOULEVARD in LA CANADA FLINTRIDGE, CA)
(Integrated Compliance Information System) - ICIS-HQ-1976-0009, FORMAL ENFORCEMENT ACTION Small Quantity Generators, between 100 kg and 1000 kg of hazardous waste/month (Resource Conservation and Recovery Act (tracking hazardous waste)) - notification Business SIC classification: MOTOR VEHICLE DEALERS (NEW AND USED) Organizations: CHUCK BENNETT (CONTACT/OWNER)
Alternative names: MULLER CHEVROLET INC
CHILAO MAINT STATION (STAR ROUTE in LA CANADA, CA)
STATE MASTER (California - Hazardous Waste Tracking) - HAZARDOU WASTE PROGRAM Small Quantity Generators, between 100 kg and 1000 kg of hazardous waste/month (Resource Conservation and Recovery Act (tracking hazardous waste)) - notification Organizations: CALTRANS (CONTACT/OWNER)
Alternative names: CALTRANS DISTRICT 7/CHILAO MS.
G T EQUIPMENT (4911 CROWN AVE in LA CANADA, CA)
STATE MASTER (California - Hazardous Waste Tracking) - HAZARDOU WASTE PROGRAM TRANSPORTER (Resource Conservation and Recovery Act (tracking hazardous waste)) - notification Organizations: DAVID A CRONIN (CONTACT/OWNER)
GOULD SUBSTATION (5830 ANGELES CREST HWY in LA CANADA, CA)
STATE MASTER (California - Hazardous Waste Tracking) - HAZARDOU WASTE PROGRAM Small Quantity Generators, between 100 kg and 1000 kg of hazardous waste/month (Resource Conservation and Recovery Act (tracking hazardous waste)) - notification Organizations: SOUTHERN CALIFORNIA EDISON (CONTACT/OWNER)
LONG BEACH USD-CAMP HIHILL (STAR ROUTE in LA CANADA, CA)
STATE MASTER (California - Hazardous Waste Tracking) - HAZARDOU WASTE PROGRAM Small Quantity Generators, between 100 kg and 1000 kg of hazardous waste/month (Resource Conservation and Recovery Act (tracking hazardous waste)) Alternative names: LBUSD-CAMP HIHILL
CHEVRON STATION 9 6368 (623 FOOTHILL BLVD in LA CANADA, CA)
STATE MASTER (California - Hazardous Waste Tracking) - HAZARDOU WASTE PROGRAM Small Quantity Generators, between 100 kg and 1000 kg of hazardous waste/month (Resource Conservation and Recovery Act (tracking hazardous waste)) - notification Organizations: CHEVRON PRODUCTS CO (CONTACT/OWNER)
Alternative names: CHEVRON STATION NO 96368
FOOTHILLS (SPECIAL EDUCATION) (4490 CORNISHON AVE. in LA CANADA, CA)
(National Center for Education Statistics) - STATE ID-1995950 Organizations: LA CANADA UNIFIED (SCHOOL DISTRICT)
LA CANADA ELEMENTARY (4540 ENCINAS DR. in LA CANADA, CA)
(National Center for Education Statistics) - STATE ID-6014633 Organizations: LA CANADA UNIFIED (SCHOOL DISTRICT)
LA CANADA HIGH (4463 OAK GROVE DR. in LA CANADA, CA)
(National Center for Education Statistics) - STATE ID-1934611 Organizations: LA CANADA UNIFIED (SCHOOL DISTRICT)
GOULD SUBSTATION (5858 ANGELES CREST HWY in LA CANADA, CA)
HAZARDOUS WASTE BIENNIAL REPORTER (Resource Conservation and Recovery Act (tracking hazardous waste)) Large Quantity Generators, more that 1000 kg of hazardous waste/month (Resource Conservation and Recovery Act (tracking hazardous waste)) Business NAICS classification: ELECTRIC POWER DISTRIBUTION.
FASHION CLEANERS (2222 FOOTHILL BLVD in LA CANADA, CA)
Small Quantity Generators, between 100 kg and 1000 kg of hazardous waste/month (Resource Conservation and Recovery Act (tracking hazardous waste)) - notification Organizations: ROBERT SAMUEL (CONTACT/OWNER)
FLINTRIDGE PREPARATORY SCHOOL (4543 CROWN AVE in LA CANADA FLINTRIDGE, CA)
Conditionally Exempt Small Quantity Generators, less than 100 kg/month of hazardous waste (Resource Conservation and Recovery Act (tracking hazardous waste)) - notification
Housing units lacking complete plumbing facilities: 0.5% Housing units lacking complete kitchen facilities: 0.3%
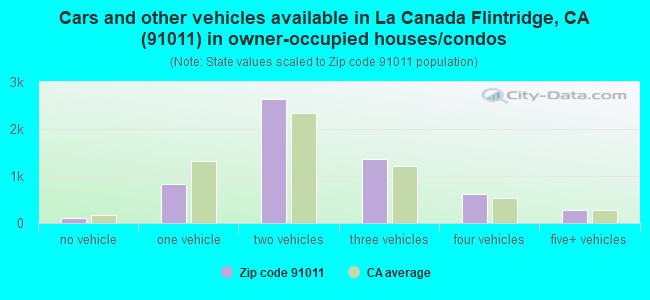
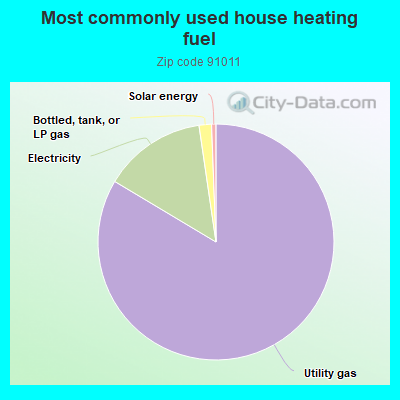
83.5%Utility gas
14.1%Electricity
1.7%Bottled, tank, or LP gas
0.6%Solar energy
Population in 1990: 19,699. Population change in the 1990s: +488 (+2.5%).
Place of birth for U.S.-born residents:
This state: 11,491
Northeast: 916
Midwest: 1,064
South: 901
West: 459
64% of the 91011 zip code residents lived in the same house 5 years ago. Out of people who lived in different houses, 85% lived in this county. Out of people who lived in different counties, 50% lived in California.
92% of the 91011 zip code residents lived in the same house 1 year ago. Out of people who lived in different houses, 73% moved from this county. Out of people who lived in different houses, 6% moved from different county within same state. Out of people who lived in different houses, 13% moved from different state. Out of people who lived in different houses, 10% moved from abroad.
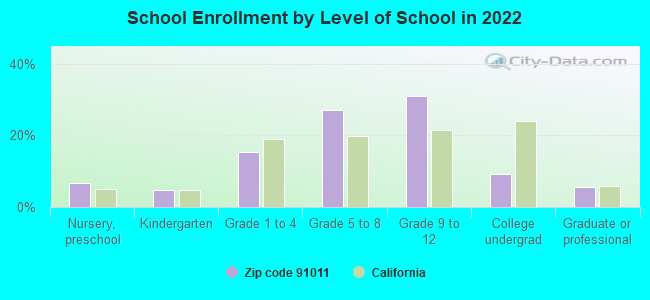
Private vs. public school enrollment:
Students in private schools in grades 1 to 8 (elementary and middle school): 285
Here:
11.1%
California:
10.5%
Students in private schools in grades 9 to 12 (high school): 195
Here:
10.4%
California:
8.5%
Students in private undergraduate colleges: 155
Here:
27.2%
California:
15.9%
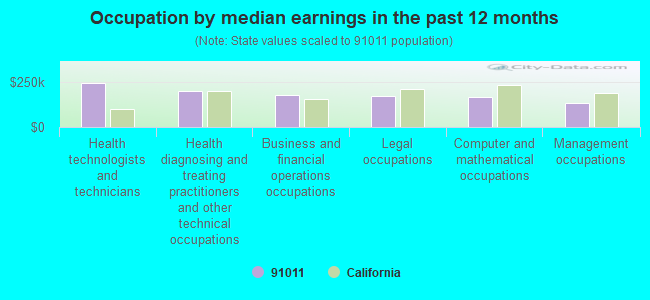
Occupation by median earnings in the past 12 months ($)
246,465Health technologists and technicians
202,457Health diagnosing and treating practitioners and other technical occupations
178,111Business and financial operations occupations
171,503Legal occupations
165,952Computer and mathematical occupations
136,766Management occupations
Companies with federal contracts located in this zip code:
SIMULATION TECHNOLOGIES, INC. (4210 BEULAH DR. in LA CANADA, CA; small business)
$237,459 with Air Force for Weapons -- Applied Research and Exploratory Development (R&D). Signed on 1999-12-01. Completion date: 2001-11-04.
DCW INDUSTRIES, INC (5354 PALM DRIVE in LA CANADA, CA; small business) : $161,713 in 4 contractsfrom 2000 to 2002
$67,317 with Army for Other Research and Development -- Basic Research (R&D). Signed on 2000-12-05. Completion date: 2001-12-14.
$64,396, same as above.Signed on 2000-01-20. Completion date: 2000-12-14.
$30,000, same as above.Signed on 2002-08-01. Completion date: 2003-01-31.
$0, same as above.Signed on 2000-01-20. Completion date: 2000-12-14.
ILLUSIONWORKS L L C (694 WENDOVER RD in LA CANADA, CA; small business)
$53,500 with Army for Video Recording and Reproducing Equipment. Signed on 2002-02-20. Completion date: 2002-03-11.
OAKTREE LEARNING SYSTEMS, INC (1313 FOOTHILL BOULEVARD, # in LA CANADA FLIN, CA; small business) : $15,600 in 2 contractsin 2004
$7,800 with U.S. Army Corps of Engineers - civil program financing only for Lectures For Training. Taking place in MA. Signed on 2004-01-28. Completion date: 2004-05-26.
$7,800 with Army for Lectures For Training. Taking place in MA. Signed on 2004-01-28. Completion date: 2004-05-26.
Top industries in this zip code by the number of employees in 2005:


+$8,882
-$7,562
 Nearest zip codes: 91020, 91046, 91214, 91208, 91206, 91103.