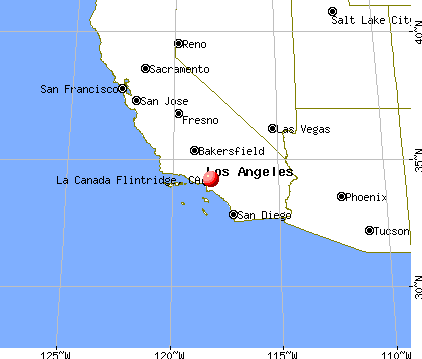
La Canada Flintridge, California
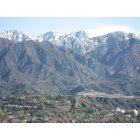
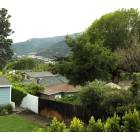
La Canada Flintridge: View of the San Gabriels with JPL in the lower right.
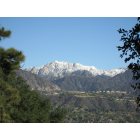
La Canada Flintridge: View of the San Gabriels from Flintridge Circle
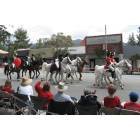
La Canada Flintridge: Annual Memorial Day parade on Foothill Blvd.
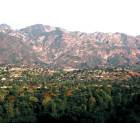
La Canada Flintridge: A viewpoint from Descanso Gardens
La Canada Flintridge: La Canada in rain
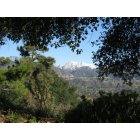
La Canada Flintridge: View of the San Gabriels through the trees near Cherry Canyon
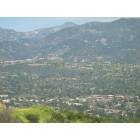
La Canada Flintridge: La Canada from Cherry Canyon trails
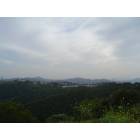
La Canada Flintridge: from Angeles Crest Highway

La Canada Flintridge: The La Canada Sunset
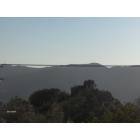
La Canada Flintridge: A view of the mountains from La Canada
- add
your
Submit your own pictures of this city and show them to the world
- OSM Map
- General Map
- Google Map
- MSN Map
Population change since 2000: -2.8%
 |
| Males: 9,805 | |
| Females: 9,947 |
| Median resident age: | 46.1 years |
| California median age: | 37.9 years |
Zip codes: 91103.
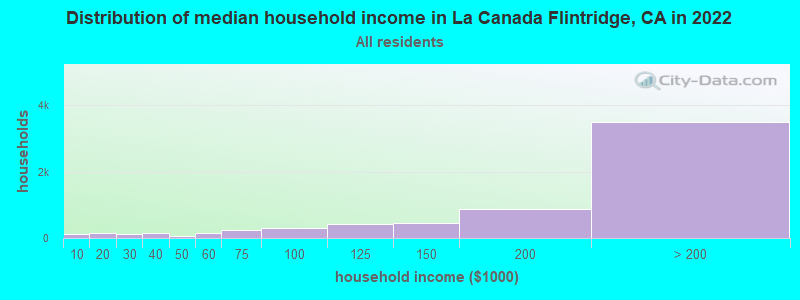
| La Canada Flintridge: | over $200,000 |
| CA: | $91,551 |
Estimated per capita income in 2022: $102,851 (it was $52,838 in 2000)
La Canada Flintridge city income, earnings, and wages data
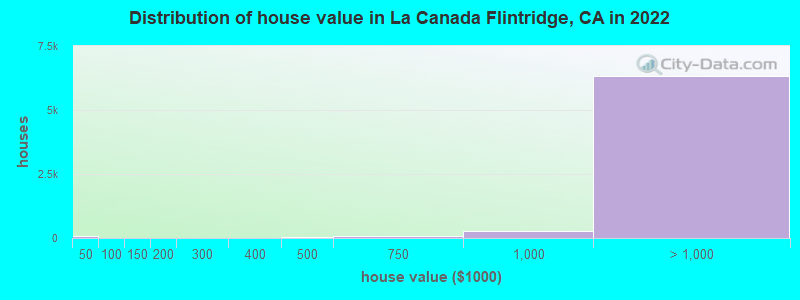
Estimated median house or condo value in 2022: over $1,000,000 (it was $588,200 in 2000)
| La Canada Flintridge: | over $1,000,000 |
| CA: | $715,900 |
Mean prices in 2022: all housing units: over $1,000,000; detached houses: over $1,000,000; townhouses or other attached units: $970,380; in 5-or-more-unit structures: $432,128
Median gross rent in 2022: $3,501.
La Canada Flintridge, CA residents, houses, and apartments details
(2.8% for White Non-Hispanic residents, 21.1% for Black residents, 4.2% for Hispanic or Latino residents, 1.1% for other race residents, 2.7% for two or more races residents)
Detailed information about poverty and poor residents in La Canada Flintridge, CA


Compare current foreclosures near La Canada Flintridge, CA:


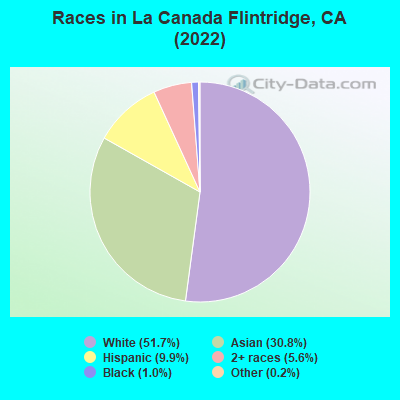
- 10,30351.7%White alone
- 6,14630.8%Asian alone
- 1,9749.9%Hispanic
- 1,1185.6%Two or more races
- 2061.0%Black alone
- 470.2%Other race alone
- 120.06%Native Hawaiian and Other
Pacific Islander alone - 80.04%American Indian alone
According to our research of California and other state lists, there was 1 registered sex offender living in La Canada Flintridge, California as of April 26, 2024.
The ratio of all residents to sex offenders in La Canada Flintridge is 20,641 to 1.
The ratio of registered sex offenders to all residents in this city is much lower than the state average.
Type |
2009 |
2010 |
2011 |
2012 |
2013 |
2014 |
2015 |
2016 |
2017 |
2018 |
2019 |
2020 |
2022 |
|---|---|---|---|---|---|---|---|---|---|---|---|---|---|
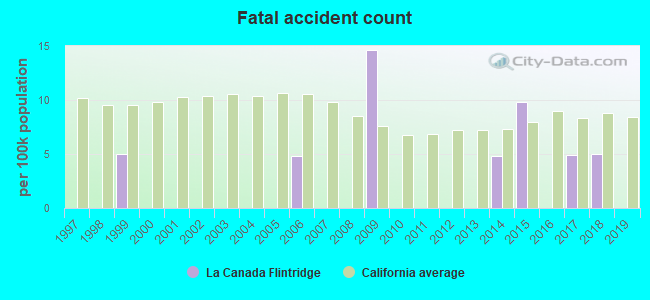
| Murders (per 100,000) | 1 (4.8) | 0 (0.0) | 0 (0.0) | 0 (0.0) | 0 (0.0) | 0 (0.0) | 1 (4.8) | 0 (0.0) | 0 (0.0) | 0 (0.0) | 0 (0.0) | 0 (0.0) | 0 (0.0) |
| Rapes (per 100,000) | 1 (4.8) | 2 (9.9) | 2 (9.8) | 1 (4.9) | 0 (0.0) | 1 (4.8) | 7 (33.7) | 0 (0.0) | 1 (4.9) | 2 (9.8) | 2 (9.9) | 3 (15.0) | 2 (10.2) |
| Robberies (per 100,000) | 9 (43.5) | 7 (34.6) | 3 (14.6) | 4 (19.4) | 3 (14.6) | 4 (19.4) | 6 (28.9) | 5 (24.2) | 6 (29.3) | 4 (19.6) | 6 (29.7) | 4 (20.0) | 6 (30.5) |
| Assaults (per 100,000) | 10 (48.3) | 12 (59.3) | 9 (43.9) | 7 (34.0) | 9 (43.7) | 13 (63.0) | 6 (28.9) | 8 (38.7) | 9 (43.9) | 7 (34.3) | 7 (34.6) | 7 (35.0) | 16 (81.3) |
| Burglaries (per 100,000) | 102 (492.6) | 95 (469.2) | 94 (458.9) | 129 (626.7) | 96 (466.7) | 121 (586.6) | 106 (510.5) | 95 (459.8) | 105 (512.7) | 86 (420.8) | 114 (563.7) | 72 (360.3) | 106 (538.6) |
| Thefts (per 100,000) | 266 (1,285) | 238 (1,176) | 243 (1,186) | 179 (869.6) | 196 (952.8) | 177 (858.1) | 169 (813.9) | 194 (939.1) | 162 (791.0) | 231 (1,130) | 198 (979.1) | 170 (850.8) | 245 (1,245) |
| Auto thefts (per 100,000) | 17 (82.1) | 13 (64.2) | 12 (58.6) | 16 (77.7) | 11 (53.5) | 8 (38.8) | 12 (57.8) | 14 (67.8) | 20 (97.7) | 13 (63.6) | 11 (54.4) | 20 (100.1) | 6 (30.5) |
| Arson (per 100,000) | 9 (43.5) | 4 (19.8) | 2 (9.8) | 2 (9.7) | 1 (4.9) | 3 (14.5) | 0 (0.0) | 1 (4.8) | 0 (0.0) | 0 (0.0) | 0 (0.0) | 3 (15.0) | 2 (10.2) |
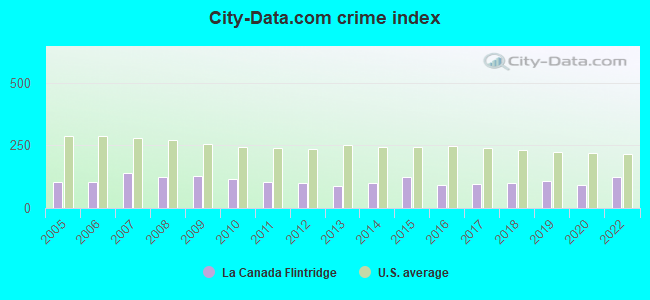
| City-Data.com crime index | 128.7 | 115.1 | 105.3 | 101.4 | 88.2 | 100.8 | 124.0 | 90.2 | 96.8 | 100.3 | 106.7 | 92.3 | 123.5 |
The City-Data.com crime index weighs serious crimes and violent crimes more heavily. Higher means more crime, U.S. average is 246.1. It adjusts for the number of visitors and daily workers commuting into cities.
Crime rate in La Canada Flintridge detailed stats: murders, rapes, robberies, assaults, burglaries, thefts, arson
Full-time law enforcement employees in 2015, including police officers: 1 (1 officers - 1 male; 0 female).
| Officers per 1,000 residents here: | 0.05 |
| California average: | 1.98 |
 Recent articles from our blog. Our writers, many of them Ph.D. graduates or candidates, create easy-to-read articles on a wide variety of topics.

 | Possible relocation to Pasadena area from East Coast (NJ)- Any Advice? (61 replies) |
| Danville vs. Lafayette vs. San Ramon (36 replies) |
| Your nicest experiences in La Canada Flintridge. (8 replies) |
| Where's the grass, trees, and suburbs in LA? (71 replies) |
| Best public elementary school within 20-25 miles from downtown LA (4 replies) |
| Why is Arcadia, CA so unfriendly? (121 replies) |
Latest news from La Canada Flintridge, CA collected exclusively by city-data.com from local newspapers, TV, and radio stations
Ancestries: Armenian (9.3%), English (4.1%), Italian (3.8%), European (3.6%), German (3.2%), American (2.5%).
Current Local Time: PST time zone
Elevation: 1193 feet
Land area: 8.65 square miles.
Population density: 2,283 people per square mile (low).
5,013 residents are foreign born (17.9% Asia, 2.6% Europe, 2.5% Latin America).
| This city: | 25.1% |
| California: | 26.5% |
Median real estate property taxes paid for housing units with mortgages in 2022: $10,281 (0.5%)
Median real estate property taxes paid for housing units with no mortgage in 2022: $8,306 (0.5%)
Nearest city with pop. 50,000+: Glendale, CA  (3.8 miles , pop. 194,973).
Nearest city with pop. 200,000+: Southwest San Gabriel Valley, CA (11.0 miles , pop. 320,008).
Nearest city with pop. 1,000,000+: Los Angeles, CA (13.1 miles , pop. 3,694,820).
Nearest cities:
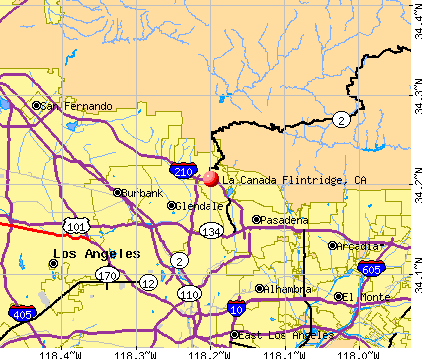
)Latitude: 34.21 N, Longitude: 118.20 W
Daytime population change due to commuting: -183 (-0.9%)
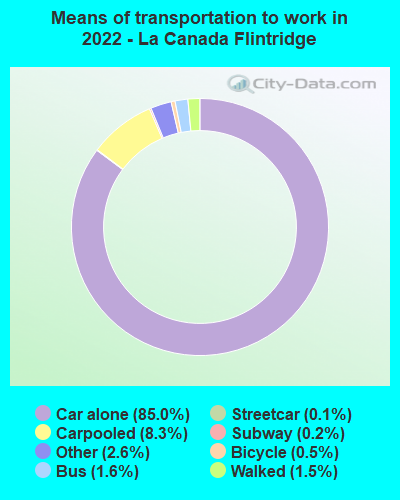
Workers who live and work in this city: 3,014 (35.1%)
Area code commonly used in this area: 818
Property values in La Canada Flintridge, CA
La Canada Flintridge tourist attractions:
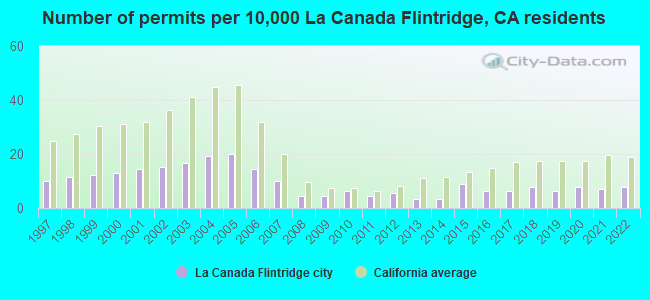
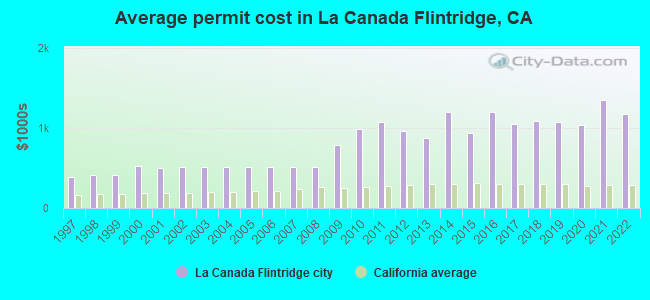
Single-family new house construction building permits:
- 2022: 16 buildings, average cost: $1,179,000
- 2021: 14 buildings, average cost: $1,350,600
- 2020: 16 buildings, average cost: $1,032,300
- 2019: 13 buildings, average cost: $1,069,900
- 2018: 16 buildings, average cost: $1,083,500
- 2017: 13 buildings, average cost: $1,046,800
- 2016: 13 buildings, average cost: $1,197,000
- 2015: 18 buildings, average cost: $943,100
- 2014: 7 buildings, average cost: $1,201,200
- 2013: 7 buildings, average cost: $874,300
- 2012: 11 buildings, average cost: $958,500
- 2011: 9 buildings, average cost: $1,073,400
- 2010: 13 buildings, average cost: $993,300
- 2009: 9 buildings, average cost: $789,500
- 2008: 9 buildings, average cost: $509,700
- 2007: 20 buildings, average cost: $509,700
- 2006: 29 buildings, average cost: $509,700
- 2005: 41 buildings, average cost: $509,700
- 2004: 39 buildings, average cost: $509,700
- 2003: 34 buildings, average cost: $509,500
- 2002: 31 buildings, average cost: $510,600
- 2001: 29 buildings, average cost: $505,400
- 2000: 26 buildings, average cost: $528,500
- 1999: 25 buildings, average cost: $406,800
- 1998: 23 buildings, average cost: $412,300
- 1997: 20 buildings, average cost: $392,800
| Here: | 5.0% |
| California: | 5.1% |

- Professional, scientific, technical services (18.0%)
- Health care (11.2%)
- Educational services (11.2%)
- Finance & insurance (8.6%)
- Construction (3.9%)
- Real estate & rental & leasing (3.8%)
- Public administration (3.7%)
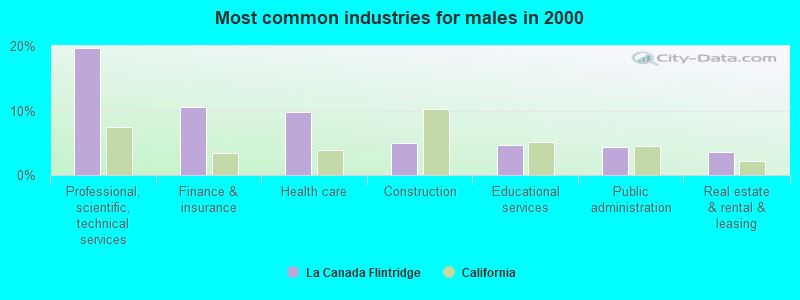
- Professional, scientific, technical services (19.7%)
- Finance & insurance (10.6%)
- Health care (9.8%)
- Construction (5.0%)
- Educational services (4.7%)
- Public administration (4.3%)
- Real estate & rental & leasing (3.6%)
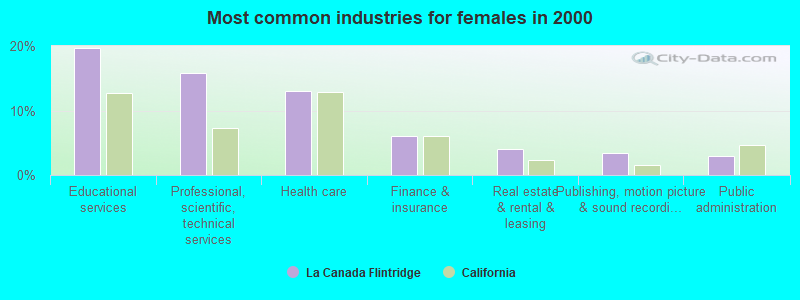
- Educational services (19.7%)
- Professional, scientific, technical services (15.8%)
- Health care (13.0%)
- Finance & insurance (6.1%)
- Real estate & rental & leasing (4.0%)
- Publishing, motion picture & sound recording industries (3.4%)
- Public administration (3.0%)
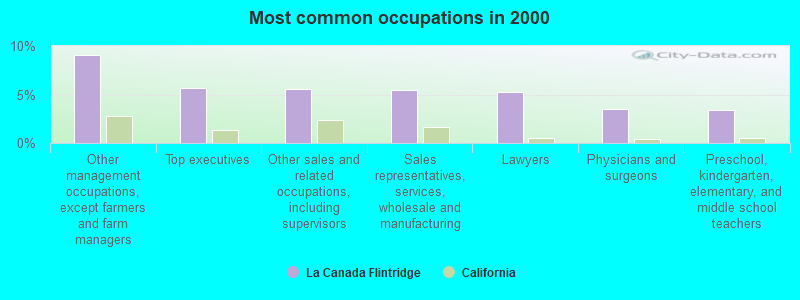
- Other management occupations, except farmers and farm managers (9.1%)
- Top executives (5.6%)
- Other sales and related occupations, including supervisors (5.6%)
- Sales representatives, services, wholesale and manufacturing (5.5%)
- Lawyers (5.2%)
- Physicians and surgeons (3.5%)
- Preschool, kindergarten, elementary, and middle school teachers (3.4%)
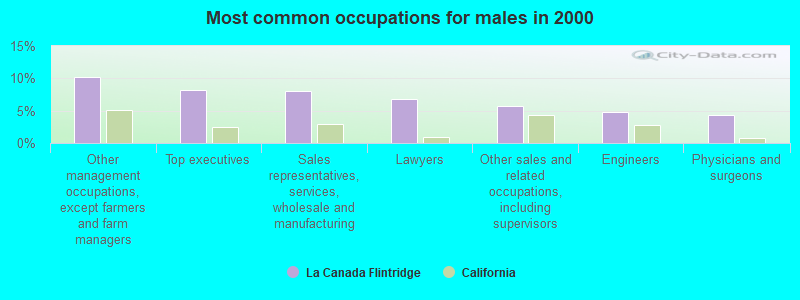
- Other management occupations, except farmers and farm managers (10.1%)
- Top executives (8.2%)
- Sales representatives, services, wholesale and manufacturing (8.0%)
- Lawyers (6.8%)
- Other sales and related occupations, including supervisors (5.7%)
- Engineers (4.8%)
- Physicians and surgeons (4.4%)
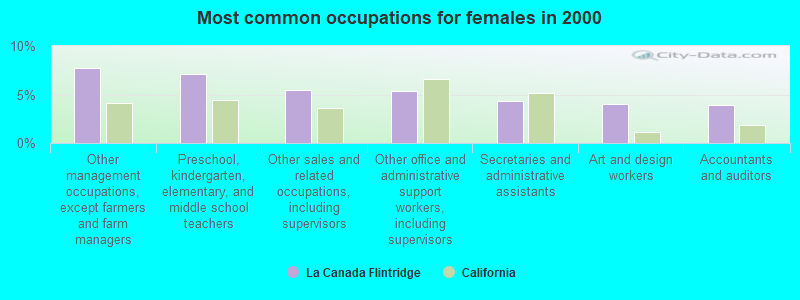
- Other management occupations, except farmers and farm managers (7.8%)
- Preschool, kindergarten, elementary, and middle school teachers (7.1%)
- Other sales and related occupations, including supervisors (5.4%)
- Other office and administrative support workers, including supervisors (5.4%)
- Secretaries and administrative assistants (4.3%)
- Art and design workers (4.0%)
- Accountants and auditors (3.9%)
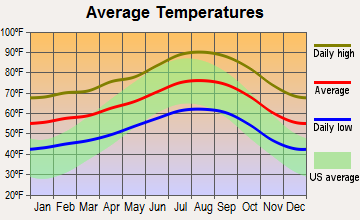
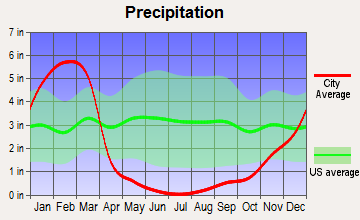
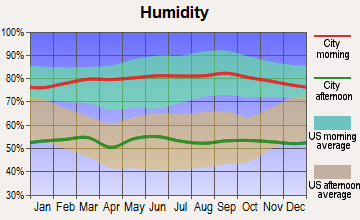
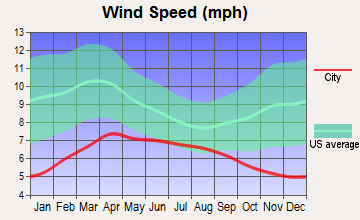
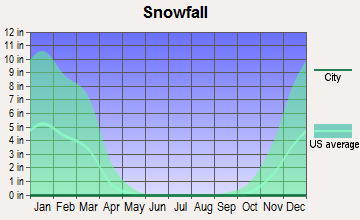
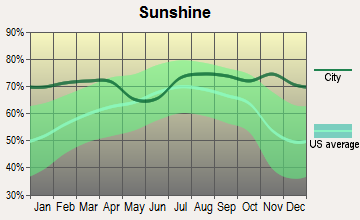
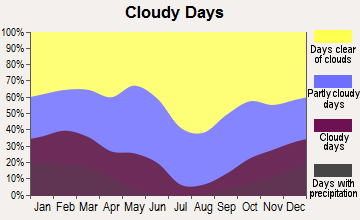
Average climate in La Canada Flintridge, California
Based on data reported by over 4,000 weather stations
(lower is better)
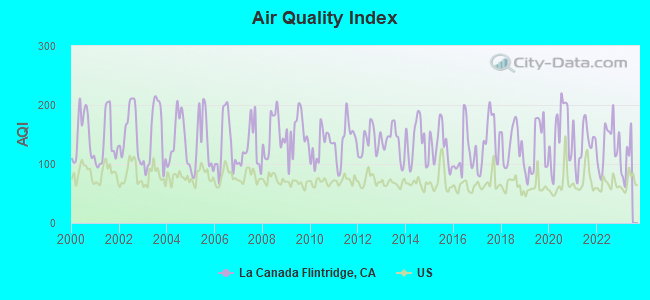
Air Quality Index (AQI) level in 2022 was 132. This is significantly worse than average.
| City: | 132 |
| U.S.: | 73 |
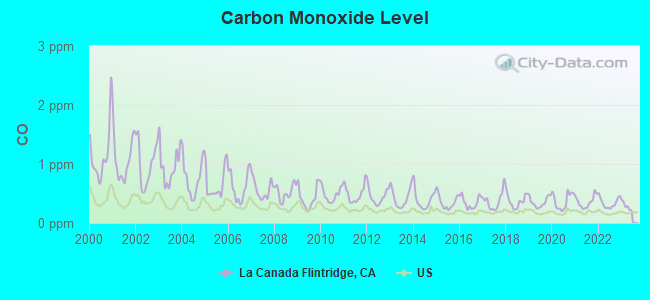
Carbon Monoxide (CO) [ppm] level in 2022 was 0.341. This is worse than average. Closest monitor was 5.2 miles away from the city center.
| City: | 0.341 |
| U.S.: | 0.251 |
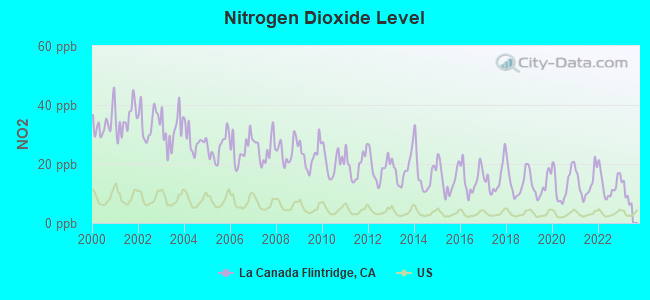
Nitrogen Dioxide (NO2) [ppb] level in 2022 was 13.0. This is significantly worse than average. Closest monitor was 4.9 miles away from the city center.
| City: | 13.0 |
| U.S.: | 5.1 |
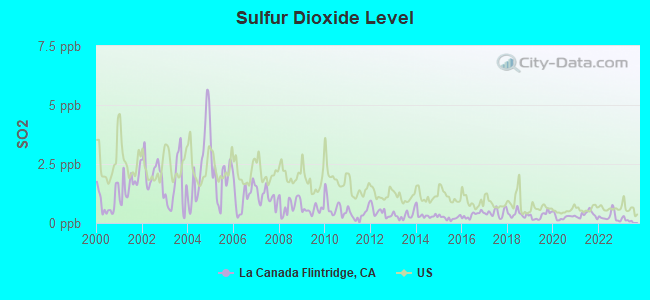
Sulfur Dioxide (SO2) [ppb] level in 2022 was 0.266. This is significantly better than average. Closest monitor was 4.9 miles away from the city center.
| City: | 0.266 |
| U.S.: | 1.515 |
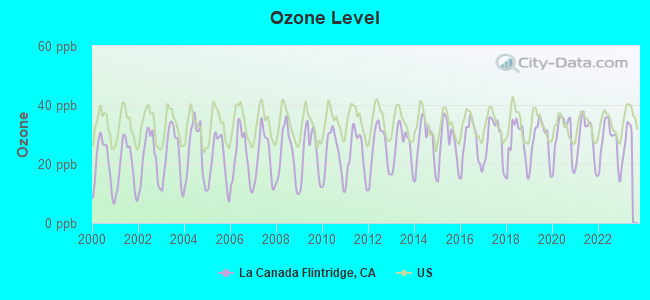
Ozone [ppb] level in 2022 was 27.3. This is better than average. Closest monitor was 3.0 miles away from the city center.
| City: | 27.3 |
| U.S.: | 33.3 |
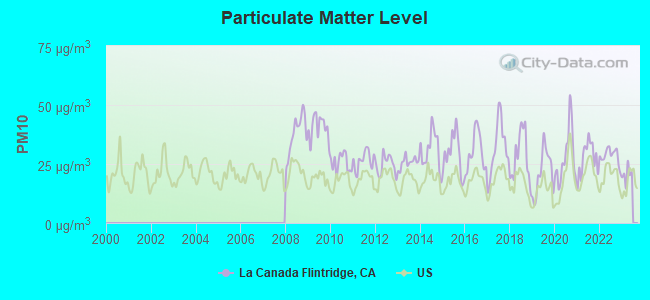
Particulate Matter (PM10) [µg/m3] level in 2022 was 28.5. This is significantly worse than average. Closest monitor was 7.0 miles away from the city center.
| City: | 28.5 |
| U.S.: | 19.2 |
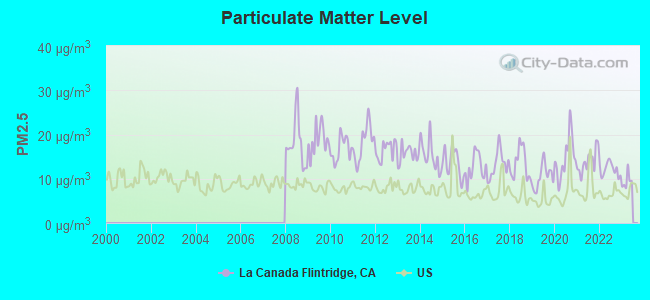
Particulate Matter (PM2.5) [µg/m3] level in 2022 was 12.1. This is significantly worse than average. Closest monitor was 6.6 miles away from the city center.
| City: | 12.1 |
| U.S.: | 8.1 |
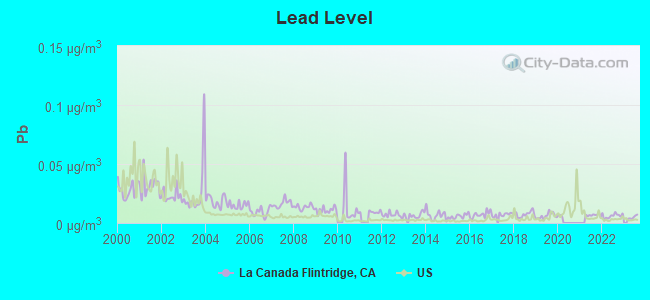
Lead (Pb) [µg/m3] level in 2022 was 0.00607. This is significantly better than average. Closest monitor was 4.9 miles away from the city center.
| City: | 0.00607 |
| U.S.: | 0.00931 |
Earthquake activity:
La Canada Flintridge-area historical earthquake activity is significantly above California state average. It is 7185% greater than the overall U.S. average.On 7/21/1952 at 11:52:14, a magnitude 7.7 (7.7 UK, Class: Major, Intensity: VIII - XII) earthquake occurred 71.4 miles away from the city center, causing $50,000,000 total damage
On 6/28/1992 at 11:57:34, a magnitude 7.6 (6.2 MB, 7.6 MS, 7.3 MW, Depth: 0.7 mi) earthquake occurred 95.4 miles away from the city center, causing 3 deaths (1 shaking deaths, 2 other deaths) and 400 injuries, causing $100,000,000 total damage and $40,000,000 insured losses
On 10/16/1999 at 09:46:44, a magnitude 7.4 (6.3 MB, 7.4 MS, 7.2 MW, 7.3 ML) earthquake occurred 103.0 miles away from the city center
On 11/4/1927 at 13:51:53, a magnitude 7.5 (7.5 UK) earthquake occurred 168.6 miles away from La Canada Flintridge center
On 1/17/1994 at 12:30:55, a magnitude 6.8 (6.4 MB, 6.8 MS, 6.7 MW, Depth: 11.4 mi, Class: Strong, Intensity: VII - IX) earthquake occurred 21.8 miles away from La Canada Flintridge center, causing 60 deaths (60 shaking deaths) and 7000 injuries
On 4/21/1918 at 22:32:30, a magnitude 6.8 (6.8 UK) earthquake occurred 51.4 miles away from the city center
Magnitude types: body-wave magnitude (MB), local magnitude (ML), surface-wave magnitude (MS), moment magnitude (MW)
Natural disasters:
The number of natural disasters in Los Angeles County (57) is a lot greater than the US average (15).Major Disasters (Presidential) Declared: 27
Emergencies Declared: 3
Causes of natural disasters: Fires: 37, Floods: 16, Storms: 9, Winter Storms: 6, Landslides: 5, Mudslides: 5, Earthquakes: 3, Freeze: 1, Heavy Rain: 1, Hurricane: 1, Snow: 1, Tornado: 1, Wind: 1, Other: 1 (Note: some incidents may be assigned to more than one category).
Hospitals and medical centers near La Canada Flintridge:
- KIDNEY DIALYSIS CENTER OF VERDUGO HILLS (Dialysis Facility, about 1 miles away; GLENDALE, CA)
- USC VERDUGO HILLS HOSPITAL Acute Care Hospitals (about 1 miles away; GLENDALE, CA)
- MONTROSE HEALTHCARE CENTER (Nursing Home, about 2 miles away; MONTROSE, CA)
- GOLDEN HEART HOME HEALTH CARE (Home Health Center, about 2 miles away; GLENDALE, CA)
- ADVANCE HEALTHLINK, INC (Home Health Center, about 2 miles away; MONTROSE, CA)
- ANGELS OF THE VALLEY HOSPICE CARE, LLC (Hospital, about 2 miles away; MONTROSE, CA)
- VERDUGO VALLEY SKILLED NURSING AND WELLNESS CT (Nursing Home, about 3 miles away; MONTROSE, CA)
Amtrak stations near La Canada Flintridge:
- 5 miles: LA CRESCENTA (PARK & RIDE LOT (STREET), I-210 AT LOWEL) - Bus Station
- 6 miles: PASADENA (150 S. ROBLES AVE.) - Bus Station . Services: fully wheelchair accessible, enclosed waiting area, public restrooms, public payphones, full-service food facilities, paid short-term parking, paid long-term parking, taxi stand, public transit connection.
- 7 miles: GLENDALE (400 W. CERRITOS AVE.) . Services: fully wheelchair accessible, public payphones, free short-term parking, free long-term parking, call for taxi service, intercity bus service, public transit connection.
Colleges/universities with over 2000 students nearest to La Canada Flintridge:
- Art Center College of Design (about 3 miles; Pasadena, CA; Full-time enrollment: 2,346)
- Glendale Community College (about 4 miles; Glendale, CA; FT enrollment: 11,348)
- Le Cordon Bleu College of Culinary Arts-Pasadena (about 6 miles; Pasadena, CA; FT enrollment: 2,934)
- Occidental College (about 6 miles; Los Angeles, CA; FT enrollment: 2,276)
- California Institute of Technology (about 7 miles; Pasadena, CA; FT enrollment: 2,246)
- Pasadena City College (about 7 miles; Pasadena, CA; FT enrollment: 14,712)
- Los Angeles City College (about 10 miles; Los Angeles, CA; FT enrollment: 10,027)
Private high schools in La Canada Flintridge:
- ST FRANCIS HIGH SCHOOL (Students: 658, Location: 200 FOOTHILL BLVD, Grades: 9-12, Boys only)
- FLINTRIDGE SACRED HEART ACADEMY (Students: 410, Location: 440 SAINT KATHERINE DR, Grades: 9-12, Girls only)
- THE HILLSIDE SCHOOL & LEARNING CENTER (Students: 48, Location: 4331 OAK GROVE DR, Grades: 7-12)
- PINEWOOD ACADEMY OF LITERACY (Students: 15, Location: 4490 CORNISHON AVENUE STE 3, Grades: 1-12)
Private elementary/middle schools in La Canada Flintridge:
- LA CANADA PREPARATORY SCHOOL (Students: 404, Location: 4490 CORNISHON AVE, Grades: PK-8)
- LEARNING CASTLE (Students: 370, Location: 4490 CORNISHON AVE # 5, Grades: KG-8)
- ST BEDE THE VENERABLE ELEMENTARY (Students: 262, Location: 4524 CROWN AVE, Grades: KG-8)
- CRESTVIEW PREPARATORY SCHOOL (Students: 234, Location: 140 FOOTHILL BLVD, Grades: KG-6)
- FOOTHILL PROGRESSIVE MONTESSORI SCHOOL (Students: 70, Location: 4526 INDIANOLA WAY, Grades: KG-8)
User-submitted facts and corrections:
- Closest medical facility Verdugo Hills Hospital Verdugo Blvd. Glendale 1 mile from La Canada Flintridge
Points of interest:
Notable locations in La Canada Flintridge: La Canada Water Reclamation Plant (A), California Institute of Technology - Jet Propulsion Laboratory (B), La Canada Country Club (C), La Canada Flintridge Branch Los Angeles County Public Library (D), NASA Jet Propulsion Lab Fire Department (E), Los Angeles County Fire Department Station 82 (F), Los Angeles County Fire Department Station 19 (G). Display/hide their locations on the map
Shopping Center: Plaza De La Canada Shopping Center (1). Display/hide its location on the map
Churches in La Canada Flintridge include: Church of the Lighted Window (A), La Canada Presbyterian Church (B), La Canada United Methodist Church (C), Lutheran Church In The Foothills (D), Saint Bede The Venerable Church (E), Saint George's Episcopal Church (F). Display/hide their locations on the map
Parks in La Canada Flintridge include: Friedman Field (1), Descanso Gardens (2), Glenhaven Park (3), Memorial Park (4). Display/hide their locations on the map
Tourist attraction: Descanso Gardens Development (Cultural Attractions- Events- & Facilities; 1418 Descanso Drive).
| This city: | 3.0 people |
| California: | 2.9 people |
| This city: | 84.2% |
| Whole state: | 68.7% |
| This city: | 2.0% |
| Whole state: | 7.2% |
Likely homosexual households (counted as self-reported same-sex unmarried-partner households)
- Lesbian couples: 0.3% of all households
- Gay men: 0.2% of all households
People in group quarters in La Canada Flintridge in 2010:
- 18 people in other noninstitutional facilities
- 6 people in nursing facilities/skilled-nursing facilities
- 3 people in workers' group living quarters and job corps centers
People in group quarters in La Canada Flintridge in 2000:
- 128 people in college dormitories (includes college quarters off campus)
- 43 people in religious group quarters
- 18 people in nursing homes
Banks with branches in La Canada Flintridge (2011 data):
- Citibank, National Association: La Canada Branch at 742 Foothill Boulevard, branch established on 1995/10/09. Info updated 2012/01/10: Bank assets: $1,288,658.0 mil, Deposits: $882,541.0 mil, headquarters in Sioux Falls, SD, positive income, International Specialization, 1048 total offices, Holding Company: Citigroup Inc.
- Bank of America, National Association: La Canada Flint Ridge Branch at 537 Foothill Blvd, branch established on 1953/05/04. Info updated 2009/11/18: Bank assets: $1,451,969.3 mil, Deposits: $1,077,176.8 mil, headquarters in Charlotte, NC, positive income, 5782 total offices, Holding Company: Bank Of America Corporation
For population 15 years and over in La Canada Flintridge:
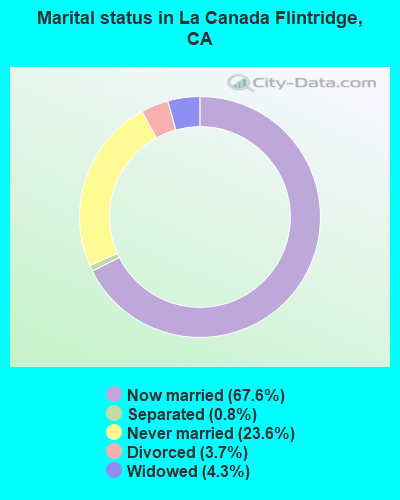
- Never married: 23.6%
- Now married: 67.6%
- Separated: 0.8%
- Widowed: 4.3%
- Divorced: 3.7%
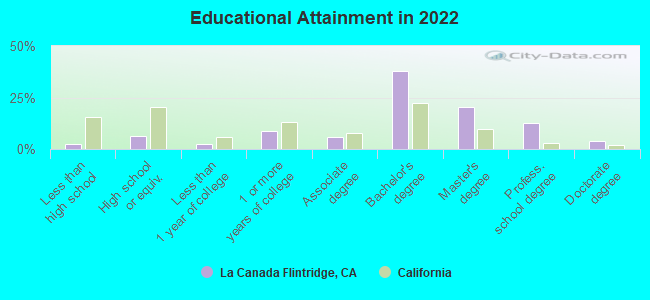
For population 25 years and over in La Canada Flintridge:
- High school or higher: 97.6%
- Bachelor's degree or higher: 73.8%
- Graduate or professional degree: 35.8%
- Unemployed: 3.5%
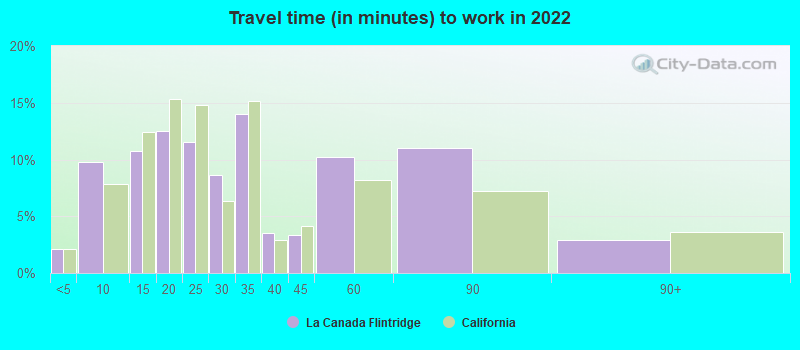
- Mean travel time to work (commute): 20.5 minutes
| Here: | 9.3 |
| California average: | 15.5 |


Graphs represent county-level data. Detailed 2008 Election Results
Political contributions by individuals in La Canada Flintridge, CA
Neighborhoods in La Canada Flintridge:
(La Canada Flintridge, California Neighborhood Map)Religion statistics for La Canada Flintridge, CA (based on Los Angeles County data)


| Religion | Adherents | Congregations |
|---|---|---|
| Catholic | 3,542,994 | 275 |
| Evangelical Protestant | 814,611 | 3,249 |
| Other | 451,594 | 1,023 |
| Mainline Protestant | 229,056 | 860 |
| Black Protestant | 112,338 | 290 |
| Orthodox | 63,517 | 76 |
| None | 4,604,495 | - |
Food Environment Statistics:
| Los Angeles County: | 2.12 / 10,000 pop. |
| California: | 2.14 / 10,000 pop. |
| Los Angeles County: | 0.03 / 10,000 pop. |
| State: | 0.04 / 10,000 pop. |
| Los Angeles County: | 0.58 / 10,000 pop. |
| California: | 0.62 / 10,000 pop. |
| This county: | 1.23 / 10,000 pop. |
| State: | 1.49 / 10,000 pop. |
| Los Angeles County: | 7.15 / 10,000 pop. |
| California: | 7.42 / 10,000 pop. |
| Here: | 7.5% |
| State: | 7.3% |
| Los Angeles County: | 20.4% |
| California: | 21.3% |
| This county: | 18.6% |
| California: | 17.9% |
Health and Nutrition:
| This city: | 59.1% |
| California: | 49.4% |
| This city: | 58.4% |
| California: | 48.0% |
| This city: | 27.4 |
| California: | 28.1 |
| This city: | 15.7% |
| State: | 20.2% |
| This city: | 10.6% |
| California: | 11.2% |
| La Canada Flintridge: | 7.0 |
| State: | 6.8 |
| La Canada Flintridge: | 33.2% |
| California: | 31.5% |
| This city: | 63.0% |
| California: | 56.4% |
| This city: | 80.9% |
| California: | 80.9% |
More about Health and Nutrition of La Canada Flintridge, CA Residents
| Local government employment and payroll (March 2022) | |||||
| Function | Full-time employees | Monthly full-time payroll | Average yearly full-time wage | Part-time employees | Monthly part-time payroll |
|---|---|---|---|---|---|
| Other Government Administration | 12 | $116,466 | $116,466 | 11 | $10,043 |
| Financial Administration | 7 | $57,810 | $99,103 | 2 | $3,531 |
| Streets and Highways | 5 | $56,399 | $135,358 | 0 | $0 |
| Other and Unallocable | 4 | $23,720 | $71,160 | 0 | $0 |
| Parks and Recreation | 0 | $0 | 4 | $7,293 | |
| Totals for Government | 28 | $254,395 | $109,026 | 17 | $20,868 |
La Canada Flintridge government finances - Expenditure in 2017 (per resident):
- Construction - Regular Highways: $2,414,000 ($122.22)
Protective Inspection and Regulation - Other: $588,000 ($29.77)
- Current Operations - Central Staff Services: $5,440,000 ($275.42)
Police Protection: $3,414,000 ($172.84)
Regular Highways: $2,577,000 ($130.47)
Parks and Recreation: $2,153,000 ($109.00)
Financial Administration: $658,000 ($33.31)
Transit Utilities: $148,000 ($7.49)
Sewerage: $78,000 ($3.95)
Solid Waste Management: $50,000 ($2.53)
Housing and Community Development: $39,000 ($1.97)
- General - Interest on Debt: $576,000 ($29.16)
- Intergovernmental to Local - Other - Police Protection: $2,847,000 ($144.14)
Other - General - Other: $725,000 ($36.71)
Other - Protective Inspection and Regulations: $526,000 ($26.63)
Other - Elementary and Secondary Education: $188,000 ($9.52)
- Other Capital Outlay - Parks and Recreation: $102,000 ($5.16)
Central Staff Services: $86,000 ($4.35)
Police Protection: $14,000 ($0.71)
Solid Waste Management: $2,000 ($0.10)
La Canada Flintridge government finances - Revenue in 2017 (per resident):
- Charges - Other: $4,199,000 ($212.59)
Sewerage: $101,000 ($5.11)
- Federal Intergovernmental - Other: $309,000 ($15.64)
Housing and Community Development: $61,000 ($3.09)
- Miscellaneous - Rents: $212,000 ($10.73)
Fines and Forfeits: $116,000 ($5.87)
General Revenue - Other: $99,000 ($5.01)
- State Intergovernmental - Highways: $394,000 ($19.95)
Other: $319,000 ($16.15)
General Local Government Support: $30,000 ($1.52)
- Tax - Property: $7,477,000 ($378.54)
General Sales and Gross Receipts: $4,366,000 ($221.04)
Other License: $2,377,000 ($120.34)
Public Utilities Sales: $604,000 ($30.58)
Documentary and Stock Transfer: $315,000 ($15.95)
Occupation and Business License - Other: $200,000 ($10.13)
La Canada Flintridge government finances - Debt in 2017 (per resident):
- Long Term Debt - Outstanding Unspecified Public Purpose: $29,570,000 ($1497.06)
Beginning Outstanding - Unspecified Public Purpose: $26,418,000 ($1337.48)
Issue, Unspecified Public Purpose: $5,580,000 ($282.50)
Retired Unspecified Public Purpose: $2,428,000 ($122.92)
La Canada Flintridge government finances - Cash and Securities in 2017 (per resident):
- Bond Funds - Cash and Securities: $2,746,000 ($139.02)
- Other Funds - Cash and Securities: $17,238,000 ($872.72)
- Sinking Funds - Cash and Securities: $12,169,000 ($616.09)
2.98% of this county's 2021 resident taxpayers lived in other counties in 2020 ($81,235 average adjusted gross income)
| Here: | 2.98% |
| California average: | 5.19% |
0.01% of residents moved from foreign countries ($155 average AGI)
Los Angeles County: 0.01% California average: 0.03%
Top counties from which taxpayers relocated into this county between 2020 and 2021:
| from Orange County, CA | |
| from San Bernardino County, CA | |
| from Riverside County, CA |
4.68% of this county's 2020 resident taxpayers moved to other counties in 2021 ($97,324 average adjusted gross income)
| Here: | 4.68% |
| California average: | 6.14% |
0.01% of residents moved to foreign countries ($196 average AGI)
Los Angeles County: 0.01% California average: 0.02%
Top counties to which taxpayers relocated from this county between 2020 and 2021:
| to Orange County, CA | |
| to San Bernardino County, CA | |
| to Riverside County, CA |
| Businesses in La Canada Flintridge, CA | ||||
| Name | Count | Name | Count | |
|---|---|---|---|---|
| FedEx | 2 | Rite Aid | 1 | |
| KFC | 1 | Taco Bell | 1 | |
| McDonald's | 1 | UPS | 1 | |
| Pier 1 Imports | 1 | YMCA | 2 | |
| Pizza Hut | 1 | |||
Strongest AM radio stations in La Canada Flintridge:
- KRLA (870 AM; 20 kW; GLENDALE, CA; Owner: NEW INSPIRATION BROADCASTING COMPANY)
- KFWB (980 AM; 50 kW; LOS ANGELES, CA; Owner: INFINITY BROADCASTING OPERATIONS, INC.)
- KLAC (570 AM; 50 kW; LOS ANGELES, CA; Owner: AMFM RADIO LICENSES, L.L.C.)
- KSPN (710 AM; 50 kW; LOS ANGELES, CA; Owner: KABC-AM RADIO, INC.)
- KMPC (1540 AM; 50 kW; LOS ANGELES, CA; Owner: ROSE CITY RADIO CORPORATION)
- KBLA (1580 AM; 50 kW; SANTA MONICA, CA)
- KXMX (1190 AM; 25 kW; ANAHEIM, CA; Owner: NEW INSPIRATION BROADCASTING COMPANY)
- KDIS (1110 AM; 50 kW; PASADENA, CA; Owner: ABC,INC.)
- KTNQ (1020 AM; 50 kW; LOS ANGELES, CA; Owner: KTNQ-AM LICENSE CORP.)
- KXTA (1150 AM; 50 kW; LOS ANGELES, CA; Owner: CITICASTERS LICENSES, L.P.)
- KFI (640 AM; 50 kW; LOS ANGELES, CA; Owner: CAPSTAR TX LIMITED PARTNERSHIP)
- KSUR (1260 AM; 25 kW; BEVERLY HILLS, CA)
- KNX (1070 AM; 50 kW; LOS ANGELES, CA; Owner: INFINITY BROADCASTING OPERATIONS, INC.)
Strongest FM radio stations in La Canada Flintridge:
- KZLA-FM (93.9 FM; LOS ANGELES, CA; Owner: EMMIS RADIO LICENSE CORPORATION)
- KPWR (105.9 FM; LOS ANGELES, CA; Owner: EMMIS RADIO LICENSE CORPORATION)
- KLSX (97.1 FM; LOS ANGELES, CA; Owner: INFINITY BROADCASTING OPERATIONS, INC.)
- KUSC (91.5 FM; LOS ANGELES, CA; Owner: UNIVERSITY OF SOUTHERN CALIFORNIA)
- KKLA-FM (99.5 FM; LOS ANGELES, CA; Owner: NEW INSPIRATION BROADCASTING CO., INC.)
- KRTH-FM (101.1 FM; LOS ANGELES, CA; Owner: INFINITY BROADCASTING OPERATIONS, INC.)
- KROQ-FM (106.7 FM; PASADENA, CA; Owner: INFINITY BROADCASTING CORP. OF LOS ANGELES)
- KCBS-FM (93.1 FM; LOS ANGELES, CA; Owner: INFINITY BROADCASTING OPERATIONS, INC.)
- K212FA (90.3 FM; TEMPLE CITY, CA; Owner: EDUCATIONAL MEDIA FOUNDATION)
- KLOS (95.5 FM; LOS ANGELES, CA; Owner: KLOS-FM RADIO, INC.)
- KSCA (101.9 FM; GLENDALE, CA; Owner: HBC LICENSE CORPORATION)
- KOST (103.5 FM; LOS ANGELES, CA; Owner: CAPSTAR TX LIMITED PARTNERSHIP)
- KLVE (107.5 FM; LOS ANGELES, CA; Owner: KLVE-FM LICENSE CORP.)
- KIIS-FM (102.7 FM; LOS ANGELES, CA; Owner: CITICASTERS LICENSES, L.P.)
- KPCC (89.3 FM; PASADENA, CA; Owner: PASADENA AREA COMMUNITY COLLEGE DISTRICT)
- KMZT-FM (105.1 FM; LOS ANGELES, CA; Owner: MOUNT WILSON FM BROADCASTERS, INC.)
- KBIG-FM (104.3 FM; LOS ANGELES, CA; Owner: AMFM RADIO LICENSES, L.L.C.)
- KHHT (92.3 FM; LOS ANGELES, CA; Owner: AMFM RADIO LICENSES, L.L.C.)
- KPFK (90.7 FM; LOS ANGELES, CA; Owner: PACIFICA FOUNDATION, INC)
- K216EM (91.1 FM; ARCADIA, CA; Owner: LIFE ON THE WAY COMMUNICATIONS, INC.)
TV broadcast stations around La Canada Flintridge:
- KCBS-TV (Channel 2; LOS ANGELES, CA; Owner: CBS BROADCASTING INC.)
- KTLA-TV (Channel 5; LOS ANGELES, CA; Owner: KTLA INC.)
- KABC-TV (Channel 7; LOS ANGELES, CA; Owner: ABC HOLDING COMPANY, INC.)
- KCAL-TV (Channel 9; LOS ANGELES, CA; Owner: VIACOM TELEVISION STATIONS GROUP OF LOS ANGELES LLC)
- KNBC (Channel 4; LOS ANGELES, CA; Owner: NBC SUBSIDIARY (KNBC-TV), INC.)
- KTRO-LP (Channel 50; LANCASTER, CA; Owner: ROBERT D. ADELMAN)
- KMEX-TV (Channel 34; LOS ANGELES, CA; Owner: KMEX LICENSE PARTNERSHIP, G.P.)
- KAZA-TV (Channel 54; AVALON, CA; Owner: PAPPAS SOUTHERN CALIFORNIA LICENSE LLC)
- KDOC-TV (Channel 56; ANAHEIM, CA; Owner: GOLDEN ORANGE BROADCASTING CO., INC.)
- KOCE-TV (Channel 50; HUNTINGTON BEACH, CA; Owner: BD. OF TRUSTEES, COAST COMMUNITY COLLEGE DIST.)
- KXLA (Channel 44; RANCHO PALOS VERDES, CA; Owner: RANCHO PALOS VERDES BROADCASTERS, INC.)
- KSCI (Channel 18; LONG BEACH, CA; Owner: KSLS, INC.)
- KFTR (Channel 46; ONTARIO, CA; Owner: TELEFUTURA LOS ANGELES LLC)
- KCET (Channel 28; LOS ANGELES, CA; Owner: COMMUNITY TELEVISION OF SOUTHERN CALIFORNIA)
- KTTV (Channel 11; LOS ANGELES, CA; Owner: FOX TELEVISION STATIONS, INC.)
- KWHY-TV (Channel 22; LOS ANGELES, CA; Owner: TELEMUNDO OF LOS ANGELES LICENSE CORPORATION)
- KVEA (Channel 52; CORONA, CA; Owner: ESTRELLA LICENSE CORPORATION)
- KCOP-TV (Channel 13; LOS ANGELES, CA; Owner: FOX TELEVISION STATIONS, INC.)
- KTBN-TV (Channel 40; SANTA ANA, CA; Owner: TRINITY BROADCASTING NETWORK, INC.)
- KLCS (Channel 58; LOS ANGELES, CA; Owner: LOS ANGELES UNIFIED SCHOOL DISTRICT)
- KSFV-LP (Channel 26; SAN FERNANDO VALLEY, CA; Owner: VENTURE TECHNOLOGIES GROUP, LLC)
- KHIZ (Channel 64; BARSTOW, CA; Owner: SUNBELT TELEVISION, INC.)
- KHTV-LP (Channel 48; INLAND EMPIRE, CA; Owner: VENTURE TECHNOLOGIES GROUP, LLC)
- KLAU-LP (Channel 66; REDLANDS, CA; Owner: GERALD BENAVIDES)
- K38CY (Channel 38; VAN NUYS, CA; Owner: CAPITAL BROADCASTING CORPORATION)
- National Bridge Inventory (NBI) Statistics
- 36Number of bridges
- 663ft / 202mTotal length
- 1,793,401Total average daily traffic
- 148,958Total average daily truck traffic
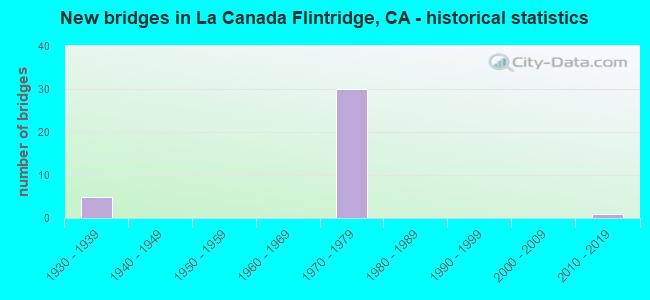
- New bridges - historical statistics
- 51930-1939
- 301970-1979
- 12010-2019
FCC Registered Commercial Land Mobile Towers: 1 (See the full list of FCC Registered Commercial Land Mobile Towers in La Canada Flintridge, CA)
FCC Registered Broadcast Land Mobile Towers: 17 (See the full list of FCC Registered Broadcast Land Mobile Towers)
FCC Registered Microwave Towers: 12 (See the full list of FCC Registered Microwave Towers in this town)
FCC Registered Maritime Coast & Aviation Ground Towers: 4 (See the full list of FCC Registered Maritime Coast & Aviation Ground Towers)
FCC Registered Amateur Radio Licenses: 111 (See the full list of FCC Registered Amateur Radio Licenses in La Canada Flintridge)
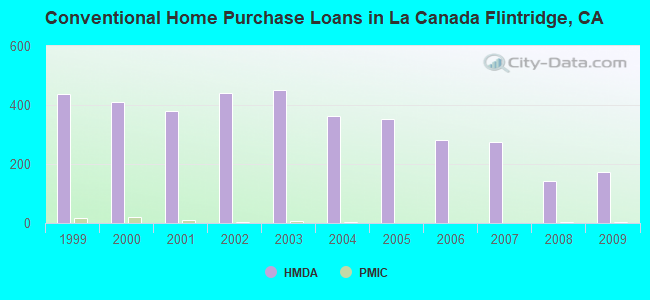
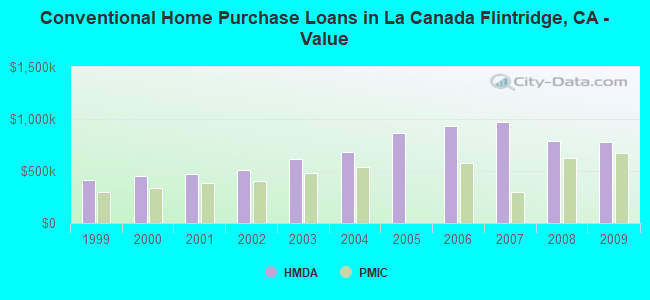
| Home Mortgage Disclosure Act Aggregated Statistics For Year 2009 (Based on 4 full and 1 partial tracts) | ||||||||||
| A) FHA, FSA/RHS & VA Home Purchase Loans | B) Conventional Home Purchase Loans | C) Refinancings | D) Home Improvement Loans | F) Non-occupant Loans on < 5 Family Dwellings (A B C & D) | ||||||
|---|---|---|---|---|---|---|---|---|---|---|
| Number | Average Value | Number | Average Value | Number | Average Value | Number | Average Value | Number | Average Value | |
| LOANS ORIGINATED | 5 | $681,400 | 174 | $777,723 | 861 | $503,001 | 39 | $309,355 | 22 | $648,069 |
| APPLICATIONS APPROVED, NOT ACCEPTED | 2 | $489,835 | 19 | $928,567 | 100 | $542,612 | 0 | $0 | 3 | $464,623 |
| APPLICATIONS DENIED | 2 | $509,865 | 32 | $873,356 | 184 | $636,582 | 5 | $545,794 | 9 | $344,717 |
| APPLICATIONS WITHDRAWN | 0 | $0 | 38 | $732,507 | 149 | $524,148 | 9 | $464,990 | 4 | $297,312 |
| FILES CLOSED FOR INCOMPLETENESS | 0 | $0 | 7 | $410,926 | 41 | $550,380 | 2 | $410,000 | 2 | $375,000 |
Detailed HMDA statistics for the following Tracts: 3005.02 , 4605.01, 4605.02, 4606.00, 4607.00
| Private Mortgage Insurance Companies Aggregated Statistics For Year 2009 (Based on 4 full and 1 partial tracts) | ||||
| A) Conventional Home Purchase Loans | B) Refinancings | |||
|---|---|---|---|---|
| Number | Average Value | Number | Average Value | |
| LOANS ORIGINATED | 2 | $674,540 | 0 | $0 |
| APPLICATIONS APPROVED, NOT ACCEPTED | 0 | $0 | 1 | $675,610 |
| APPLICATIONS DENIED | 0 | $0 | 0 | $0 |
| APPLICATIONS WITHDRAWN | 0 | $0 | 0 | $0 |
| FILES CLOSED FOR INCOMPLETENESS | 0 | $0 | 1 | $471,000 |
Detailed PMIC statistics for the following Tracts: 3005.02 , 4605.01, 4605.02, 4606.00, 4607.00
| Most common first names in La Canada Flintridge, CA among deceased individuals | ||
| Name | Count | Lived (average) |
|---|---|---|
| John | 130 | 78.0 years |
| Mary | 126 | 81.1 years |
| Robert | 110 | 75.9 years |
| William | 109 | 77.9 years |
| Helen | 79 | 83.0 years |
| Dorothy | 76 | 82.6 years |
| Charles | 69 | 80.6 years |
| Margaret | 66 | 82.9 years |
| James | 61 | 75.1 years |
| Elizabeth | 58 | 81.8 years |
| Most common last names in La Canada Flintridge, CA among deceased individuals | ||
| Last name | Count | Lived (average) |
|---|---|---|
| Smith | 46 | 77.9 years |
| Johnson | 31 | 80.5 years |
| Brown | 28 | 83.0 years |
| Anderson | 24 | 80.0 years |
| Miller | 24 | 79.7 years |
| Williams | 20 | 80.9 years |
| Wilson | 19 | 74.5 years |
| Thomas | 19 | 78.6 years |
| Lee | 18 | 81.5 years |
| Myers | 16 | 82.6 years |
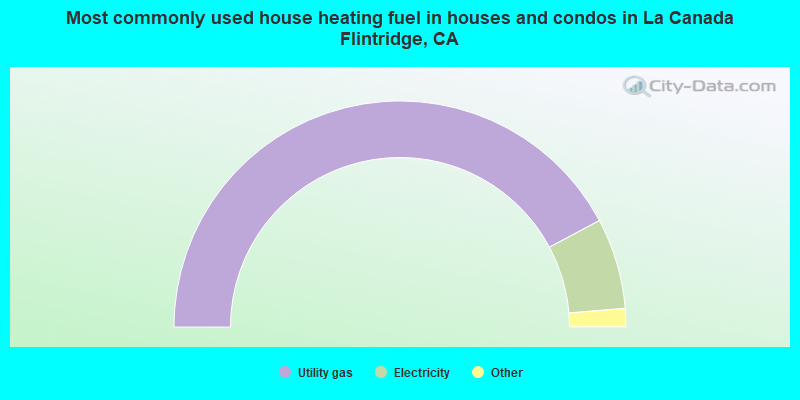
- 84.4%Utility gas
- 13.0%Electricity
- 1.7%Bottled, tank, or LP gas
- 0.6%Solar energy
- 0.2%Wood
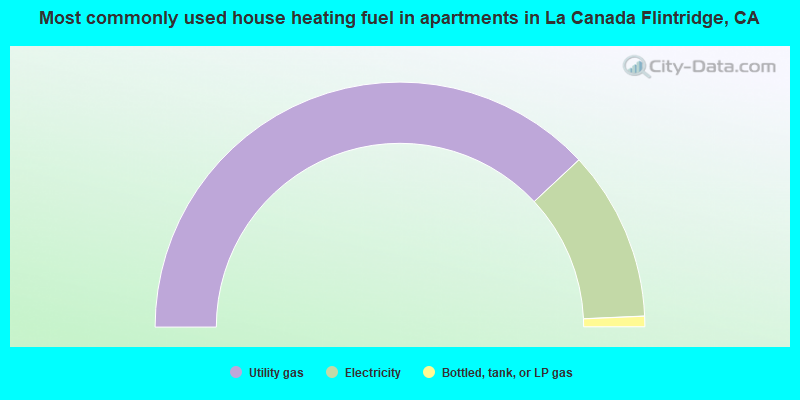
- 76.1%Utility gas
- 22.5%Electricity
- 1.4%Bottled, tank, or LP gas
La Canada Flintridge compared to California state average:
- Median household income above state average.
- Median house value significantly above state average.
- Unemployed percentage significantly below state average.
- Black race population percentage significantly below state average.
- Hispanic race population percentage significantly below state average.
- Median age significantly above state average.
- Renting percentage significantly below state average.
- Number of rooms per house significantly above state average.
- Percentage of population with a bachelor's degree or higher significantly above state average.
La Canada Flintridge on our top lists:
- #20 on the list of "Top 101 cities with the most residents born in Armenia (population 500+)"
- #27 on the list of "Top 101 cities with the most residents born in Korea (population 500+)"
- #31 on the list of "Top 101 cities with largest percentage of females in occupations: management occupations (population 5,000+)"
- #37 on the list of "Top 101 cities with the highest cost per building permit(population 5,000+)"
- #39 on the list of "Top 100 cities with highest median house value"
- #45 on the list of "Top 100 best educated cities (highest percentage of bachelor degree holding residents) (pop. 5,000+)"
- #47 on the list of "Top 101 cities with largest percentage of females in occupations: legal occupations (population 5,000+)"
- #60 on the list of "Top 101 cities with the most residents born in Eastern Asia (population 500+)"
- #64 on the list of "Top 100 cities with highest median household income (pop. 5,000+)"
- #70 on the list of "Top 101 cities with largest percentage of males in occupations: management occupations (population 5,000+)"
- #76 on the list of "Top 101 cities with largest percentage of males in occupations: arts, design, entertainment, sports, and media occupations (population 5,000+)"
- #82 on the list of "Top 101 cities with largest percentage of females in occupations: arts, design, entertainment, sports, and media occupations (population 5,000+)"
- #91 on the list of "Top 101 cities with the most residents born in Iran (population 500+)"
- #92 on the list of "Top 101 cities with largest percentage of females in industries: professional, scientific, and technical services (population 5,000+)"
- #1 on the list of "Top 101 counties with the most Evangelical Protestant congregations"
- #1 on the list of "Top 101 counties with the most Mainline Protestant congregations"
- #1 on the list of "Top 101 counties with the most Orthodox adherents"
- #1 on the list of "Top 101 counties with the highest ground withdrawal of fresh water for public supply (pop. 50,000+)"
- #1 on the list of "Top 101 counties with the most Catholic adherents (pop. 50,000+)"

|
|
Total of 200 patent applications in 2008-2024.