Estimated zip code population in 2022: 53,414 Zip code population in 2010: 51,747 Zip code population in 2000: 48,863
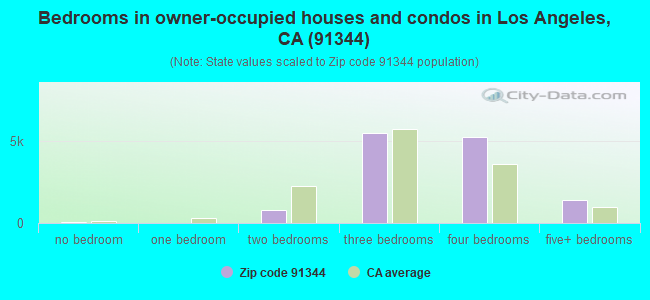
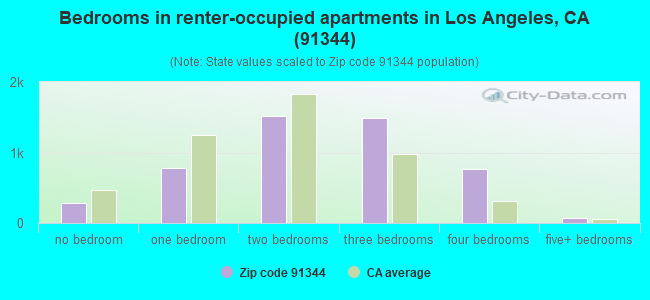
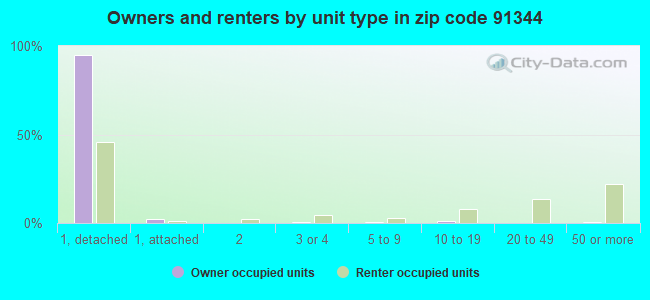
Houses and condos: 18,641 Renter-occupied apartments: 4,897
% of renters here:
27%
State:
44%
March 2022 cost of living index in zip code 91344: 134.3 (high, U.S. average is 100)
Land area: 16.4 sq. mi. Water area: 0.3 sq. mi.
Population density: 3,255 people per square mile
(average).
OSM Map
General Map
Google Map
MSN Map
OSM Map
General Map
Google Map
MSN Map
OSM Map
General Map
Google Map
MSN Map
OSM Map
General Map
Google Map
MSN Map
Please wait while loading the map...
Real estate property taxes paid for housing units in 2022:
This zip code:
0.7% ($6,073)
California:
0.7% ($4,831)
Median real estate property taxes paid for housing units with mortgages in 2022: $6,663 (0.7%) Median real estate property taxes paid for housing units with no mortgage in 2022: $4,213 (0.5%)
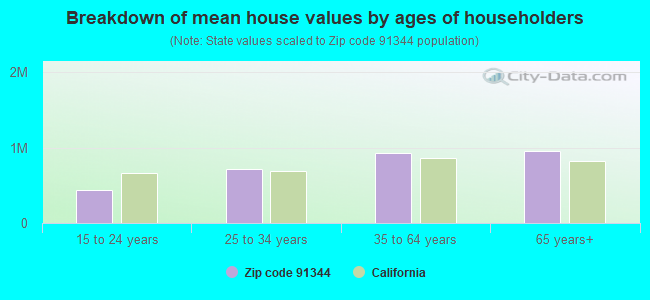
Estimated median house/condo value in 2022: $879,320
91344:
$879,320
California:
$715,900
According to our research of California and other state lists, there were 37 registered sex offenders living in 91344 zip code as of April 27, 2024. The ratio of all residents to sex offenders in zip code 91344 is 1,461 to 1. The ratio of registered sex offenders to all residents in this zip code is lower than the state average.
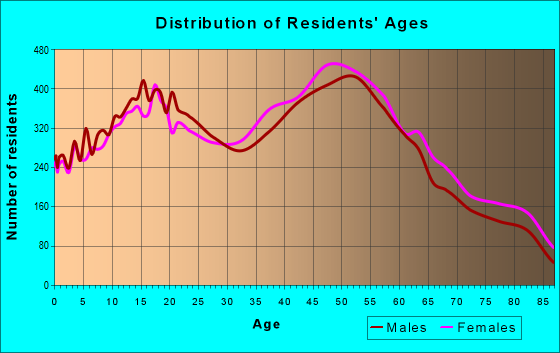
Median resident age:
This zip code:
43.1 years
California median age:
37.9 years
Average household size:
This zip code:
2.9 people
California:
2.8 people
Averages for the 2020 tax year for zip code 91344, filed in 2021:
Average Adjusted Gross Income (AGI) in 2020: $83,446 (Individual Income Tax Returns)
Here:
$83,446
State:
$95,910
Salary/wage: $72,377 (reported on 77.3% of returns)
Here:
$72,377
State:
$77,331
(% of AGI for various income ranges: 1181.1% for AGIs below $25k, 4017.5% for AGIs $25k-50k, 7555.2% for AGIs $50k-75k, 11589.1% for AGIs $75k-100k, 21978.7% for AGIs $100k-200k, 86675.0% for AGIs over 200k)
Taxable interest for individuals: $1,648 (reported on 39.2% of returns)
This zip code:
$1,648
California:
$2,294
(% of AGI for various income ranges: 24.6% for AGIs below $25k, 33.2% for AGIs $25k-50k, 78.1% for AGIs $50k-75k, 104.4% for AGIs $75k-100k, 181.7% for AGIs $100k-200k, 1459.0% for AGIs over 200k)
Ordinary dividends: $5,738 (reported on 19.9% of returns)
Here:
$5,738
State:
$10,949
(% of AGI for various income ranges: 25.3% for AGIs below $25k, 48.4% for AGIs $25k-50k, 89.7% for AGIs $50k-75k, 135.5% for AGIs $75k-100k, 363.4% for AGIs $100k-200k, 2952.2% for AGIs over 200k)
Net capital gain/loss in AGI: +$20,477 (reported on 20.5% of returns)
Here:
+$20,477
State:
+$49,306
(% of AGI for various income ranges: 21.6% for AGIs below $25k, 49.4% for AGIs $25k-50k, 80.2% for AGIs $50k-75k, 218.0% for AGIs $75k-100k, 571.7% for AGIs $100k-200k, 17950.8% for AGIs over 200k)
Profit/loss from business: +$11,970 (reported on 24.5% of returns)
Here:
+$11,970
State:
+$15,671
(% of AGI for various income ranges: 259.3% for AGIs below $25k, 360.8% for AGIs $25k-50k, 480.6% for AGIs $50k-75k, 541.6% for AGIs $75k-100k, 797.4% for AGIs $100k-200k, 3130.8% for AGIs over 200k)
Taxable individual retirement arrangement distribution: $19,226 (reported on 7.1% of returns)
91344:
$19,226
California:
$23,505
(% of AGI for various income ranges: 47.2% for AGIs below $25k, 82.9% for AGIs $25k-50k, 171.0% for AGIs $50k-75k, 309.4% for AGIs $75k-100k, 582.9% for AGIs $100k-200k, 1804.2% for AGIs over 200k)
Self-employed (Keogh) retirement plans: $25,618 (reported on 0.6% of returns)
91344:
$25,618
California:
$30,163
(% of AGI for various income ranges: 15.2% for AGIs $50k-75k, 36.6% for AGIs $100k-200k, 632.6% for AGIs over 200k)
Total itemized deductions: $35,053 (reported on 22.2% of returns)
Here:
$35,053
State:
$39,517
(% of AGI for various income ranges: 155.0% for AGIs below $25k, 379.8% for AGIs $25k-50k, 966.5% for AGIs $50k-75k, 1762.2% for AGIs $75k-100k, 3413.1% for AGIs $100k-200k, 11769.6% for AGIs over 200k)
Charity contributions: $6,678 (reported on 18.5% of returns)
Here:
$6,678
State:
$12,598
(% of AGI for various income ranges: 5.6% for AGIs below $25k, 27.3% for AGIs $25k-50k, 85.6% for AGIs $50k-75k, 182.5% for AGIs $75k-100k, 469.0% for AGIs $100k-200k, 3190.0% for AGIs over 200k)
Taxes paid: $9,015 (reported on 22.2% of returns)
91344:
$9,015
State:
$8,807
(% of AGI for various income ranges: 36.6% for AGIs below $25k, 98.5% for AGIs $25k-50k, 252.1% for AGIs $50k-75k, 523.9% for AGIs $75k-100k, 988.5% for AGIs $100k-200k, 2297.0% for AGIs over 200k)
Earned income credit: $1,675 (reported on 11.8% of returns)
Here:
$1,675
State:
$2,074
(% of AGI for various income ranges: 70.4% for AGIs below $25k, 55.3% for AGIs $25k-50k, 0.9% for AGIs $50k-75k)
Percentage of individuals using paid preparers for their 2020 taxes: 92.5%
Here:
92%
State:
92%
(% for various income ranges: 90.8% for AGIs below $25k, 92.7% for AGIs $25k-50k, 93.6% for AGIs $50k-75k, 92.6% for AGIs $75k-100k, 93.4% for AGIs $100k-200k, 93.8% for AGIs over 200k)
Averages for the 2012 tax year for zip code 91344, filed in 2013:
Average Adjusted Gross Income (AGI) in 2012: $67,934 (Individual Income Tax Returns)
Here:
$67,934
State:
$72,726
Salary/wage: $61,291 (reported on 80.2% of returns)
Here:
$61,291
State:
$59,079
(% of AGI for various income ranges: 67.8% for AGIs below $25k, 75.3% for AGIs $25k-50k, 76.1% for AGIs $50k-75k, 76.3% for AGIs $75k-100k, 76.9% for AGIs $100k-200k, 61.1% for AGIs over 200k)
Taxable interest for individuals: $1,509 (reported on 41.5% of returns)
This zip code:
$1,509
California:
$2,146
(% of AGI for various income ranges: 1.3% for AGIs below $25k, 1.0% for AGIs $25k-50k, 0.8% for AGIs $50k-75k, 0.7% for AGIs $75k-100k, 0.8% for AGIs $100k-200k, 1.2% for AGIs over 200k)
Ordinary dividends: $3,999 (reported on 20.6% of returns)
Here:
$3,999
State:
$9,308
(% of AGI for various income ranges: 1.4% for AGIs below $25k, 1.0% for AGIs $25k-50k, 1.1% for AGIs $50k-75k, 1.2% for AGIs $75k-100k, 1.2% for AGIs $100k-200k, 1.4% for AGIs over 200k)
Net capital gain/loss in AGI: +$4,959 (reported on 18.0% of returns)
Here:
+$4,959
State:
+$30,460
(% of AGI for various income ranges: 0.2% for AGIs $50k-75k, 0.1% for AGIs $75k-100k, 0.7% for AGIs $100k-200k, 4.7% for AGIs over 200k)
Profit/loss from business: +$14,778 (reported on 22.3% of returns)
Here:
+$14,778
State:
+$17,064
(% of AGI for various income ranges: 16.3% for AGIs below $25k, 8.0% for AGIs $25k-50k, 4.7% for AGIs $50k-75k, 3.6% for AGIs $75k-100k, 3.1% for AGIs $100k-200k, 3.6% for AGIs over 200k)
Taxable individual retirement arrangement distribution: $16,175 (reported on 9.3% of returns)
91344:
$16,175
California:
$19,557
(% of AGI for various income ranges: 2.8% for AGIs below $25k, 2.3% for AGIs $25k-50k, 2.1% for AGIs $50k-75k, 2.6% for AGIs $75k-100k, 2.3% for AGIs $100k-200k, 1.8% for AGIs over 200k)
Self-employment retirement plans: $17,195 (reported on 0.8% of returns)
91344:
$17,195
California:
$24,530
(% of AGI for various income ranges: 0.2% for AGIs $50k-75k, 0.2% for AGIs $100k-200k, 0.5% for AGIs over 200k)
Total itemized deductions: $30,300 (27% of AGI, reported on 46.3% of returns)
Here:
$30,300
State:
$34,004
Here:
27.1% of AGI
State:
22.7% of AGI
(% of AGI for various income ranges: 16.0% for AGIs below $25k, 18.2% for AGIs $25k-50k, 21.3% for AGIs $50k-75k, 22.9% for AGIs $75k-100k, 22.0% for AGIs $100k-200k, 19.4% for AGIs over 200k)
Charity contributions: $3,412 (reported on 38.8% of returns)
Here:
$3,412
State:
$4,659
(% of AGI for various income ranges: 0.8% for AGIs below $25k, 1.3% for AGIs $25k-50k, 1.7% for AGIs $50k-75k, 2.0% for AGIs $75k-100k, 2.2% for AGIs $100k-200k, 2.3% for AGIs over 200k)
Taxes paid: $11,009 (reported on 46.1% of returns)
91344:
$11,009
State:
$14,448
(% of AGI for various income ranges: 3.7% for AGIs below $25k, 4.2% for AGIs $25k-50k, 5.9% for AGIs $50k-75k, 7.4% for AGIs $75k-100k, 8.2% for AGIs $100k-200k, 9.9% for AGIs over 200k)
Earned income credit: $1,965 (reported on 14.6% of returns)
Here:
$1,965
State:
$2,286
(% of AGI for various income ranges: 5.2% for AGIs below $25k, 1.0% for AGIs $25k-50k)
Percentage of individuals using paid preparers for their 2012 taxes: 71.1%
Here:
71%
State:
64%
(% for various income ranges: 67.1% for AGIs below $25k, 71.7% for AGIs $25k-50k, 72.0% for AGIs $50k-75k, 72.2% for AGIs $75k-100k, 74.9% for AGIs $100k-200k, 78.6% for AGIs over 200k)
Averages for the 2004 tax year for zip code 91344, filed in 2005:
Average Adjusted Gross Income (AGI) in 2004: $57,167 (Individual Income Tax Returns)
Here:
$57,167
State:
$58,600
Salary/wage: $52,417 (reported on 81.0% of returns)
Here:
$52,417
State:
$49,455
(% of AGI for various income ranges: 189.8% for AGIs below $10k, 69.2% for AGIs $10k-25k, 77.6% for AGIs $25k-50k, 77.6% for AGIs $50k-75k, 80.2% for AGIs $75k-100k, 69.3% for AGIs over 100k)
Taxable interest for individuals: $1,649 (reported on 53.7% of returns)
This zip code:
$1,649
California:
$2,365
(% of AGI for various income ranges: 15.2% for AGIs below $10k, 2.9% for AGIs $10k-25k, 1.4% for AGIs $25k-50k, 1.6% for AGIs $50k-75k, 1.4% for AGIs $75k-100k, 1.3% for AGIs over 100k)
Taxable dividends: $2,376 (reported on 26.3% of returns)
Here:
$2,376
State:
$4,746
(% of AGI for various income ranges: 8.2% for AGIs below $10k, 1.4% for AGIs $10k-25k, 0.8% for AGIs $25k-50k, 1.0% for AGIs $50k-75k, 1.1% for AGIs $75k-100k, 1.1% for AGIs over 100k)
Net capital gain/loss: +$9,713 (reported on 22.8% of returns)
Here:
+$9,713
State:
+$23,418
(% of AGI for various income ranges: -7.5% for AGIs below $10k, -0.3% for AGIs $10k-25k, 0.5% for AGIs $25k-50k, 0.5% for AGIs $50k-75k, 0.5% for AGIs $75k-100k, 7.8% for AGIs over 100k)
Profit/loss from business: +$15,293 (reported on 23.5% of returns)
Here:
+$15,293
State:
+$16,826
(% of AGI for various income ranges: 31.4% for AGIs below $10k, 14.7% for AGIs $10k-25k, 8.1% for AGIs $25k-50k, 5.6% for AGIs $50k-75k, 4.4% for AGIs $75k-100k, 5.2% for AGIs over 100k)
IRA payment deduction: $3,445 (reported on 3.9% of returns)
91344:
$3,445
California:
$3,192
(% of AGI for various income ranges: 0.9% for AGIs below $10k, 0.3% for AGIs $10k-25k, 0.3% for AGIs $25k-50k, 0.3% for AGIs $50k-75k, 0.2% for AGIs $75k-100k, 0.2% for AGIs over 100k)
Self-employed pension: $13,432 (reported on 1.5% of returns)
Here:
$13,432
California:
$17,688
(% of AGI for various income ranges: 0.1% for AGIs $10k-25k, 0.1% for AGIs $25k-50k, 0.2% for AGIs $50k-75k, 0.3% for AGIs $75k-100k, 0.6% for AGIs over 100k)
Total itemized deductions: $25,973 (29% of AGI, reported on 50.4% of returns)
Here:
$25,973
State:
$28,113
Here:
28.7% of AGI
State:
25.3% of AGI
(% of AGI for various income ranges: 57.7% for AGIs below $10k, 19.5% for AGIs $10k-25k, 23.0% for AGIs $25k-50k, 25.8% for AGIs $50k-75k, 26.4% for AGIs $75k-100k, 20.7% for AGIs over 100k)
Charity contributions deductions: $3,090 (3% of AGI, reported on 44.6% of returns)
Here:
$3,090
State:
$3,923
Here:
3.2% of AGI
State:
3.3% of AGI
(% of AGI for various income ranges: 2.1% for AGIs below $10k, 1.2% for AGIs $10k-25k, 2.0% for AGIs $25k-50k, 2.5% for AGIs $50k-75k, 2.8% for AGIs $75k-100k, 2.5% for AGIs over 100k)
Total tax: $8,539 (reported on 80.5% of returns)
91344:
$8,539
State:
$10,761
(% of AGI for various income ranges: 10.5% for AGIs below $10k, 5.2% for AGIs $10k-25k, 7.1% for AGIs $25k-50k, 8.6% for AGIs $50k-75k, 9.3% for AGIs $75k-100k, 16.5% for AGIs over 100k)
Earned income credit: $1,527 (reported on 11.6% of returns)
Here:
$1,527
State:
$1,763
Percentage of individuals using paid preparers for their 2004 taxes: 71.8%
Here:
72%
State:
66%
(% for various income ranges: 62.6% for AGIs below $10k, 70.4% for AGIs $10k-25k, 72.7% for AGIs $25k-50k, 74.9% for AGIs $50k-75k, 75.5% for AGIs $75k-100k, 77.0% for AGIs over 100k)
Likely homosexual households (counted as self-reported same-sex unmarried-partner households)
Lesbian couples: 0.1% of all households
Gay men: 0.2% of all households
Household received Food Stamps/SNAP in the past 12 months: 1,532 Household did not receive Food Stamps/SNAP in the past 12 months: 16,214
Women who had a birth in the past 12 months: 620 (407 now married, 213 unmarried) Women who did not have a birth in the past 12 months: 10,904 (4,492 now married, 6,405 unmarried)
Housing units in zip code 91344 with a mortgage: 9,301 (1,129 second mortgage, 22 home equity loan, 755 both second mortgage and home equity loan) Houses without a mortgage: 104
Median monthly owner costs for units with a mortgage: $3,256 Median monthly owner costs for units without a mortgage: $973
Residents with income below the poverty level in 2022:
This zip code:
7.4%
Whole state:
12.2%
Residents with income below 50% of the poverty level in 2022:
This zip code:
3.3%
Whole state:
6.2%
Median number of rooms in houses and condos:
Here:
6.3
State:
6.0
Median number of rooms in apartments:
Here:
4.3
State:
3.9
Notable locations in this zip code not listed on our city pages
Notable locations in zip code 91344: Sunshine Canyon Landfill (A), Cascade Ranch (B), Knollwood Golf Course (C), Granada Hills Branch Los Angeles Public Library (D), City of Los Angeles Fire Department Station 87 (E), City of Los Angeles Fire Department Station 18 (F). Display/hide their locations on the map
Shopping Centers: North Hills Shopping Center (1), Granada Village Shopping Center (2), Balboa-Mission Square Shopping Center (3), Balboa-Mission Shopping Center (4). Display/hide their locations on the map
Churches in zip code 91344 include: Apostolic Pentecostal Church (A), First Baptist Church (B), First Foursquare Church (C), Our Savior's First Lutheran Church (D), Saint Andrew And Saint Charles Church (E), Saint John Baptist De La Salle Church (F), Saint Stephen's Lutheran Church (G), San Fernando Korean Church (H), Woodley Avenue Baptist Church (I). Display/hide their locations on the map
Parks in zip code 91344 include: John Elway Stadium (1), Granada Hills Park (2), Gothic Rinaldi Park (3), Omelveny Park (4). Display/hide their locations on the map
Tourist attractions (not listed on the city page) : Breaktime Billiards (Amusement & Theme Parks; 17524 Chatsworth Street), Breaktime Billiards & Arcade Games (17524 Chatsworth Street).
7,515 married couples with children.
1,702 single-parent households (632 men, 1,070 women).
45.8% of residents of 91344 zip code speak English at home.
23.0% of residents speak Spanish at home (70% very well, 16% well, 10% not well, 3% not at all).
16.9% of residents speak other Indo-European language at home (64% very well, 23% well, 11% not well, 3% not at all).
11.6% of residents speak Asian or Pacific Island language at home (66% very well, 21% well, 10% not well, 3% not at all).
3.8% of residents speak other language at home (56% very well, 23% well, 14% not well, 7% not at all).
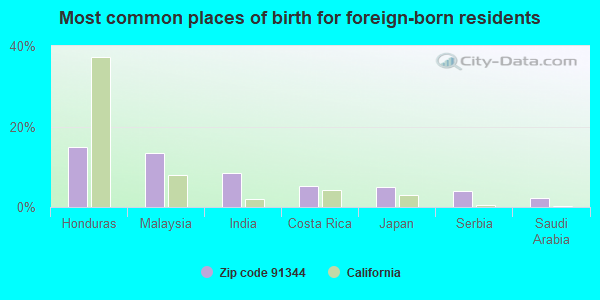
Foreign born population: 20,282 (38.0%) (76.4% of them are naturalized citizens)
This zip code:
38.0%
Whole state:
26.7%
15%Honduras
14%Malaysia
9%India
5%Costa Rica
5%Japan
4%Serbia
2%Saudi Arabia
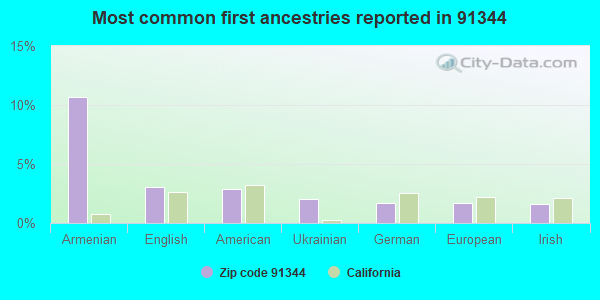
11%Armenian
3%English
3%American
2%Ukrainian
2%German
2%European
2%Irish
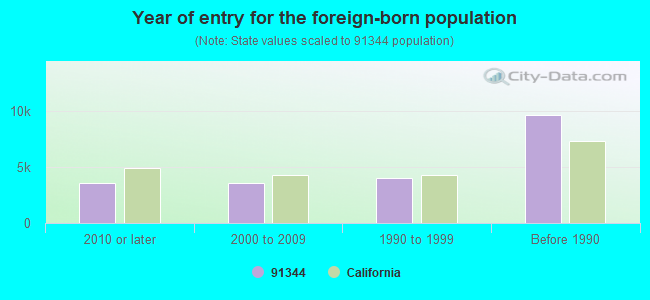
Year of entry for the foreign-born population
3,5462010 or later
3,6082000 to 2009
3,9921990 to 1999
9,669Before 1990
Major facilities with environmental interests located in this zip code:
METROPOLITAN WATER DIST OF STHRN CAL (13100 BALBOA BLVD in GRANADA HILLS, CA) . Federal Facility
STATE MASTER (California - Hazardous Waste Tracking) - HAZARDOU WASTE PROGRAM HAZARDOUS WASTE BIENNIAL REPORTER (Resource Conservation and Recovery Act (tracking hazardous waste)) Large Quantity Generators, more that 1000 kg of hazardous waste/month (Resource Conservation and Recovery Act (tracking hazardous waste)) Organizations: SEAN MCCANN (CONTACT/OPERATOR)
, METROPOLITAN WATER DIST. OF SO. CALIF. (CONTACT/OWNER)
Alternative names: JENSEN FILTRATION PLANT, JOSEPH JENSEN FILTRATION PLANT
CALTRANS DISTRICT 7/SAN FERNANDO MS. (11930 BLUCHER ST in GRANADA HILLS, CA) . Federal Facility
STATE MASTER (California - Hazardous Waste Tracking) - HAZARDOU WASTE PROGRAM Small Quantity Generators, between 100 kg and 1000 kg of hazardous waste/month (Resource Conservation and Recovery Act (tracking hazardous waste)) - notification Small Quantity Generators, between 100 kg and 1000 kg of hazardous waste/month (Resource Conservation and Recovery Act (tracking hazardous waste)) Alternative names: SAN FERNANDO MAINT STA
LAUSD-GRANADA HILLS HIGH SCHOOL (10535 ZELZAH AVE. in GRANADA HILLS, CA)
STATE MASTER (California - Hazardous Waste Tracking) - HAZARDOU WASTE PROGRAM HAZARDOUS WASTE BIENNIAL REPORTER (Resource Conservation and Recovery Act (tracking hazardous waste)) Large Quantity Generators, more that 1000 kg of hazardous waste/month (Resource Conservation and Recovery Act (tracking hazardous waste)) Alternative names: LAUSD GRANADA HILLS HIGH SCHOOL, LAUSD/ GRANADA HILLS HS
LA GRANADA HILLS LIBRARY (10640 PETIT AVE in GRANADA HILLS, CA)
STATE MASTER (California - Hazardous Waste Tracking) - HAZARDOU WASTE PROGRAM Small Quantity Generators, between 100 kg and 1000 kg of hazardous waste/month (Resource Conservation and Recovery Act (tracking hazardous waste)) - notification Organizations: CITY OF LOS ANGELES (CONTACT/OWNER)
Alternative names: CITY OF LA GENERAL SERVICES
LA FIRE STATION 18 (12050 BALBOA BLVD in GRANADA HILLS, CA)
STATE MASTER (California - Hazardous Waste Tracking) - HAZARDOU WASTE PROGRAM Small Quantity Generators, between 100 kg and 1000 kg of hazardous waste/month (Resource Conservation and Recovery Act (tracking hazardous waste)) - notification Organizations: CITY OF LA (CONTACT/OWNER)
Alternative names: CITY OF LA GENERAL SERVICES
LAUSD KENNEDY HIGH SCHOOL (11254 GOTHIC AVE in GRANADA HILLS, CA)
STATE MASTER (California - Hazardous Waste Tracking) - HAZARDOU WASTE PROGRAM Small Quantity Generators, between 100 kg and 1000 kg of hazardous waste/month (Resource Conservation and Recovery Act (tracking hazardous waste)) - notification Alternative names: KENNEDY (JOHN F.) HIGH, LAUSD/ KENNEDY HS
LA USD HENRY JUNIOR HIGH (17340 SAN JOSE ST in GRANADA HILLS, CA)
STATE MASTER (California - Hazardous Waste Tracking) - HAZARDOU WASTE PROGRAM Small Quantity Generators, between 100 kg and 1000 kg of hazardous waste/month (Resource Conservation and Recovery Act (tracking hazardous waste)) - notification
LA GRANADA HILLS ST MAINT YARD (10210 ETIWANDA AVE in GRANADA HILLS, CA)
STATE MASTER (California - Hazardous Waste Tracking) - HAZARDOU WASTE PROGRAM Small Quantity Generators, between 100 kg and 1000 kg of hazardous waste/month (Resource Conservation and Recovery Act (tracking hazardous waste)) - notification Organizations: CITY OF LOS ANGELES (CONTACT/OWNER)
EQUILON ENTERPRISES LLC (16961 DEVONSHIRE BLVD in GRANADA HILLS, CA) . Federal Facility
STATE MASTER (California - Hazardous Waste Tracking) - HAZARDOU WASTE PROGRAM Small Quantity Generators, between 100 kg and 1000 kg of hazardous waste/month (Resource Conservation and Recovery Act (tracking hazardous waste)) - notification Organizations: EQUILON ENTERPRISES, LLC (CONTACT/OWNER)
Alternative names: SHELL OIL CO
CHEVRON STATION NO 99759 (17009 RINALDI ST in GRANADA HILLS, CA)
STATE MASTER (California - Hazardous Waste Tracking) - HAZARDOU WASTE PROGRAM Small Quantity Generators, between 100 kg and 1000 kg of hazardous waste/month (Resource Conservation and Recovery Act (tracking hazardous waste)) - notification Organizations: CHEVRON PRODUCTS CO (CONTACT/OWNER)
KNOLLWOOD FRAME & BODY (12000 BALBOA BLVD #110 in GRANADA HILLS, CA)
STATE MASTER (California - Hazardous Waste Tracking) - HAZARDOU WASTE PROGRAM Small Quantity Generators, between 100 kg and 1000 kg of hazardous waste/month (Resource Conservation and Recovery Act (tracking hazardous waste)) Business NAICS classification: GENERAL AUTOMOTIVE REPAIR. Alternative names: KNOLLWOOD AUTO CENTER
KENN CLEANERS (169244 SAN FERNANDO MISS RD in GRANADA HILLS, CA)
STATE MASTER (California - Hazardous Waste Tracking) - HAZARDOU WASTE PROGRAM Small Quantity Generators, between 100 kg and 1000 kg of hazardous waste/month (Resource Conservation and Recovery Act (tracking hazardous waste))
ADDAMS (JANE) CONTINUATION (16341 DONMETZ ST. in GRANADA HILLS, CA)
(National Center for Education Statistics) - STATE ID-1932334 Organizations: LOS ANGELES UNIFIED (SCHOOL DISTRICT)
Housing units lacking complete plumbing facilities: 0.4% Housing units lacking complete kitchen facilities: 2.1%
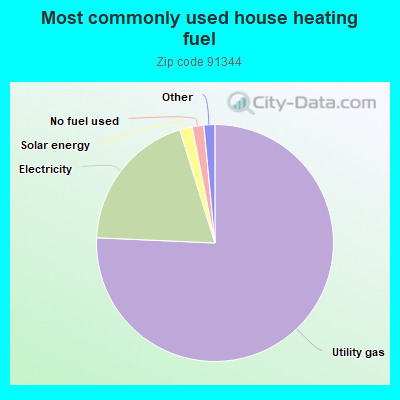
75.7%Utility gas
19.5%Electricity
1.7%Solar energy
1.6%No fuel used
0.8%Bottled, tank, or LP gas
0.5%Wood
Population in 1990: 45,729. Population change in the 1990s: +3,134 (+6.9%).
Place of birth for U.S.-born residents:
This state: 26,220
Northeast: 1,895
Midwest: 1,538
South: 1,689
West: 1,057
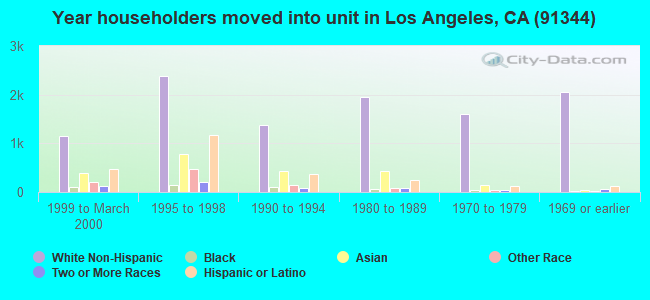
59% of the 91344 zip code residents lived in the same house 5 years ago. Out of people who lived in different houses, 89% lived in this county. Out of people who lived in different counties, 50% lived in California.
94% of the 91344 zip code residents lived in the same house 1 year ago. Out of people who lived in different houses, 81% moved from this county. Out of people who lived in different houses, 11% moved from different county within same state. Out of people who lived in different houses, 2% moved from different state. Out of people who lived in different houses, 9% moved from abroad.
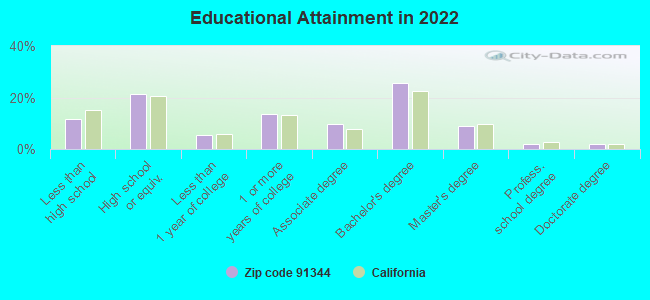
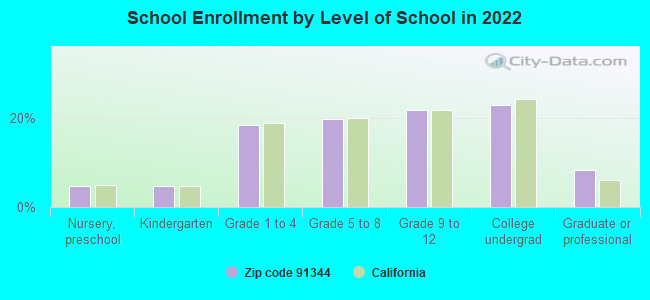
Private vs. public school enrollment:
Students in private schools in grades 1 to 8 (elementary and middle school): 842
Here:
18.2%
California:
10.5%
Students in private schools in grades 9 to 12 (high school): 443
Here:
16.9%
California:
8.5%
Students in private undergraduate colleges: 417
Here:
15.2%
California:
15.9%
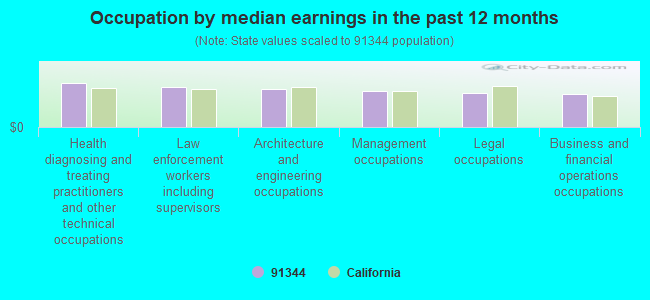
Occupation by median earnings in the past 12 months ($)
109,167Health diagnosing and treating practitioners and other technical occupations
100,452Law enforcement workers including supervisors
94,989Architecture and engineering occupations
90,034Management occupations
84,853Legal occupations
82,209Business and financial operations occupations
Companies with federal contracts located in this zip code:
KSC-TRI SYSTEMS USA, INC (17485 DORIC ST in GRANADA HILLS, CA; small business) : $1,551,766 in 147 contractsfrom 2002 to 2006
Contracts for Other Social Services, Miscellaneous Items, Educational Services, Other Education and Training Services, and moreby Defense Logistics Agency, Army, Bureau of Prisoners/Federal Prison System, SOCIAL SECURITY ADMINISTRATION, and others Signed by year:2000: $0; 2001: $0; 2002: $88,136; 2003: $215,067; 2004: $392,346; 2005: $712,600; 2006: $143,617.
Biggest contracts:
$96,000 with Defense Logistics Agency for Other Social Services. Signed on 2005-10-14. Completion date: 2005-10-14.
$96,000 with Defense Logistics Agency for Miscellaneous Items. Signed on 2004-10-01. Completion date: 2004-10-30.
$90,000 with Army for Educational Services. Signed on 2005-08-03. Completion date: 2006-09-14.
$83,323 with Bureau of Prisoners/Federal Prison System for Other Education and Training Services. Taking place in FL. Signed on 2005-10-01. Completion date: 2006-09-30.
AL THOMPSONS APOLLO AIR CONDIT (10944 MCLENNAN AVENUE in GRANADA HILLS, CA; small business) : $197,896 in 2 contractsfrom 2000 to 2003
$184,890 with Army for Air Conditioning Equipment. Signed on 2003-04-25. Completion date: 2003-06-04.
$13,006 with Navy for Maintenance, Repair or Alteration of Real Property -- Miscellaneous Buildings. Signed on 2000-08-09. Completion date: 2000-09-30.
Top industries in this zip code by the number of employees in 2005:
Administrative and Support and Waste Management and Remediation Services: Temporary Help Services (500-999 employees: 1 establishment, 250-499 employees: 1 establishment, 50-99 employees: 1 establishment)
2005 - 2018 National Fire Incident Reporting System (NFIRS) incidents
According to the data from the years 2005 - 2018 the average number of fires per year is 86. The highest number of fires - 127 took place in 2006, and the least - 47 in 2012. The data has a dropping trend.
When looking into fire subcategories, the most reports belonged to: Structure Fires (35.0%), and Mobile Property/Vehicle Fires (31.4%).
Fire incident types reported to NFIRS in Zip Code 91344
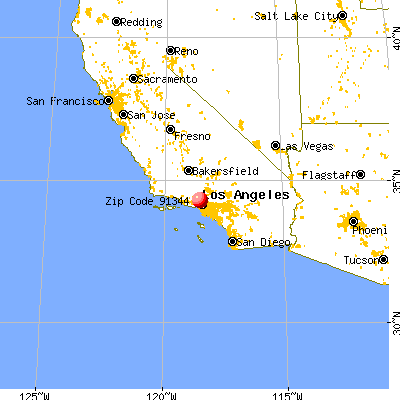


 Nearest zip codes: 91326, 91330, 91345, 91325, 91343, 91324.


 . Federal Facility

 According to the data from the years 2005 - 2018 the average number of fires per year is 86. The highest number of fires - 127 took place in 2006, and the least - 47 in 2012. The data has a dropping trend.
 When looking into fire subcategories, the most reports belonged to: Structure Fires (35.0%), and Mobile Property/Vehicle Fires (31.4%).