Estimated zip code population in 2022: 27,145 Zip code population in 2010: 27,649 Zip code population in 2000: 35,562
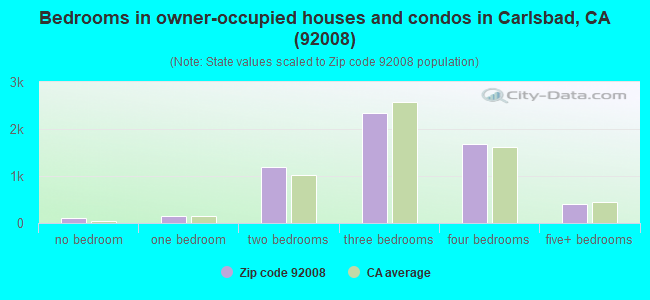
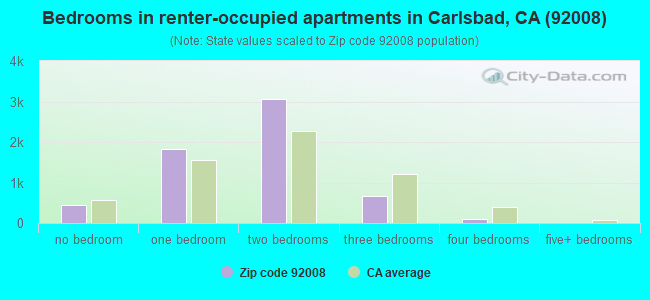
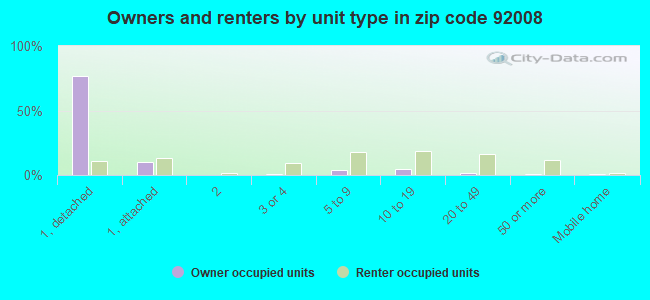
Houses and condos: 13,322 Renter-occupied apartments: 6,104
% of renters here:
51%
State:
44%
March 2022 cost of living index in zip code 92008: 127.1 (high, U.S. average is 100)
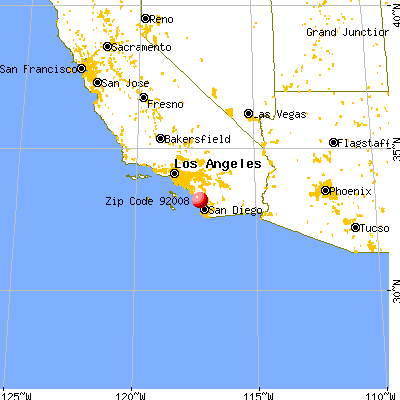
Land area: 10.3 sq. mi. Water area: 1.5 sq. mi.
Population density: 2,634 people per square mile
(average).
OSM Map
General Map
Google Map
MSN Map
OSM Map
General Map
Google Map
MSN Map
OSM Map
General Map
Google Map
MSN Map
OSM Map
General Map
Google Map
MSN Map
Please wait while loading the map...
Real estate property taxes paid for housing units in 2022:
This zip code:
0.5% ($6,197)
California:
0.7% ($4,831)
Median real estate property taxes paid for housing units with mortgages in 2022: $7,020 (0.6%) Median real estate property taxes paid for housing units with no mortgage in 2022: $3,857 (0.4%)
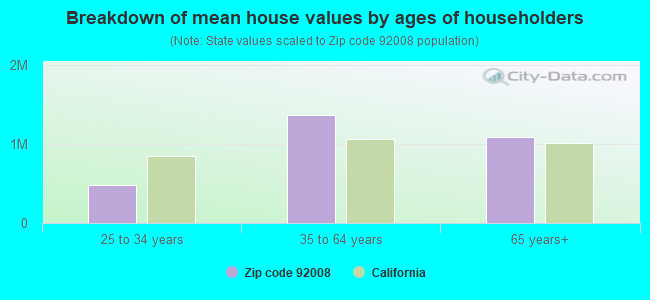
Estimated median house/condo value in 2022: $1,141,661
92008:
$1,141,661
California:
$715,900
According to our research of California and other state lists, there were 17 registered sex offenders living in 92008 zip code as of April 27, 2024. The ratio of all residents to sex offenders in zip code 92008 is 1,609 to 1. The ratio of registered sex offenders to all residents in this zip code is lower than the state average.
Median resident age:
This zip code:
43.6 years
California median age:
37.9 years
Average household size:
This zip code:
2.3 people
California:
2.8 people
Averages for the 2020 tax year for zip code 92008, filed in 2021:
Average Adjusted Gross Income (AGI) in 2020: $116,848 (Individual Income Tax Returns)
Here:
$116,848
State:
$95,910
Salary/wage: $92,011 (reported on 75.6% of returns)
Here:
$92,011
State:
$77,331
(% of AGI for various income ranges: 1177.0% for AGIs below $25k, 3905.9% for AGIs $25k-50k, 7081.6% for AGIs $50k-75k, 10179.1% for AGIs $75k-100k, 19817.5% for AGIs $100k-200k, 102496.9% for AGIs over 200k)
Taxable interest for individuals: $2,406 (reported on 43.2% of returns)
This zip code:
$2,406
California:
$2,294
(% of AGI for various income ranges: 35.0% for AGIs below $25k, 42.8% for AGIs $25k-50k, 71.3% for AGIs $50k-75k, 169.9% for AGIs $75k-100k, 259.1% for AGIs $100k-200k, 1666.3% for AGIs over 200k)
Ordinary dividends: $9,856 (reported on 32.2% of returns)
Here:
$9,856
State:
$10,949
(% of AGI for various income ranges: 77.8% for AGIs below $25k, 114.1% for AGIs $25k-50k, 173.9% for AGIs $50k-75k, 352.6% for AGIs $75k-100k, 835.8% for AGIs $100k-200k, 5551.8% for AGIs over 200k)
Net capital gain/loss in AGI: +$35,119 (reported on 31.8% of returns)
Here:
+$35,119
State:
+$49,306
(% of AGI for various income ranges: 38.9% for AGIs below $25k, 89.2% for AGIs $25k-50k, 192.2% for AGIs $50k-75k, 324.4% for AGIs $75k-100k, 1161.8% for AGIs $100k-200k, 28940.4% for AGIs over 200k)
Profit/loss from business: +$22,610 (reported on 20.8% of returns)
Here:
+$22,610
State:
+$15,671
(% of AGI for various income ranges: 167.0% for AGIs below $25k, 338.0% for AGIs $25k-50k, 372.0% for AGIs $50k-75k, 561.4% for AGIs $75k-100k, 1045.5% for AGIs $100k-200k, 7552.0% for AGIs over 200k)
Taxable individual retirement arrangement distribution: $28,838 (reported on 10.9% of returns)
92008:
$28,838
California:
$23,505
(% of AGI for various income ranges: 64.8% for AGIs below $25k, 155.3% for AGIs $25k-50k, 284.0% for AGIs $50k-75k, 538.3% for AGIs $75k-100k, 1345.1% for AGIs $100k-200k, 3388.0% for AGIs over 200k)
Self-employed (Keogh) retirement plans: $24,809 (reported on 1.5% of returns)
92008:
$24,809
California:
$30,163
(% of AGI for various income ranges: 26.7% for AGIs $50k-75k, 82.5% for AGIs $100k-200k, 827.6% for AGIs over 200k)
Total itemized deductions: $39,056 (reported on 20.0% of returns)
Here:
$39,056
State:
$39,517
(% of AGI for various income ranges: 150.3% for AGIs below $25k, 292.4% for AGIs $25k-50k, 554.9% for AGIs $50k-75k, 998.8% for AGIs $75k-100k, 2479.5% for AGIs $100k-200k, 12148.0% for AGIs over 200k)
Charity contributions: $10,007 (reported on 17.0% of returns)
Here:
$10,007
State:
$12,598
(% of AGI for various income ranges: 6.5% for AGIs below $25k, 21.8% for AGIs $25k-50k, 52.7% for AGIs $50k-75k, 115.8% for AGIs $75k-100k, 395.5% for AGIs $100k-200k, 3623.9% for AGIs over 200k)
Taxes paid: $8,753 (reported on 20.0% of returns)
92008:
$8,753
State:
$8,807
(% of AGI for various income ranges: 26.6% for AGIs below $25k, 56.6% for AGIs $25k-50k, 115.6% for AGIs $50k-75k, 257.3% for AGIs $75k-100k, 682.3% for AGIs $100k-200k, 2417.8% for AGIs over 200k)
Earned income credit: $1,406 (reported on 7.5% of returns)
Here:
$1,406
State:
$2,074
(% of AGI for various income ranges: 42.8% for AGIs below $25k, 33.9% for AGIs $25k-50k)
Percentage of individuals using paid preparers for their 2020 taxes: 93.2%
Here:
93%
State:
92%
(% for various income ranges: 90.7% for AGIs below $25k, 92.5% for AGIs $25k-50k, 94.9% for AGIs $50k-75k, 94.3% for AGIs $75k-100k, 93.6% for AGIs $100k-200k, 95.9% for AGIs over 200k)
Averages for the 2012 tax year for zip code 92008, filed in 2013:
Average Adjusted Gross Income (AGI) in 2012: $89,352 (Individual Income Tax Returns)
Here:
$89,352
State:
$72,726
Salary/wage: $65,389 (reported on 77.4% of returns)
Here:
$65,389
State:
$59,079
(% of AGI for various income ranges: 70.4% for AGIs below $25k, 75.0% for AGIs $25k-50k, 70.7% for AGIs $50k-75k, 65.4% for AGIs $75k-100k, 70.3% for AGIs $100k-200k, 39.1% for AGIs over 200k)
Taxable interest for individuals: $3,694 (reported on 42.7% of returns)
This zip code:
$3,694
California:
$2,146
(% of AGI for various income ranges: 1.6% for AGIs below $25k, 1.0% for AGIs $25k-50k, 1.4% for AGIs $50k-75k, 1.3% for AGIs $75k-100k, 0.9% for AGIs $100k-200k, 2.6% for AGIs over 200k)
Ordinary dividends: $16,824 (reported on 27.6% of returns)
Here:
$16,824
State:
$9,308
(% of AGI for various income ranges: 2.8% for AGIs below $25k, 1.6% for AGIs $25k-50k, 1.9% for AGIs $50k-75k, 2.5% for AGIs $75k-100k, 2.0% for AGIs $100k-200k, 9.2% for AGIs over 200k)
Net capital gain/loss in AGI: +$41,939 (reported on 25.5% of returns)
Here:
+$41,939
State:
+$30,460
(% of AGI for various income ranges: 0.1% for AGIs $25k-50k, 0.5% for AGIs $50k-75k, 1.0% for AGIs $75k-100k, 1.6% for AGIs $100k-200k, 26.1% for AGIs over 200k)
Profit/loss from business: +$18,904 (reported on 20.5% of returns)
Here:
+$18,904
State:
+$17,064
(% of AGI for various income ranges: 11.3% for AGIs below $25k, 7.1% for AGIs $25k-50k, 5.5% for AGIs $50k-75k, 5.4% for AGIs $75k-100k, 3.9% for AGIs $100k-200k, 2.8% for AGIs over 200k)
Taxable individual retirement arrangement distribution: $22,178 (reported on 12.1% of returns)
92008:
$22,178
California:
$19,557
(% of AGI for various income ranges: 3.5% for AGIs below $25k, 2.8% for AGIs $25k-50k, 3.6% for AGIs $50k-75k, 4.2% for AGIs $75k-100k, 4.0% for AGIs $100k-200k, 2.0% for AGIs over 200k)
Self-employment retirement plans: $20,911 (reported on 1.3% of returns)
92008:
$20,911
California:
$24,530
(% of AGI for various income ranges: 0.2% for AGIs $25k-50k, 0.3% for AGIs $75k-100k, 0.3% for AGIs $100k-200k, 0.4% for AGIs over 200k)
Total itemized deductions: $43,978 (26% of AGI, reported on 40.6% of returns)
Here:
$43,978
State:
$34,004
Here:
25.9% of AGI
State:
22.7% of AGI
(% of AGI for various income ranges: 18.8% for AGIs below $25k, 12.1% for AGIs $25k-50k, 14.2% for AGIs $50k-75k, 17.8% for AGIs $75k-100k, 19.7% for AGIs $100k-200k, 23.5% for AGIs over 200k)
Charity contributions: $5,555 (reported on 33.9% of returns)
Here:
$5,555
State:
$4,659
(% of AGI for various income ranges: 0.8% for AGIs below $25k, 1.0% for AGIs $25k-50k, 1.4% for AGIs $50k-75k, 1.8% for AGIs $75k-100k, 2.0% for AGIs $100k-200k, 2.8% for AGIs over 200k)
Taxes paid: $15,885 (reported on 40.4% of returns)
92008:
$15,885
State:
$14,448
(% of AGI for various income ranges: 3.1% for AGIs below $25k, 2.6% for AGIs $25k-50k, 3.6% for AGIs $50k-75k, 5.6% for AGIs $75k-100k, 7.6% for AGIs $100k-200k, 9.4% for AGIs over 200k)
Earned income credit: $1,660 (reported on 10.5% of returns)
Here:
$1,660
State:
$2,286
(% of AGI for various income ranges: 3.3% for AGIs below $25k, 0.5% for AGIs $25k-50k)
Percentage of individuals using paid preparers for their 2012 taxes: 57.8%
Here:
58%
State:
64%
(% for various income ranges: 51.6% for AGIs below $25k, 51.5% for AGIs $25k-50k, 57.2% for AGIs $50k-75k, 63.7% for AGIs $75k-100k, 67.4% for AGIs $100k-200k, 77.9% for AGIs over 200k)
Averages for the 2004 tax year for zip code 92008, filed in 2005:
Average Adjusted Gross Income (AGI) in 2004: $68,046 (Individual Income Tax Returns)
Here:
$68,046
State:
$58,600
Salary/wage: $56,239 (reported on 78.1% of returns)
Here:
$56,239
State:
$49,455
(% of AGI for various income ranges: 69.9% for AGIs $10k-25k, 75.0% for AGIs $25k-50k, 71.5% for AGIs $50k-75k, 73.1% for AGIs $75k-100k, 57.3% for AGIs over 100k)
Taxable interest for individuals: $2,342 (reported on 56.0% of returns)
This zip code:
$2,342
California:
$2,365
(% of AGI for various income ranges: 3.3% for AGIs $10k-25k, 2.3% for AGIs $25k-50k, 1.9% for AGIs $50k-75k, 1.7% for AGIs $75k-100k, 1.6% for AGIs over 100k)
Taxable dividends: $3,648 (reported on 33.7% of returns)
Here:
$3,648
State:
$4,746
(% of AGI for various income ranges: 2.7% for AGIs $10k-25k, 1.7% for AGIs $25k-50k, 2.1% for AGIs $50k-75k, 1.6% for AGIs $75k-100k, 1.6% for AGIs over 100k)
Net capital gain/loss: +$18,388 (reported on 30.3% of returns)
Here:
+$18,388
State:
+$23,418
(% of AGI for various income ranges: -0.1% for AGIs $10k-25k, 0.5% for AGIs $25k-50k, 1.0% for AGIs $50k-75k, 1.8% for AGIs $75k-100k, 13.1% for AGIs over 100k)
Profit/loss from business: +$18,202 (reported on 19.6% of returns)
Here:
+$18,202
State:
+$16,826
(% of AGI for various income ranges: 9.3% for AGIs $10k-25k, 5.2% for AGIs $25k-50k, 4.8% for AGIs $50k-75k, 6.0% for AGIs $75k-100k, 4.6% for AGIs over 100k)
IRA payment deduction: $3,405 (reported on 3.7% of returns)
92008:
$3,405
California:
$3,192
(% of AGI for various income ranges: 0.2% for AGIs $10k-25k, 0.3% for AGIs $25k-50k, 0.3% for AGIs $50k-75k, 0.3% for AGIs $75k-100k, 0.1% for AGIs over 100k)
Self-employed pension: $14,880 (reported on 2.0% of returns)
Here:
$14,880
California:
$17,688
(% of AGI for various income ranges: 0.1% for AGIs $10k-25k, 0.2% for AGIs $25k-50k, 0.2% for AGIs $50k-75k, 0.5% for AGIs $75k-100k, 0.5% for AGIs over 100k)
Total itemized deductions: $31,090 (26% of AGI, reported on 44.7% of returns)
Here:
$31,090
State:
$28,113
Here:
25.7% of AGI
State:
25.3% of AGI
(% of AGI for various income ranges: 16.7% for AGIs $10k-25k, 16.7% for AGIs $25k-50k, 21.1% for AGIs $50k-75k, 23.1% for AGIs $75k-100k, 20.3% for AGIs over 100k)
Charity contributions deductions: $3,759 (3% of AGI, reported on 39.9% of returns)
Here:
$3,759
State:
$3,923
Here:
3.0% of AGI
State:
3.3% of AGI
(% of AGI for various income ranges: 1.3% for AGIs $10k-25k, 1.5% for AGIs $25k-50k, 2.1% for AGIs $50k-75k, 2.4% for AGIs $75k-100k, 2.4% for AGIs over 100k)
Total tax: $12,017 (reported on 81.3% of returns)
92008:
$12,017
State:
$10,761
(% of AGI for various income ranges: 5.1% for AGIs $10k-25k, 8.1% for AGIs $25k-50k, 9.9% for AGIs $50k-75k, 10.6% for AGIs $75k-100k, 18.0% for AGIs over 100k)
Earned income credit: $1,464 (reported on 7.9% of returns)
Here:
$1,464
State:
$1,763
Percentage of individuals using paid preparers for their 2004 taxes: 61.1%
Here:
61%
State:
66%
(% for various income ranges: 51.8% for AGIs below $10k, 57.4% for AGIs $10k-25k, 58.6% for AGIs $25k-50k, 64.4% for AGIs $50k-75k, 66.5% for AGIs $75k-100k, 71.8% for AGIs over 100k)
Likely homosexual households (counted as self-reported same-sex unmarried-partner households)
Lesbian couples: 0.0% of all households
Gay men: 0.4% of all households
Household received Food Stamps/SNAP in the past 12 months: 539 Household did not receive Food Stamps/SNAP in the past 12 months: 11,210
Women who had a birth in the past 12 months: 146 (105 now married, 41 unmarried) Women who did not have a birth in the past 12 months: 5,554 (2,680 now married, 2,854 unmarried)
Housing units in zip code 92008 with a mortgage: 3,830 (627 second mortgage, 16 home equity loan, 518 both second mortgage and home equity loan) Houses without a mortgage: 88
Median monthly owner costs for units with a mortgage: $3,297 Median monthly owner costs for units without a mortgage: $862
Residents with income below the poverty level in 2022:
This zip code:
8.5%
Whole state:
12.2%
Residents with income below 50% of the poverty level in 2022:
This zip code:
4.7%
Whole state:
6.2%
Median number of rooms in houses and condos:
Here:
6.2
State:
6.0
Median number of rooms in apartments:
Here:
3.8
State:
3.9
Notable locations in this zip code not listed on our city pages
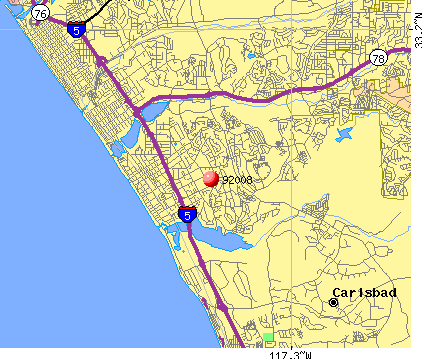
Notable locations in zip code 92008: Encina Power Plant (A), Magee House (B), Carlsbad Visitors Center (C), Carlsbad Senior Center (D), Carlsbad City Library (E), Carlsbad City Hall (F), Carlsbad Chamber of Commerce (G), Mercy Air Transport (H), City of Carlsbad Fire Department Station 1 (I). Display/hide their locations on the map
Churches in zip code 92008 include: First Baptist Church of Carlsbad (A), Beautiful Saviour Evangelical Lutheran Church (B), Carlsbad Community Church (C), The Church of Jesus Christ of Latter Day Saints (D), Crossorads Community Church (E), First Church of Christ Scientist (F), Full Gospel Mission (G), Las Flores Church of the Nazarenes (H), Pilgrim Congregational Church (I). Display/hide their locations on the map
Parks in zip code 92008 include: Carlsbad State Beach (1), Chase Field (2), Holiday Park (3), Canyon Park (4), Car Country Park (5), Encino Public Fishing Area (6), Laguna Riviera City Park (7), Community Center Park (8), Magee Park (9). Display/hide their locations on the map
3,330 married couples with children.
747 single-parent households (129 men, 618 women).
81.5% of residents of 92008 zip code speak English at home.
11.9% of residents speak Spanish at home (51% very well, 19% well, 23% not well, 7% not at all).
4.6% of residents speak other Indo-European language at home (75% very well, 23% well, 2% not well).
1.6% of residents speak Asian or Pacific Island language at home (70% very well, 18% well, 12% not well).
0.1% of residents speak other language at home (100% very well).
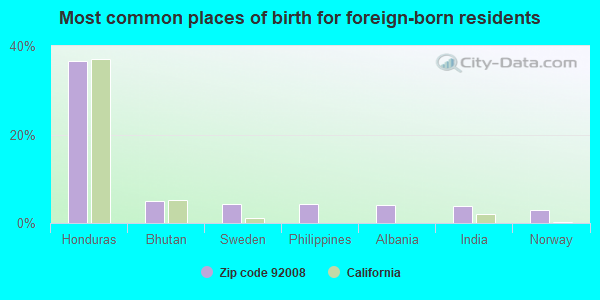
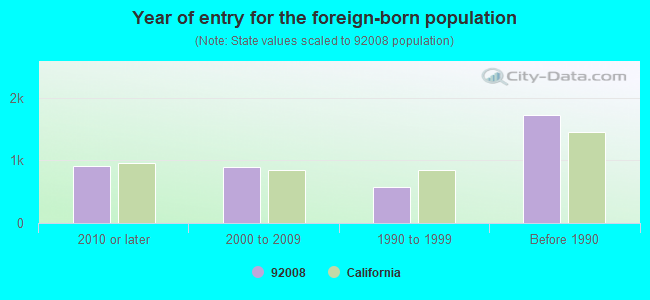
Foreign born population: 3,729 (13.7%) (62.0% of them are naturalized citizens)
Major facilities with environmental interests located in this zip code:
ENCINA POWER PLANT (4600 CARLSBAD BOULEVARD in CARLSBAD, CA)
AIR MAJOR (AIRS/AFS) AIR PROGRAM (Clean Air Markets Division Business System) STATE MASTER (California - Hazardous Waste Tracking) - HAZARDOU WASTE PROGRAM COMPLIANCE ACTIVITY (Tracking inspections of insecticide, fungicide, and rodenticide, and toxic substances) CRITERIA AND HAZARDOUS AIR POLLUTANT INVENTORY (Inventory of air pollution sources) National Pollutant Discharge Elimination System MAJOR (Tracking pollutant discharge elimination systems) - permit HAZARDOUS WASTE BIENNIAL REPORTER (Resource Conservation and Recovery Act (tracking hazardous waste)) Large Quantity Generators, more that 1000 kg of hazardous waste/month (Resource Conservation and Recovery Act (tracking hazardous waste)) TRI REPORTER (Tracking of toxic chemicals releasing facilities) Business SIC classification: ELECTRIC SERVICES; ELECTRIC AND OTHER SERVICES COMBINED Business NAICS classification: FOSSIL FUEL ELECTRIC POWER GENERATION. Organizations: NRG CABRILLO POWER OPERATIONS INC. (CONTACT/OPERATOR)
, CABRILLO POWER I LLC (CONTACT/OWNER)
, CABRILLO POWER I, LLC (OWNER/OPERATOR)
Alternative names: CABRILLO POWER I L.L.C. ENCINA POWER PLANT, CABRILLO POWER I LLC, CABRILLO POWER I LLC (ENCINA), CABRILLO POWER I LLC ENCINA POWER PLANT, CABRILLO POWER ILLC ENCINA POWER PLANT, SAN DIEGO GAS & ELEC ENCINA PWR PLNT, SDG & E CO/ENCINA PLANT
MELLES GRIOT LASER DIVISION (2251 RUTHERFORD RD in CARLSBAD, CA)
(Integrated Compliance Information System) - ICIS-09-1995-0022, FORMAL ENFORCEMENT ACTION National Pollutant Discharge Elimination System NON-MAJOR (Tracking pollutant discharge elimination systems) - permit National Pollutant Discharge Elimination System NON-MAJOR (Tracking pollutant discharge elimination systems) - permit HAZARDOUS WASTE BIENNIAL REPORTER (Resource Conservation and Recovery Act (tracking hazardous waste)) Small Quantity Generators, between 100 kg and 1000 kg of hazardous waste/month (Resource Conservation and Recovery Act (tracking hazardous waste)) - notification Business SIC classification: ELECTRICAL MACHINERY, EQUIPMENT, AND SUPPLIES; OPTICAL INSTRUMENTS AND LENSES Business NAICS classification: OPTICAL INSTRUMENT AND LENS MANUFACTURING.; LABORATORY APPARATUS AND FURNITURE MANUFACTURING. Organizations: MELLES INC (CONTACT/OWNER)
Alternative names: MCDONNELL DOUGLAS, MELLOS GRIOT
CALLAWAY GOLF COMPANY (2285 RUTHERFORD RD. in CARLSBAD, CA)
AIR MAJOR (AIRS/AFS) STATE MASTER (California - Hazardous Waste Tracking) - HAZARDOU WASTE PROGRAM CRITERIA AND HAZARDOUS AIR POLLUTANT INVENTORY (Inventory of air pollution sources) HAZARDOUS WASTE BIENNIAL REPORTER (Resource Conservation and Recovery Act (tracking hazardous waste)) Large Quantity Generators, more that 1000 kg of hazardous waste/month (Resource Conservation and Recovery Act (tracking hazardous waste)) TRI REPORTER (Tracking of toxic chemicals releasing facilities) Business SIC classification: SPORTING AND ATHLETIC GOODS
CALLAWAY GOLF BALL CO (2180 RUTHERFORD RD in CARLSBAD, CA)
STATE MASTER (California - Hazardous Waste Tracking) - HAZARDOU WASTE PROGRAM CRITERIA AND HAZARDOUS AIR POLLUTANT INVENTORY (Inventory of air pollution sources) HAZARDOUS WASTE BIENNIAL REPORTER (Resource Conservation and Recovery Act (tracking hazardous waste)) Large Quantity Generators, more that 1000 kg of hazardous waste/month (Resource Conservation and Recovery Act (tracking hazardous waste)) - notification TRI REPORTER (Tracking of toxic chemicals releasing facilities) Business SIC classification: SPORTING AND ATHLETIC GOODS Organizations: CALLAWAY GOLF COMPANY (CONTACT/OPERATOR)
Alternative names: CALLAWAY GOLF CO
ACUSHNET CO (2819 LOKER AVE E in CARLSBAD, CA)
STATE MASTER (California - Hazardous Waste Tracking) - HAZARDOU WASTE PROGRAM CRITERIA AND HAZARDOUS AIR POLLUTANT INVENTORY (Inventory of air pollution sources) HAZARDOUS WASTE BIENNIAL REPORTER (Resource Conservation and Recovery Act (tracking hazardous waste)) Large Quantity Generators, more that 1000 kg of hazardous waste/month (Resource Conservation and Recovery Act (tracking hazardous waste)) - notification TRI REPORTER (Tracking of toxic chemicals releasing facilities) Business SIC classification: SPORTING AND ATHLETIC GOODS Organizations: ACUSHNET COMPANY (CONTACT/OPERATOR)
CHEVRON STATION NO 91312 (2500 EL CAMINO REAL in CARLSBAD, CA)
STATE MASTER (California - Hazardous Waste Tracking) - HAZARDOU WASTE PROGRAM CRITERIA AND HAZARDOUS AIR POLLUTANT INVENTORY (Inventory of air pollution sources) Large Quantity Generators, more that 1000 kg of hazardous waste/month (Resource Conservation and Recovery Act (tracking hazardous waste)) Business SIC classification: GASOLINE SERVICE STATIONS Organizations: CHEVRON PRODUCTS CO. (CONTACT/OPERATOR)
ISIS PHARMACEUTICALS (2280 FARADAY AVE. in CARLSBAD, CA)
STATE MASTER (California - Hazardous Waste Tracking) - HAZARDOU WASTE PROGRAM HAZARDOUS WASTE BIENNIAL REPORTER (Resource Conservation and Recovery Act (tracking hazardous waste)) Large Quantity Generators, more that 1000 kg of hazardous waste/month (Resource Conservation and Recovery Act (tracking hazardous waste)) Organizations: DIVERSIFIED PROPERTIES (CONTACT/OWNER)
KEN GRODY PONTIAC MAZDA GMC (5445 PASEO DEL NORTE in CARLSBAD, CA)
AIR MINOR (AIRS/AFS) STATE MASTER (California - Hazardous Waste Tracking) - HAZARDOU WASTE PROGRAM Small Quantity Generators, between 100 kg and 1000 kg of hazardous waste/month (Resource Conservation and Recovery Act (tracking hazardous waste)) - notification Business SIC classification: GENERAL AUTOMOTIVE REPAIR SHOPS Alternative names: JIM FINNEY
CAL WORTHINGTON DODGE (5548 PASEO DEL NORTE in CARLSBAD, CA)
STATE MASTER (California - Hazardous Waste Tracking) - HAZARDOU WASTE PROGRAM Small Quantity Generators, between 100 kg and 1000 kg of hazardous waste/month (Resource Conservation and Recovery Act (tracking hazardous waste)) Small Quantity Generators, between 100 kg and 1000 kg of hazardous waste/month (Resource Conservation and Recovery Act (tracking hazardous waste)) Organizations: MEISTER HOWARD (CONTACT/OWNER)
Alternative names: MEISTER DODGE, WORTHINGTON DODGE OF CARLSBAD INC
STATE MASTER (California - Hazardous Waste Tracking) - HAZARDOU WASTE PROGRAM CRITERIA AND HAZARDOUS AIR POLLUTANT INVENTORY (Inventory of air pollution sources) Small Quantity Generators, between 100 kg and 1000 kg of hazardous waste/month (Resource Conservation and Recovery Act (tracking hazardous waste)) - notification Business SIC classification: GASOLINE SERVICE STATIONS Organizations: CHEVRON PRODUCTS CO (CONTACT/OWNER)
Alternative names: CHEVRON STATION NO 93320
CHEVRON - CARLSBAD VILLAGE DR (1044 CARLSBAD VILLAGE DRIVE in CARLSBAD, CA)
STATE MASTER (California - Hazardous Waste Tracking) - HAZARDOU WASTE PROGRAM CRITERIA AND HAZARDOUS AIR POLLUTANT INVENTORY (Inventory of air pollution sources) Small Quantity Generators, between 100 kg and 1000 kg of hazardous waste/month (Resource Conservation and Recovery Act (tracking hazardous waste)) - notification Business SIC classification: GASOLINE SERVICE STATIONS Organizations: CHEVRON PRODUCTS CO (CONTACT/OWNER)
Alternative names: CHEVRON STATION NO 92321
KAISER ELECTRO OPTICS INC (2752 LOKER AVE WEST in CARLSBAD, CA)
STATE MASTER (California - Hazardous Waste Tracking) - HAZARDOU WASTE PROGRAM Small Quantity Generators, between 100 kg and 1000 kg of hazardous waste/month (Resource Conservation and Recovery Act (tracking hazardous waste)) - notification TRI REPORTER (Tracking of toxic chemicals releasing facilities) Business SIC classification: SEARCH, DETECTION, NAVIGATION, GUIDANCE, AERONAUTICAL, AND NAUTICAL SYSTEMS AND INSTRUMENTS Organizations: ROCKWELL COLLINS (CONTACT/OWNER)
Alternative names: ROCKWELL COLLINS OPTRONICS
CALTRANS CARLSBAD MAINT STATION (6050 PASEO DEL NORTE in CARLSBAD, CA)
STATE MASTER (California - Hazardous Waste Tracking) - HAZARDOU WASTE PROGRAM Small Quantity Generators, between 100 kg and 1000 kg of hazardous waste/month (Resource Conservation and Recovery Act (tracking hazardous waste)) - notification Alternative names: CALTRANS DISTRICT 11-CARLSBAD MAINT STAT
Housing units lacking complete plumbing facilities: 0.8% Housing units lacking complete kitchen facilities: 1.2%
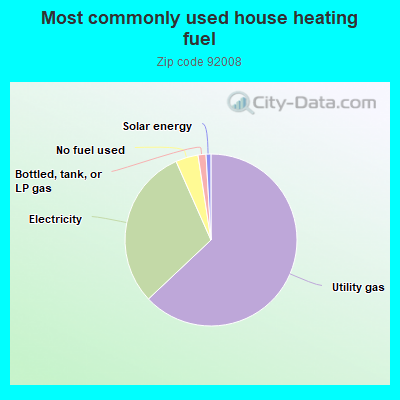
62.6%Utility gas
30.2%Electricity
4.2%No fuel used
1.5%Bottled, tank, or LP gas
0.9%Solar energy
Population in 1990: 35,651.
Place of birth for U.S.-born residents:
This state: 14,849
Northeast: 2,107
Midwest: 2,550
South: 1,732
West: 1,623
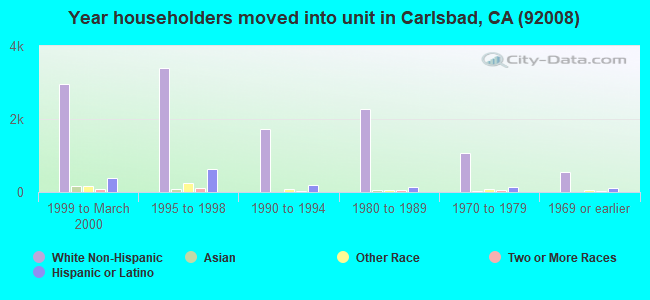
49% of the 92008 zip code residents lived in the same house 5 years ago. Out of people who lived in different houses, 64% lived in this county. Out of people who lived in different counties, 50% lived in California.
82% of the 92008 zip code residents lived in the same house 1 year ago. Out of people who lived in different houses, 69% moved from this county. Out of people who lived in different houses, 9% moved from different county within same state. Out of people who lived in different houses, 13% moved from different state. Out of people who lived in different houses, 5% moved from abroad.
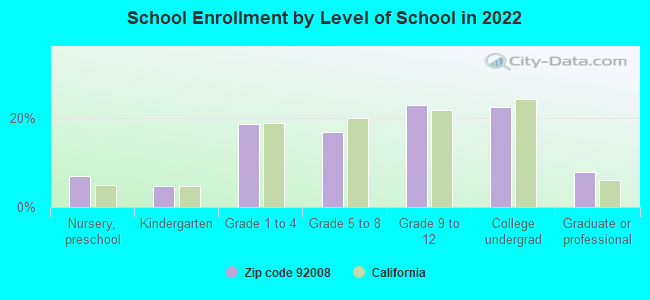
Private vs. public school enrollment:
Students in private schools in grades 1 to 8 (elementary and middle school): 182
Here:
9.1%
California:
10.5%
Students in private schools in grades 9 to 12 (high school): 191
Here:
14.8%
California:
8.5%
Students in private undergraduate colleges: 257
Here:
20.3%
California:
15.9%
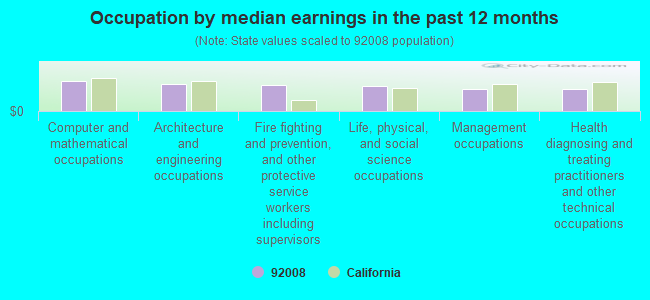
Occupation by median earnings in the past 12 months ($)
119,468Computer and mathematical occupations
107,736Architecture and engineering occupations
104,009Fire fighting and prevention, and other protective service workers including supervisors
97,345Life, physical, and social science occupations
88,633Management occupations
87,201Health diagnosing and treating practitioners and other technical occupations
Companies with biggest federal contracts located in this zip code (CARLSBAD, CA):
CAMP DRESSER & MC KEE INC (1925 PALOMAR OAKS WAY STE) : $91,196,551 in 16 contractsfrom 2004 to 2006
Contracts for Construction of Structures and Facilities -- Office Buildings, Construction of Structures and Facilities -- Sewage and Waste Facilities, Construction of Structures and Facilities -- Waste Treatment and Storage Facilities, A&E Management Engineering Services by Navy Signed by year:2000: $0; 2001: $0; 2002: $0; 2003: $0; 2004: $51,189,968; 2005: $11,075,874; 2006: $28,930,709.
Biggest contracts:
$21,200,000 with Navy for Construction of Structures and Facilities -- Office Buildings. Signed on 2006-02-27. Completion date: 2008-03-03.
$20,648,434 with Navy for Construction of Structures and Facilities -- Sewage and Waste Facilities. Signed on 2004-12-28. Completion date: 2006-07-10.
$19,849,000, same as above.Signed on 2004-07-08. Completion date: 2006-07-10.
$7,208,534 with Navy for Construction of Structures and Facilities -- Waste Treatment and Storage Facilities. Signed on 2004-12-28. Completion date: 2006-08-31.
PAVE-TECH INC (4516 SALISBURY DRIVE; small business) : $48,884,629 in 305 contractsfrom 2000 to 2006
Contracts for Maintenance, Repair or Alteration of Real Property -- Miscellaneous Buildings, Maintenance, Repair or Alteration of Real Property -- Highways, Roads, Streets, Bridges, and Railways (includes resurfacing), Maintenance, Repair or Alteration of Real Property -- Airport Runways, Construction of Structures and Facilities -- Highways, Roads, Streets, Bridges, and Railways (includes resurfacing), and moreby Navy, Air Force, Army Signed by year:2000: $2,458,361; 2001: $4,245,622; 2002: $7,815,191; 2003: $11,117,751; 2004: $5,769,306; 2005: $16,116,441; 2006: $1,361,957.
Biggest contracts:
$3,947,225 with Navy for Maintenance, Repair or Alteration of Real Property -- Miscellaneous Buildings. Signed on 2005-05-27. Completion date: 2005-09-30.
$3,530,709 with Air Force for Maintenance, Repair or Alteration of Real Property -- Highways, Roads, Streets, Bridges, and Railways (includes resurfacing). Taking place in NV. Signed on 2003-07-08. Completion date: 2004-02-14.
$3,126,407 with Navy for Maintenance, Repair or Alteration of Real Property -- Highways, Roads, Streets, Bridges, and Railways (includes resurfacing). Signed on 2002-06-28. Completion date: 2002-12-27.
$2,432,000 with Navy for Maintenance, Repair or Alteration of Real Property -- Airport Runways. Taking place in NV. Signed on 2000-09-25. Completion date: 2001-08-14.
XENONICS INC (2236 RUTHERFORD RD STE 123; small business) : $14,203,966 in 29 contractsfrom 2001 to 2006
Contracts for Miscellaneous Alarm, Signal and Security Detection Systems, Electric Portable and Hand Lighting Equipment, Night Vision Equipment, Emitted and Reflected Radiation, Electric Lamps, and moreby Army, Navy, Defense Logistics Agency, Minerals Management Service, and others Signed by year:2000: $0; 2001: $127,504; 2002: $30,704; 2003: $5,945,133; 2004: $3,963,006; 2005: $2,953,372; 2006: $1,184,247.
Biggest contracts:
$3,398,805 with Army for Miscellaneous Alarm, Signal and Security Detection Systems. Signed on 2004-01-12. Completion date: 2004-09-30.
$2,983,133, same as above.Signed on 2003-03-26. Completion date: 2003-12-26.
$2,943,981 with Navy for Electric Portable and Hand Lighting Equipment. Signed on 2005-06-06. Completion date: 2005-09-04.
$1,953,155 with Army for Miscellaneous Alarm, Signal and Security Detection Systems. Signed on 2003-12-19. Completion date: 2004-03-31.
PALOMAR DISPLAY PRODUCTS (1945 KELLOGG AVE; small business) : $13,652,652 in 35 contractsfrom 2002 to 2006
Contracts for Optical Sighting and Ranging Equipment, Miscellaneous Aircraft Accessories and Components, Electrical and Electronic assemblies, Boards, Cards, and Associated Hardware, Night Vision Equipment, Emitted and Reflected Radiation, and moreby Army, Department of Defense, Navy, Defense Logistics Agency, and others Signed by year:2000: $0; 2001: $0; 2002: $376,417; 2003: $133,723; 2004: $122,337; 2005: $9,680,449; 2006: $3,339,726.
Biggest contracts:
$4,178,678 with Army for Optical Sighting and Ranging Equipment. Signed on 2005-08-30. Completion date: 2008-07-31.
$3,487,062, same as above.Signed on 2005-08-30. Completion date: 2008-07-31.
$2,315,535, same as above.Signed on 2006-03-21. Completion date: 2008-07-31.
$1,156,217, same as above.Signed on 2005-11-28. Completion date: 2008-07-31.
IPICOM, INC (2330 FARADAY AVE; small business) : $8,160,245 in 46 contractsfrom 2001 to 2006
Contracts for Defense Electronics and Communication Equipment -- Applied Research and Exploratory Development (R&D), Defense Aircraft -- Management and Support (R&D), Defense Electronics and Communication Equipment -- Basic Research (R&D), Other Research and Development -- Basic Research (R&D), and moreby Navy, Air Force, Army, U.S. Special Operations Command, and others Signed by year:2000: $0; 2001: $1,850,881; 2002: $2,054,561; 2003: $1,354,684; 2004: $1,170,780; 2005: $806,826; 2006: $922,513.
Biggest contracts:
$749,949 with Navy for Defense Electronics and Communication Equipment -- Applied Research and Exploratory Development (R&D). Signed on 2001-05-24. Completion date: 2002-05-23.
$600,000 with Air Force for Defense Aircraft -- Management and Support (R&D). Signed on 2003-05-23. Completion date: 2005-09-15.
$449,949 with Navy for Defense Electronics and Communication Equipment -- Applied Research and Exploratory Development (R&D). Signed on 2002-04-04. Completion date: 2003-03-24.
$405,522 with Army for Defense Electronics and Communication Equipment -- Basic Research (R&D). Signed on 2002-12-30. Completion date: 2004-12-31.
APPLIED COMPUTER RESEARCH, INC (3101 VIA SOMBRA; small business) : $4,578,936 in 2 contractsin 2000
$4,533,600 with Navy for ADP Central Processing Unit (CPU, Computer), Digital. Signed on 2000-05-23. Completion date: 2003-05-22.
$45,336, same as above.Signed on 2000-05-25. Completion date: 2000-08-25.
ROCKWELL COLLINS OPTRONICS, IN (2752 LOKER AVE W; small business) : $4,277,625 in 45 contractsfrom 1999 to 2006
Contracts for Optoelectronic Devices and Associated Hardware, ADP Input/Output and Storage Devices, Optical Instruments, Test Equipment, Components and Accessories, Miscellaneous Communication Equipment, and moreby Army, Navy, Defense Logistics Agency, Minerals Management Service, and others Signed by year:2000: $751,879; 2001: $572,722; 2002: $2,654,678; 2003: -$661,742; 2004: $289,580; 2005: $258,092; 2006: $35,816.
Biggest contracts:
$2,295,150 with Army for Optoelectronic Devices and Associated Hardware. Signed on 2002-03-05. Completion date: 2002-09-19.
$376,600 with Navy for ADP Input/Output and Storage Devices. Signed on 1999-10-06. Completion date: 2000-10-02.
$307,090 with Defense Logistics Agency for Optical Instruments, Test Equipment, Components and Accessories. Signed on 2000-09-20. Completion date: 2001-03-11.
$177,375 with Defense Logistics Agency for Miscellaneous Communication Equipment. Signed on 2001-06-14. Completion date: 2002-03-16.
ELECTRONIC-CO, INC (5770 ARMADA DRIVE) : $4,245,068 in 7 contractsfrom 2003 to 2006
Contracts for Prefabricated and Portable Buildings, ADP Components, Services -- Management and Support (R&D), Nonwood Construction Lumber and Related Materials by Navy, Offices, Boards and Divisions (includes Attorney General, Deputy Attorney General, etc.), Office of Policy, Management and Budget/Chief Financial Officer Signed by year:2000: $0; 2001: $0; 2002: $0; 2003: $2,702,304; 2004: $0; 2005: $1,542,764; 2006: $0.
Biggest contracts:
$2,674,539 with Navy for Prefabricated and Portable Buildings. Taking place in MI. Signed on 2003-09-30. Completion date: 2004-02-04.
$1,225,632 with Offices, Boards and Divisions (includes Attorney General, Deputy Attorney General, etc.) for ADP Components. Taking place in DC. Signed on 2005-10-01. Completion date: 2006-09-30.
$235,530 with Office of Policy, Management and Budget/Chief Financial Officer for Services -- Management and Support (R&D). Taking place in GA. Signed on 2005-07-24. Effective on 2005-08-01. Completion date: 2006-07-31.
$81,602 with Offices, Boards and Divisions (includes Attorney General, Deputy Attorney General, etc.) for ADP Components. Taking place in DC. Signed on 2005-10-01. Completion date: 2006-09-30.
CDM CONSTRUCTORS INC (1925 PALOMAR OAKS WAY)
$3,484,000 with Navy for Construction of Structures and Facilities -- Office Buildings. Signed on 2004-09-29. Completion date: 2006-05-02.
EMS CONSTRUCTION, INC (5909 SEA LION PLACE, SUITE; small business) : $2,313,783 in 10 contractsfrom 2000 to 2001
Contracts for Maintenance, Repair or Alteration of Real Property -- Other Non-Building Facilities, Maintenance, Repair or Alteration of Real Property -- Miscellaneous Buildings by Air Force, Navy Signed by year:2000: $2,314,812; 2001: -$1,029; 2002: $0; 2003: $0; 2004: $0; 2005: $0; 2006: $0.
Biggest contracts:
$2,081,040 with Air Force for Maintenance, Repair or Alteration of Real Property -- Other Non-Building Facilities. Taking place in UT. Signed on 2000-04-24. Completion date: 2000-10-31.
$116,561, same as above.Signed on 2000-06-22. Completion date: 2000-11-14.
$42,606, same as above.Signed on 2000-09-30. Completion date: 2000-11-14.
$32,368 with Navy for Maintenance, Repair or Alteration of Real Property -- Miscellaneous Buildings. Signed on 2000-03-20. Completion date: 2000-04-11.
Top industries in this zip code by the number of employees in 2005:
Professional, Scientific, and Technical Services: Research and Development in the Physical, Engineering, and Life Sciences (250-499: 1, 100-249: 1, 20-49: 5, 10-19: 2, 5-9: 6, 1-4: 14)
People in group quarters in 2010:
313 people in nursing facilities/skilled-nursing facilities
287 people in workers' group living quarters and job corps centers
76 people in other noninstitutional facilities
People in group quarters in 2000:
530 people in nursing homes
124 people in other noninstitutional group quarters
16 people in agriculture workers' dormitories on farms
6 people in homes or halfway houses for drug/alcohol abuse
Fatal accident statistics in 2014:
Fatal accident count: 4
Vehicles involved in fatal accidents: 4
Fatal accidents caused by drunken drivers: 1
Fatalities: 5
Persons involved in fatal accidents: 8
Pedestrians involved in fatal accidents: 5
Fatal accident statistics in 2013:
Fatal accident count: 1
Vehicles involved in fatal accidents: 2
Fatal accidents caused by drunken drivers: 0
Fatalities: 1
Persons involved in fatal accidents: 4
Pedestrians involved in fatal accidents: 0
Home Mortgage Disclosure Act Aggregated Statistics For Year 2009 (Based on 12 full and 8 partial tracts)
A) FHA, FSA/RHS & VA Home Purchase Loans
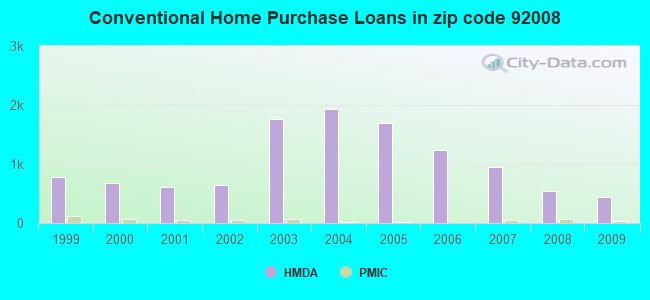
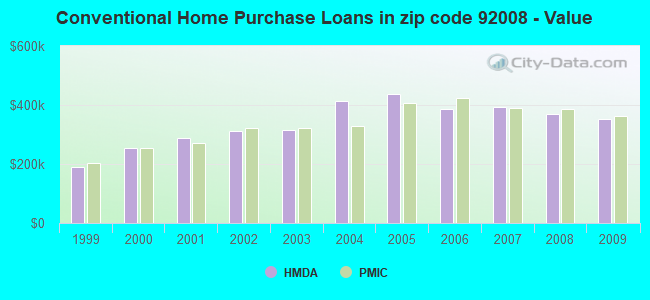
B) Conventional Home Purchase Loans
C) Refinancings
D) Home Improvement Loans
E) Loans on Dwellings For 5+ Families
F) Non-occupant Loans on < 5 Family Dwellings (A B C & D)
G) Loans On Manufactured Home Dwelling (A B C & D)
Number
Average Value
Number
Average Value
Number
Average Value
Number
Average Value
Number
Average Value
Number
Average Value
Number
Average Value
LOANS ORIGINATED
198
$413,360
443
$352,044
2,085
$332,953
69
$287,179
11
$2,736,806
308
$312,944
9
$217,242
APPLICATIONS APPROVED, NOT ACCEPTED
12
$414,960
56
$382,434
210
$392,086
11
$150,640
0
$0
33
$333,749
2
$90,230
APPLICATIONS DENIED
35
$396,235
86
$387,246
627
$396,018
27
$130,592
0
$0
113
$407,069
19
$164,779
APPLICATIONS WITHDRAWN
24
$414,119
84
$400,722
405
$356,373
22
$291,196
2
$7,483,720
58
$355,706
5
$162,754
FILES CLOSED FOR INCOMPLETENESS
7
$235,866
13
$447,684
102
$441,034
3
$44,673
2
$349,930
13
$345,045
0
$0
Aggregated Statistics For Year 2008 (Based on 12 full and 8 partial tracts)
A) FHA, FSA/RHS & VA Home Purchase Loans
B) Conventional Home Purchase Loans
C) Refinancings
D) Home Improvement Loans
E) Loans on Dwellings For 5+ Families
F) Non-occupant Loans on < 5 Family Dwellings (A B C & D)
G) Loans On Manufactured Home Dwelling (A B C & D)
Number
Average Value
Number
Average Value
Number
Average Value
Number
Average Value
Number
Average Value
Number
Average Value
Number
Average Value
LOANS ORIGINATED
52
$446,245
550
$370,457
833
$362,733
43
$247,491
18
$2,059,578
279
$357,342
24
$178,924
APPLICATIONS APPROVED, NOT ACCEPTED
8
$433,386
115
$382,763
206
$363,539
12
$140,075
0
$0
61
$310,250
15
$106,719
APPLICATIONS DENIED
9
$376,344
133
$477,066
394
$379,954
38
$153,690
0
$0
94
$307,267
11
$197,765
APPLICATIONS WITHDRAWN
12
$302,520
108
$394,103
230
$374,287
17
$197,873
2
$1,480,745
66
$336,045
1
$147,590
FILES CLOSED FOR INCOMPLETENESS
5
$487,074
19
$514,247
55
$451,814
4
$240,048
0
$0
10
$458,906
0
$0
Aggregated Statistics For Year 2007 (Based on 12 full and 8 partial tracts)
A) FHA, FSA/RHS & VA Home Purchase Loans
B) Conventional Home Purchase Loans
C) Refinancings
D) Home Improvement Loans
E) Loans on Dwellings For 5+ Families
F) Non-occupant Loans on < 5 Family Dwellings (A B C & D)
G) Loans On Manufactured Home Dwelling (A B C & D)
Number
Average Value
Number
Average Value
Number
Average Value
Number
Average Value
Number
Average Value
Number
Average Value
Number
Average Value
LOANS ORIGINATED
10
$412,872
943
$394,830
1,448
$386,535
147
$258,195
16
$2,165,389
449
$420,169
24
$156,895
APPLICATIONS APPROVED, NOT ACCEPTED
4
$242,355
184
$370,933
372
$391,178
28
$188,945
0
$0
87
$431,654
21
$111,443
APPLICATIONS DENIED
4
$229,575
301
$379,175
689
$444,890
75
$180,636
0
$0
140
$458,575
20
$177,677
APPLICATIONS WITHDRAWN
1
$163,380
102
$415,707
320
$395,885
26
$276,047
1
$892,080
66
$387,168
4
$249,698
FILES CLOSED FOR INCOMPLETENESS
0
$0
40
$431,518
101
$410,468
3
$214,950
0
$0
17
$477,683
0
$0
Aggregated Statistics For Year 2006 (Based on 12 full and 8 partial tracts)
B) Conventional Home Purchase Loans
C) Refinancings
D) Home Improvement Loans
E) Loans on Dwellings For 5+ Families
F) Non-occupant Loans on < 5 Family Dwellings (A B C & D)
G) Loans On Manufactured Home Dwelling (A B C & D)
Number
Average Value
Number
Average Value
Number
Average Value
Number
Average Value
Number
Average Value
Number
Average Value
LOANS ORIGINATED
1,233
$385,337
1,836
$392,591
205
$272,441
14
$5,691,894
449
$415,957
26
$171,721
APPLICATIONS APPROVED, NOT ACCEPTED
291
$368,309
326
$415,122
46
$347,204
0
$0
53
$440,411
13
$164,521
APPLICATIONS DENIED
375
$387,048
602
$493,962
90
$252,074
4
$499,900
152
$445,128
14
$139,040
APPLICATIONS WITHDRAWN
238
$408,732
439
$419,458
37
$300,377
0
$0
61
$410,167
3
$95,697
FILES CLOSED FOR INCOMPLETENESS
40
$462,973
93
$348,821
3
$242,327
0
$0
15
$438,320
1
$239,020
Aggregated Statistics For Year 2005 (Based on 12 full and 8 partial tracts)
B) Conventional Home Purchase Loans
C) Refinancings
D) Home Improvement Loans
E) Loans on Dwellings For 5+ Families
F) Non-occupant Loans on < 5 Family Dwellings (A B C & D)
G) Loans On Manufactured Home Dwelling (A B C & D)
Number
Average Value
Number
Average Value
Number
Average Value
Number
Average Value
Number
Average Value
Number
Average Value
LOANS ORIGINATED
1,699
$436,594
2,215
$388,398
240
$303,784
24
$2,080,378
487
$445,837
23
$164,200
APPLICATIONS APPROVED, NOT ACCEPTED
308
$390,227
323
$360,872
41
$291,881
2
$1,088,705
66
$376,419
21
$106,318
APPLICATIONS DENIED
346
$404,572
591
$418,105
93
$216,618
2
$222,450
109
$414,984
32
$162,081
APPLICATIONS WITHDRAWN
355
$439,023
590
$354,194
49
$200,161
2
$7,034,405
83
$461,172
9
$221,268
FILES CLOSED FOR INCOMPLETENESS
90
$432,503
173
$394,908
15
$170,581
0
$0
20
$393,154
5
$203,274
Aggregated Statistics For Year 2004 (Based on 12 full and 8 partial tracts)
A) FHA, FSA/RHS & VA Home Purchase Loans
B) Conventional Home Purchase Loans
C) Refinancings
D) Home Improvement Loans
E) Loans on Dwellings For 5+ Families
F) Non-occupant Loans on < 5 Family Dwellings (A B C & D)
G) Loans On Manufactured Home Dwelling (A B C & D)
Number
Average Value
Number
Average Value
Number
Average Value
Number
Average Value
Number
Average Value
Number
Average Value
Number
Average Value
LOANS ORIGINATED
2
$252,000
1,929
$412,184
3,211
$330,448
194
$248,357
27
$1,719,832
611
$361,185
22
$153,650
APPLICATIONS APPROVED, NOT ACCEPTED
1
$251,000
307
$438,583
482
$314,012
39
$116,123
0
$0
57
$380,498
10
$148,075
APPLICATIONS DENIED
3
$227,307
391
$464,415
671
$328,315
91
$190,364
0
$0
140
$347,488
29
$133,809
APPLICATIONS WITHDRAWN
0
$0
407
$454,472
599
$310,382
57
$180,559
0
$0
82
$390,116
13
$170,077
FILES CLOSED FOR INCOMPLETENESS
0
$0
97
$398,711
198
$330,503
4
$64,010
0
$0
26
$381,770
7
$52,826
Aggregated Statistics For Year 2003 (Based on 12 full and 8 partial tracts)
A) FHA, FSA/RHS & VA Home Purchase Loans
B) Conventional Home Purchase Loans
C) Refinancings
D) Home Improvement Loans
E) Loans on Dwellings For 5+ Families
F) Non-occupant Loans on < 5 Family Dwellings (A B C & D)
Number
Average Value
Number
Average Value
Number
Average Value
Number
Average Value
Number
Average Value
Number
Average Value
LOANS ORIGINATED
10
$262,078
1,760
$314,935
7,185
$259,799
96
$114,412
35
$1,931,527
1,076
$259,098
APPLICATIONS APPROVED, NOT ACCEPTED
3
$59,440
238
$322,802
829
$262,988
17
$129,024
2
$1,230,710
107
$244,055
APPLICATIONS DENIED
2
$133,700
248
$267,135
930
$279,800
32
$93,391
0
$0
119
$264,966
APPLICATIONS WITHDRAWN
2
$169,410
228
$318,820
1,048
$271,720
29
$105,654
2
$3,290,430
112
$322,327
FILES CLOSED FOR INCOMPLETENESS
0
$0
47
$283,177
198
$294,344
10
$62,230
0
$0
32
$238,830
Aggregated Statistics For Year 2002 (Based on 5 full and 6 partial tracts)
A) FHA, FSA/RHS & VA Home Purchase Loans
B) Conventional Home Purchase Loans
C) Refinancings
D) Home Improvement Loans
E) Loans on Dwellings For 5+ Families
F) Non-occupant Loans on < 5 Family Dwellings (A B C & D)
Number
Average Value
Number
Average Value
Number
Average Value
Number
Average Value
Number
Average Value
Number
Average Value
LOANS ORIGINATED
6
$215,805
650
$311,770
1,882
$283,905
38
$105,403
38
$2,528,568
297
$284,717
APPLICATIONS APPROVED, NOT ACCEPTED
2
$222,955
145
$290,190
318
$273,828
5
$118,462
0
$0
69
$247,997
APPLICATIONS DENIED
0
$0
143
$263,587
246
$284,296
20
$49,221
0
$0
54
$298,672
APPLICATIONS WITHDRAWN
0
$0
103
$282,471
276
$260,058
14
$58,679
6
$4,384,808
38
$311,001
FILES CLOSED FOR INCOMPLETENESS
0
$0
39
$281,835
98
$273,487
0
$0
9
$2,492,224
11
$232,777
Aggregated Statistics For Year 2001 (Based on 5 full and 6 partial tracts)
A) FHA, FSA/RHS & VA Home Purchase Loans
B) Conventional Home Purchase Loans
C) Refinancings
D) Home Improvement Loans
E) Loans on Dwellings For 5+ Families
F) Non-occupant Loans on < 5 Family Dwellings (A B C & D)
Number
Average Value
Number
Average Value
Number
Average Value
Number
Average Value
Number
Average Value
Number
Average Value
LOANS ORIGINATED
5
$162,940
615
$287,864
1,288
$242,866
52
$43,986
11
$806,219
238
$225,039
APPLICATIONS APPROVED, NOT ACCEPTED
0
$0
168
$284,209
208
$250,133
8
$52,426
0
$0
31
$204,476
APPLICATIONS DENIED
1
$464,100
106
$239,776
235
$236,559
26
$81,162
2
$349,930
29
$212,943
APPLICATIONS WITHDRAWN
6
$123,978
87
$264,036
217
$245,302
8
$35,072
2
$2,166,815
18
$232,806
FILES CLOSED FOR INCOMPLETENESS
0
$0
29
$277,686
60
$263,044
0
$0
8
$1,176,214
7
$393,844
Aggregated Statistics For Year 2000 (Based on 5 full and 6 partial tracts)
A) FHA, FSA/RHS & VA Home Purchase Loans
B) Conventional Home Purchase Loans
C) Refinancings
D) Home Improvement Loans
E) Loans on Dwellings For 5+ Families
F) Non-occupant Loans on < 5 Family Dwellings (A B C & D)
Number
Average Value
Number
Average Value
Number
Average Value
Number
Average Value
Number
Average Value
Number
Average Value
LOANS ORIGINATED
12
$183,036
671
$254,873
286
$195,790
55
$47,800
25
$1,752,117
148
$221,036
APPLICATIONS APPROVED, NOT ACCEPTED
0
$0
115
$259,882
60
$226,757
17
$36,852
0
$0
21
$243,439
APPLICATIONS DENIED
2
$213,765
121
$277,116
112
$197,109
24
$52,759
2
$864,825
16
$215,772
APPLICATIONS WITHDRAWN
0
$0
91
$271,132
86
$164,935
9
$176,320
0
$0
10
$218,282
FILES CLOSED FOR INCOMPLETENESS
0
$0
56
$269,354
25
$181,277
0
$0
7
$3,279,734
4
$417,045
Aggregated Statistics For Year 1999 (Based on 5 full and 4 partial tracts)
A) FHA, FSA/RHS & VA Home Purchase Loans
B) Conventional Home Purchase Loans
C) Refinancings
D) Home Improvement Loans
E) Loans on Dwellings For 5+ Families
F) Non-occupant Loans on < 5 Family Dwellings (A B C & D)
2005 - 2018 National Fire Incident Reporting System (NFIRS) incidents
According to the data from the years 2005 - 2018 the average number of fire incidents per year is 46. The highest number of reported fires - 88 took place in 2006, and the least - 15 in 2013. The data has a declining trend.
When looking into fire subcategories, the most incidents belonged to: Structure Fires (52.8%), and Outside Fires (25.3%).
Fire incident types reported to NFIRS in Zip Code 92008


 Nearest zip codes: 92010, 92011, 92056, 92054, 92081, 92083.


 According to the data from the years 2005 - 2018 the average number of fire incidents per year is 46. The highest number of reported fires - 88 took place in 2006, and the least - 15 in 2013. The data has a declining trend.
 When looking into fire subcategories, the most incidents belonged to: Structure Fires (52.8%), and Outside Fires (25.3%).