Oceanside, California Submit your own pictures of this city and show them to the world
OSM Map
General Map
Google Map
MSN Map
OSM Map
General Map
Google Map
MSN Map
OSM Map
General Map
Google Map
MSN Map
OSM Map
General Map
Google Map
MSN Map
Please wait while loading the map...
Population in 2022: 172,199 (100% urban, 0% rural). Population change since 2000: +6.9%Males: 88,416 Females: 83,783
March 2022 cost of living index in Oceanside: 125.0 (high, U.S. average is 100) Percentage of residents living in poverty in 2022: 9.7%for White Non-Hispanic residents , 17.6% for Black residents , 10.6% for Hispanic or Latino residents , 8.8% for American Indian residents , 30.4% for Native Hawaiian and other Pacific Islander residents , 9.7% for other race residents , 7.5% for two or more races residents )
Profiles of local businesses
Business Search - 14 Million verified businesses
Data:
Median household income ($)
Median household income (% change since 2000)
Household income diversity
Ratio of average income to average house value (%)
Ratio of average income to average rent
Median household income ($) - White
Median household income ($) - Black or African American
Median household income ($) - Asian
Median household income ($) - Hispanic or Latino
Median household income ($) - American Indian and Alaska Native
Median household income ($) - Multirace
Median household income ($) - Other Race
Median household income for houses/condos with a mortgage ($)
Median household income for apartments without a mortgage ($)
Races - White alone (%)
Races - White alone (% change since 2000)
Races - Black alone (%)
Races - Black alone (% change since 2000)
Races - American Indian alone (%)
Races - American Indian alone (% change since 2000)
Races - Asian alone (%)
Races - Asian alone (% change since 2000)
Races - Hispanic (%)
Races - Hispanic (% change since 2000)
Races - Native Hawaiian and Other Pacific Islander alone (%)
Races - Native Hawaiian and Other Pacific Islander alone (% change since 2000)
Races - Two or more races (%)
Races - Two or more races (% change since 2000)
Races - Other race alone (%)
Races - Other race alone (% change since 2000)
Racial diversity
Unemployment (%)
Unemployment (% change since 2000)
Unemployment (%) - White
Unemployment (%) - Black or African American
Unemployment (%) - Asian
Unemployment (%) - Hispanic or Latino
Unemployment (%) - American Indian and Alaska Native
Unemployment (%) - Multirace
Unemployment (%) - Other Race
Population density (people per square mile)
Population - Males (%)
Population - Females (%)
Population - Males (%) - White
Population - Males (%) - Black or African American
Population - Males (%) - Asian
Population - Males (%) - Hispanic or Latino
Population - Males (%) - American Indian and Alaska Native
Population - Males (%) - Multirace
Population - Males (%) - Other Race
Population - Females (%) - White
Population - Females (%) - Black or African American
Population - Females (%) - Asian
Population - Females (%) - Hispanic or Latino
Population - Females (%) - American Indian and Alaska Native
Population - Females (%) - Multirace
Population - Females (%) - Other Race
Coronavirus confirmed cases (Apr 26, 2024)
Deaths caused by coronavirus (Apr 26, 2024)
Coronavirus confirmed cases (per 100k population) (Apr 26, 2024)
Deaths caused by coronavirus (per 100k population) (Apr 26, 2024)
Daily increase in number of cases (Apr 26, 2024)
Weekly increase in number of cases (Apr 26, 2024)
Cases doubled (in days) (Apr 26, 2024)
Hospitalized patients (Apr 18, 2022)
Negative test results (Apr 18, 2022)
Total test results (Apr 18, 2022)
COVID Vaccine doses distributed (per 100k population) (Sep 19, 2023)
COVID Vaccine doses administered (per 100k population) (Sep 19, 2023)
COVID Vaccine doses distributed (Sep 19, 2023)
COVID Vaccine doses administered (Sep 19, 2023)
Likely homosexual households (%)
Likely homosexual households (% change since 2000)
Likely homosexual households - Lesbian couples (%)
Likely homosexual households - Lesbian couples (% change since 2000)
Likely homosexual households - Gay men (%)
Likely homosexual households - Gay men (% change since 2000)
Cost of living index
Median gross rent ($)
Median contract rent ($)
Median monthly housing costs ($)
Median house or condo value ($)
Median house or condo value ($ change since 2000)
Mean house or condo value by units in structure - 1, detached ($)
Mean house or condo value by units in structure - 1, attached ($)
Mean house or condo value by units in structure - 2 ($)
Mean house or condo value by units in structure by units in structure - 3 or 4 ($)
Mean house or condo value by units in structure - 5 or more ($)
Mean house or condo value by units in structure - Boat, RV, van, etc. ($)
Mean house or condo value by units in structure - Mobile home ($)
Median house or condo value ($) - White
Median house or condo value ($) - Black or African American
Median house or condo value ($) - Asian
Median house or condo value ($) - Hispanic or Latino
Median house or condo value ($) - American Indian and Alaska Native
Median house or condo value ($) - Multirace
Median house or condo value ($) - Other Race
Median resident age
Resident age diversity
Median resident age - Males
Median resident age - Females
Median resident age - White
Median resident age - Black or African American
Median resident age - Asian
Median resident age - Hispanic or Latino
Median resident age - American Indian and Alaska Native
Median resident age - Multirace
Median resident age - Other Race
Median resident age - Males - White
Median resident age - Males - Black or African American
Median resident age - Males - Asian
Median resident age - Males - Hispanic or Latino
Median resident age - Males - American Indian and Alaska Native
Median resident age - Males - Multirace
Median resident age - Males - Other Race
Median resident age - Females - White
Median resident age - Females - Black or African American
Median resident age - Females - Asian
Median resident age - Females - Hispanic or Latino
Median resident age - Females - American Indian and Alaska Native
Median resident age - Females - Multirace
Median resident age - Females - Other Race
Commute - mean travel time to work (minutes)
Travel time to work - Less than 5 minutes (%)
Travel time to work - Less than 5 minutes (% change since 2000)
Travel time to work - 5 to 9 minutes (%)
Travel time to work - 5 to 9 minutes (% change since 2000)
Travel time to work - 10 to 19 minutes (%)
Travel time to work - 10 to 19 minutes (% change since 2000)
Travel time to work - 20 to 29 minutes (%)
Travel time to work - 20 to 29 minutes (% change since 2000)
Travel time to work - 30 to 39 minutes (%)
Travel time to work - 30 to 39 minutes (% change since 2000)
Travel time to work - 40 to 59 minutes (%)
Travel time to work - 40 to 59 minutes (% change since 2000)
Travel time to work - 60 to 89 minutes (%)
Travel time to work - 60 to 89 minutes (% change since 2000)
Travel time to work - 90 or more minutes (%)
Travel time to work - 90 or more minutes (% change since 2000)
Marital status - Never married (%)
Marital status - Now married (%)
Marital status - Separated (%)
Marital status - Widowed (%)
Marital status - Divorced (%)
Median family income ($)
Median family income (% change since 2000)
Median non-family income ($)
Median non-family income (% change since 2000)
Median per capita income ($)
Median per capita income (% change since 2000)
Median family income ($) - White
Median family income ($) - Black or African American
Median family income ($) - Asian
Median family income ($) - Hispanic or Latino
Median family income ($) - American Indian and Alaska Native
Median family income ($) - Multirace
Median family income ($) - Other Race
Median year house/condo built
Median year apartment built
Year house built - Built 2005 or later (%)
Year house built - Built 2000 to 2004 (%)
Year house built - Built 1990 to 1999 (%)
Year house built - Built 1980 to 1989 (%)
Year house built - Built 1970 to 1979 (%)
Year house built - Built 1960 to 1969 (%)
Year house built - Built 1950 to 1959 (%)
Year house built - Built 1940 to 1949 (%)
Year house built - Built 1939 or earlier (%)
Average household size
Household density (households per square mile)
Average household size - White
Average household size - Black or African American
Average household size - Asian
Average household size - Hispanic or Latino
Average household size - American Indian and Alaska Native
Average household size - Multirace
Average household size - Other Race
Occupied housing units (%)
Vacant housing units (%)
Owner occupied housing units (%)
Renter occupied housing units (%)
Vacancy status - For rent (%)
Vacancy status - For sale only (%)
Vacancy status - Rented or sold, not occupied (%)
Vacancy status - For seasonal, recreational, or occasional use (%)
Vacancy status - For migrant workers (%)
Vacancy status - Other vacant (%)
Residents with income below the poverty level (%)
Residents with income below 50% of the poverty level (%)
Children below poverty level (%)
Poor families by family type - Married-couple family (%)
Poor families by family type - Male, no wife present (%)
Poor families by family type - Female, no husband present (%)
Poverty status for native-born residents (%)
Poverty status for foreign-born residents (%)
Poverty among high school graduates not in families (%)
Poverty among people who did not graduate high school not in families (%)
Residents with income below the poverty level (%) - White
Residents with income below the poverty level (%) - Black or African American
Residents with income below the poverty level (%) - Asian
Residents with income below the poverty level (%) - Hispanic or Latino
Residents with income below the poverty level (%) - American Indian and Alaska Native
Residents with income below the poverty level (%) - Multirace
Residents with income below the poverty level (%) - Other Race
Air pollution - Air Quality Index (AQI)
Air pollution - CO
Air pollution - NO2
Air pollution - SO2
Air pollution - Ozone
Air pollution - PM10
Air pollution - PM25
Air pollution - Pb
Crime - Murders per 100,000 population
Crime - Rapes per 100,000 population
Crime - Robberies per 100,000 population
Crime - Assaults per 100,000 population
Crime - Burglaries per 100,000 population
Crime - Thefts per 100,000 population
Crime - Auto thefts per 100,000 population
Crime - Arson per 100,000 population
Crime - City-data.com crime index
Crime - Violent crime index
Crime - Property crime index
Crime - Murders per 100,000 population (5 year average)
Crime - Rapes per 100,000 population (5 year average)
Crime - Robberies per 100,000 population (5 year average)
Crime - Assaults per 100,000 population (5 year average)
Crime - Burglaries per 100,000 population (5 year average)
Crime - Thefts per 100,000 population (5 year average)
Crime - Auto thefts per 100,000 population (5 year average)
Crime - Arson per 100,000 population (5 year average)
Crime - City-data.com crime index (5 year average)
Crime - Violent crime index (5 year average)
Crime - Property crime index (5 year average)
1996 Presidential Elections Results (%) - Democratic Party (Clinton)
1996 Presidential Elections Results (%) - Republican Party (Dole)
1996 Presidential Elections Results (%) - Other
2000 Presidential Elections Results (%) - Democratic Party (Gore)
2000 Presidential Elections Results (%) - Republican Party (Bush)
2000 Presidential Elections Results (%) - Other
2004 Presidential Elections Results (%) - Democratic Party (Kerry)
2004 Presidential Elections Results (%) - Republican Party (Bush)
2004 Presidential Elections Results (%) - Other
2008 Presidential Elections Results (%) - Democratic Party (Obama)
2008 Presidential Elections Results (%) - Republican Party (McCain)
2008 Presidential Elections Results (%) - Other
2012 Presidential Elections Results (%) - Democratic Party (Obama)
2012 Presidential Elections Results (%) - Republican Party (Romney)
2012 Presidential Elections Results (%) - Other
2016 Presidential Elections Results (%) - Democratic Party (Clinton)
2016 Presidential Elections Results (%) - Republican Party (Trump)
2016 Presidential Elections Results (%) - Other
2020 Presidential Elections Results (%) - Democratic Party (Biden)
2020 Presidential Elections Results (%) - Republican Party (Trump)
2020 Presidential Elections Results (%) - Other
Ancestries Reported - Arab (%)
Ancestries Reported - Czech (%)
Ancestries Reported - Danish (%)
Ancestries Reported - Dutch (%)
Ancestries Reported - English (%)
Ancestries Reported - French (%)
Ancestries Reported - French Canadian (%)
Ancestries Reported - German (%)
Ancestries Reported - Greek (%)
Ancestries Reported - Hungarian (%)
Ancestries Reported - Irish (%)
Ancestries Reported - Italian (%)
Ancestries Reported - Lithuanian (%)
Ancestries Reported - Norwegian (%)
Ancestries Reported - Polish (%)
Ancestries Reported - Portuguese (%)
Ancestries Reported - Russian (%)
Ancestries Reported - Scotch-Irish (%)
Ancestries Reported - Scottish (%)
Ancestries Reported - Slovak (%)
Ancestries Reported - Subsaharan African (%)
Ancestries Reported - Swedish (%)
Ancestries Reported - Swiss (%)
Ancestries Reported - Ukrainian (%)
Ancestries Reported - United States (%)
Ancestries Reported - Welsh (%)
Ancestries Reported - West Indian (%)
Ancestries Reported - Other (%)
Educational Attainment - No schooling completed (%)
Educational Attainment - Less than high school (%)
Educational Attainment - High school or equivalent (%)
Educational Attainment - Less than 1 year of college (%)
Educational Attainment - 1 or more years of college (%)
Educational Attainment - Associate degree (%)
Educational Attainment - Bachelor's degree (%)
Educational Attainment - Master's degree (%)
Educational Attainment - Professional school degree (%)
Educational Attainment - Doctorate degree (%)
School Enrollment - Nursery, preschool (%)
School Enrollment - Kindergarten (%)
School Enrollment - Grade 1 to 4 (%)
School Enrollment - Grade 5 to 8 (%)
School Enrollment - Grade 9 to 12 (%)
School Enrollment - College undergrad (%)
School Enrollment - Graduate or professional (%)
School Enrollment - Not enrolled in school (%)
School enrollment - Public schools (%)
School enrollment - Private schools (%)
School enrollment - Not enrolled (%)
Median number of rooms in houses and condos
Median number of rooms in apartments
Housing units lacking complete plumbing facilities (%)
Housing units lacking complete kitchen facilities (%)
Density of houses
Urban houses (%)
Rural houses (%)
Households with people 60 years and over (%)
Households with people 65 years and over (%)
Households with people 75 years and over (%)
Households with one or more nonrelatives (%)
Households with no nonrelatives (%)
Population in households (%)
Family households (%)
Nonfamily households (%)
Population in families (%)
Family households with own children (%)
Median number of bedrooms in owner occupied houses
Mean number of bedrooms in owner occupied houses
Median number of bedrooms in renter occupied houses
Mean number of bedrooms in renter occupied houses
Median number of vehichles in owner occupied houses
Mean number of vehichles in owner occupied houses
Median number of vehichles in renter occupied houses
Mean number of vehichles in renter occupied houses
Mortgage status - with mortgage (%)
Mortgage status - with second mortgage (%)
Mortgage status - with home equity loan (%)
Mortgage status - with both second mortgage and home equity loan (%)
Mortgage status - without a mortgage (%)
Average family size
Average family size - White
Average family size - Black or African American
Average family size - Asian
Average family size - Hispanic or Latino
Average family size - American Indian and Alaska Native
Average family size - Multirace
Average family size - Other Race
Geographical mobility - Same house 1 year ago (%)
Geographical mobility - Moved within same county (%)
Geographical mobility - Moved from different county within same state (%)
Geographical mobility - Moved from different state (%)
Geographical mobility - Moved from abroad (%)
Place of birth - Born in state of residence (%)
Place of birth - Born in other state (%)
Place of birth - Native, outside of US (%)
Place of birth - Foreign born (%)
Housing units in structures - 1, detached (%)
Housing units in structures - 1, attached (%)
Housing units in structures - 2 (%)
Housing units in structures - 3 or 4 (%)
Housing units in structures - 5 to 9 (%)
Housing units in structures - 10 to 19 (%)
Housing units in structures - 20 to 49 (%)
Housing units in structures - 50 or more (%)
Housing units in structures - Mobile home (%)
Housing units in structures - Boat, RV, van, etc. (%)
House/condo owner moved in on average (years ago)
Renter moved in on average (years ago)
Year householder moved into unit - Moved in 1999 to March 2000 (%)
Year householder moved into unit - Moved in 1995 to 1998 (%)
Year householder moved into unit - Moved in 1990 to 1994 (%)
Year householder moved into unit - Moved in 1980 to 1989 (%)
Year householder moved into unit - Moved in 1970 to 1979 (%)
Year householder moved into unit - Moved in 1969 or earlier (%)
Means of transportation to work - Drove car alone (%)
Means of transportation to work - Carpooled (%)
Means of transportation to work - Public transportation (%)
Means of transportation to work - Bus or trolley bus (%)
Means of transportation to work - Streetcar or trolley car (%)
Means of transportation to work - Subway or elevated (%)
Means of transportation to work - Railroad (%)
Means of transportation to work - Ferryboat (%)
Means of transportation to work - Taxicab (%)
Means of transportation to work - Motorcycle (%)
Means of transportation to work - Bicycle (%)
Means of transportation to work - Walked (%)
Means of transportation to work - Other means (%)
Working at home (%)
Industry diversity
Most Common Industries - Agriculture, forestry, fishing and hunting, and mining (%)
Most Common Industries - Agriculture, forestry, fishing and hunting (%)
Most Common Industries - Mining, quarrying, and oil and gas extraction (%)
Most Common Industries - Construction (%)
Most Common Industries - Manufacturing (%)
Most Common Industries - Wholesale trade (%)
Most Common Industries - Retail trade (%)
Most Common Industries - Transportation and warehousing, and utilities (%)
Most Common Industries - Transportation and warehousing (%)
Most Common Industries - Utilities (%)
Most Common Industries - Information (%)
Most Common Industries - Finance and insurance, and real estate and rental and leasing (%)
Most Common Industries - Finance and insurance (%)
Most Common Industries - Real estate and rental and leasing (%)
Most Common Industries - Professional, scientific, and management, and administrative and waste management services (%)
Most Common Industries - Professional, scientific, and technical services (%)
Most Common Industries - Management of companies and enterprises (%)
Most Common Industries - Administrative and support and waste management services (%)
Most Common Industries - Educational services, and health care and social assistance (%)
Most Common Industries - Educational services (%)
Most Common Industries - Health care and social assistance (%)
Most Common Industries - Arts, entertainment, and recreation, and accommodation and food services (%)
Most Common Industries - Arts, entertainment, and recreation (%)
Most Common Industries - Accommodation and food services (%)
Most Common Industries - Other services, except public administration (%)
Most Common Industries - Public administration (%)
Occupation diversity
Most Common Occupations - Management, business, science, and arts occupations (%)
Most Common Occupations - Management, business, and financial occupations (%)
Most Common Occupations - Management occupations (%)
Most Common Occupations - Business and financial operations occupations (%)
Most Common Occupations - Computer, engineering, and science occupations (%)
Most Common Occupations - Computer and mathematical occupations (%)
Most Common Occupations - Architecture and engineering occupations (%)
Most Common Occupations - Life, physical, and social science occupations (%)
Most Common Occupations - Education, legal, community service, arts, and media occupations (%)
Most Common Occupations - Community and social service occupations (%)
Most Common Occupations - Legal occupations (%)
Most Common Occupations - Education, training, and library occupations (%)
Most Common Occupations - Arts, design, entertainment, sports, and media occupations (%)
Most Common Occupations - Healthcare practitioners and technical occupations (%)
Most Common Occupations - Health diagnosing and treating practitioners and other technical occupations (%)
Most Common Occupations - Health technologists and technicians (%)
Most Common Occupations - Service occupations (%)
Most Common Occupations - Healthcare support occupations (%)
Most Common Occupations - Protective service occupations (%)
Most Common Occupations - Fire fighting and prevention, and other protective service workers including supervisors (%)
Most Common Occupations - Law enforcement workers including supervisors (%)
Most Common Occupations - Food preparation and serving related occupations (%)
Most Common Occupations - Building and grounds cleaning and maintenance occupations (%)
Most Common Occupations - Personal care and service occupations (%)
Most Common Occupations - Sales and office occupations (%)
Most Common Occupations - Sales and related occupations (%)
Most Common Occupations - Office and administrative support occupations (%)
Most Common Occupations - Natural resources, construction, and maintenance occupations (%)
Most Common Occupations - Farming, fishing, and forestry occupations (%)
Most Common Occupations - Construction and extraction occupations (%)
Most Common Occupations - Installation, maintenance, and repair occupations (%)
Most Common Occupations - Production, transportation, and material moving occupations (%)
Most Common Occupations - Production occupations (%)
Most Common Occupations - Transportation occupations (%)
Most Common Occupations - Material moving occupations (%)
People in Group quarters - Institutionalized population (%)
People in Group quarters - Correctional institutions (%)
People in Group quarters - Federal prisons and detention centers (%)
People in Group quarters - Halfway houses (%)
People in Group quarters - Local jails and other confinement facilities (including police lockups) (%)
People in Group quarters - Military disciplinary barracks (%)
People in Group quarters - State prisons (%)
People in Group quarters - Other types of correctional institutions (%)
People in Group quarters - Nursing homes (%)
People in Group quarters - Hospitals/wards, hospices, and schools for the handicapped (%)
People in Group quarters - Hospitals/wards and hospices for chronically ill (%)
People in Group quarters - Hospices or homes for chronically ill (%)
People in Group quarters - Military hospitals or wards for chronically ill (%)
People in Group quarters - Other hospitals or wards for chronically ill (%)
People in Group quarters - Hospitals or wards for drug/alcohol abuse (%)
People in Group quarters - Mental (Psychiatric) hospitals or wards (%)
People in Group quarters - Schools, hospitals, or wards for the mentally retarded (%)
People in Group quarters - Schools, hospitals, or wards for the physically handicapped (%)
People in Group quarters - Institutions for the deaf (%)
People in Group quarters - Institutions for the blind (%)
People in Group quarters - Orthopedic wards and institutions for the physically handicapped (%)
People in Group quarters - Wards in general hospitals for patients who have no usual home elsewhere (%)
People in Group quarters - Wards in military hospitals for patients who have no usual home elsewhere (%)
People in Group quarters - Juvenile institutions (%)
People in Group quarters - Long-term care (%)
People in Group quarters - Homes for abused, dependent, and neglected children (%)
People in Group quarters - Residential treatment centers for emotionally disturbed children (%)
People in Group quarters - Training schools for juvenile delinquents (%)
People in Group quarters - Short-term care, detention or diagnostic centers for delinquent children (%)
People in Group quarters - Type of juvenile institution unknown (%)
People in Group quarters - Noninstitutionalized population (%)
People in Group quarters - College dormitories (includes college quarters off campus) (%)
People in Group quarters - Military quarters (%)
People in Group quarters - On base (%)
People in Group quarters - Barracks, unaccompanied personnel housing (UPH), (Enlisted/Officer), ;and similar group living quarters for military personnel (%)
People in Group quarters - Transient quarters for temporary residents (%)
People in Group quarters - Military ships (%)
People in Group quarters - Group homes (%)
People in Group quarters - Homes or halfway houses for drug/alcohol abuse (%)
People in Group quarters - Homes for the mentally ill (%)
People in Group quarters - Homes for the mentally retarded (%)
People in Group quarters - Homes for the physically handicapped (%)
People in Group quarters - Other group homes (%)
People in Group quarters - Religious group quarters (%)
People in Group quarters - Dormitories (%)
People in Group quarters - Agriculture workers' dormitories on farms (%)
People in Group quarters - Job Corps and vocational training facilities (%)
People in Group quarters - Other workers' dormitories (%)
People in Group quarters - Crews of maritime vessels (%)
People in Group quarters - Other nonhousehold living situations (%)
People in Group quarters - Other noninstitutional group quarters (%)
Residents speaking English at home (%)
Residents speaking English at home - Born in the United States (%)
Residents speaking English at home - Native, born elsewhere (%)
Residents speaking English at home - Foreign born (%)
Residents speaking Spanish at home (%)
Residents speaking Spanish at home - Born in the United States (%)
Residents speaking Spanish at home - Native, born elsewhere (%)
Residents speaking Spanish at home - Foreign born (%)
Residents speaking other language at home (%)
Residents speaking other language at home - Born in the United States (%)
Residents speaking other language at home - Native, born elsewhere (%)
Residents speaking other language at home - Foreign born (%)
Class of Workers - Employee of private company (%)
Class of Workers - Self-employed in own incorporated business (%)
Class of Workers - Private not-for-profit wage and salary workers (%)
Class of Workers - Local government workers (%)
Class of Workers - State government workers (%)
Class of Workers - Federal government workers (%)
Class of Workers - Self-employed workers in own not incorporated business and Unpaid family workers (%)
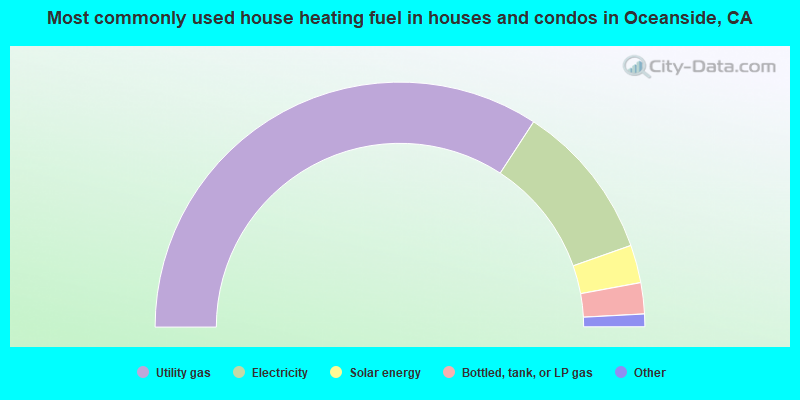
House heating fuel used in houses and condos - Utility gas (%)
House heating fuel used in houses and condos - Bottled, tank, or LP gas (%)
House heating fuel used in houses and condos - Electricity (%)
House heating fuel used in houses and condos - Fuel oil, kerosene, etc. (%)
House heating fuel used in houses and condos - Coal or coke (%)
House heating fuel used in houses and condos - Wood (%)
House heating fuel used in houses and condos - Solar energy (%)
House heating fuel used in houses and condos - Other fuel (%)
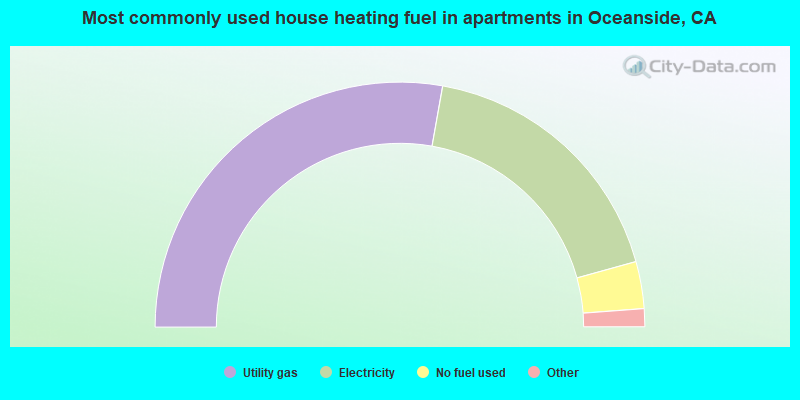
House heating fuel used in houses and condos - No fuel used (%)
House heating fuel used in apartments - Utility gas (%)
House heating fuel used in apartments - Bottled, tank, or LP gas (%)
House heating fuel used in apartments - Electricity (%)
House heating fuel used in apartments - Fuel oil, kerosene, etc. (%)
House heating fuel used in apartments - Coal or coke (%)
House heating fuel used in apartments - Wood (%)
House heating fuel used in apartments - Solar energy (%)
House heating fuel used in apartments - Other fuel (%)
House heating fuel used in apartments - No fuel used (%)
Armed forces status - In Armed Forces (%)
Armed forces status - Civilian (%)
Armed forces status - Civilian - Veteran (%)
Armed forces status - Civilian - Nonveteran (%)
Fatal accidents locations in years 2005-2021
Fatal accidents locations in 2005
Fatal accidents locations in 2006
Fatal accidents locations in 2007
Fatal accidents locations in 2008
Fatal accidents locations in 2009
Fatal accidents locations in 2010
Fatal accidents locations in 2011
Fatal accidents locations in 2012
Fatal accidents locations in 2013
Fatal accidents locations in 2014
Fatal accidents locations in 2015
Fatal accidents locations in 2016
Fatal accidents locations in 2017
Fatal accidents locations in 2018
Fatal accidents locations in 2019
Fatal accidents locations in 2020
Fatal accidents locations in 2021
Alcohol use - People drinking some alcohol every month (%)
Alcohol use - People not drinking at all (%)
Alcohol use - Average days/month drinking alcohol
Alcohol use - Average drinks/week
Alcohol use - Average days/year people drink much
Audiometry - Average condition of hearing (%)
Audiometry - People that can hear a whisper from across a quiet room (%)
Audiometry - People that can hear normal voice from across a quiet room (%)
Audiometry - Ears ringing, roaring, buzzing (%)
Audiometry - Had a job exposure to loud noise (%)
Audiometry - Had off-work exposure to loud noise (%)
Blood Pressure & Cholesterol - Has high blood pressure (%)
Blood Pressure & Cholesterol - Checking blood pressure at home (%)
Blood Pressure & Cholesterol - Frequently checking blood cholesterol (%)
Blood Pressure & Cholesterol - Has high cholesterol level (%)
Consumer Behavior - Money monthly spent on food at supermarket/grocery store
Consumer Behavior - Money monthly spent on food at other stores
Consumer Behavior - Money monthly spent on eating out
Consumer Behavior - Money monthly spent on carryout/delivered foods
Consumer Behavior - Income spent on food at supermarket/grocery store (%)
Consumer Behavior - Income spent on food at other stores (%)
Consumer Behavior - Income spent on eating out (%)
Consumer Behavior - Income spent on carryout/delivered foods (%)
Current Health Status - General health condition (%)
Current Health Status - Blood donors (%)
Current Health Status - Has blood ever tested for HIV virus (%)
Current Health Status - Left-handed people (%)
Dermatology - People using sunscreen (%)
Diabetes - Diabetics (%)
Diabetes - Had a blood test for high blood sugar (%)
Diabetes - People taking insulin (%)
Diet Behavior & Nutrition - Diet health (%)
Diet Behavior & Nutrition - Milk product consumption (# of products/month)
Diet Behavior & Nutrition - Meals not home prepared (#/week)
Diet Behavior & Nutrition - Meals from fast food or pizza place (#/week)
Diet Behavior & Nutrition - Ready-to-eat foods (#/month)
Diet Behavior & Nutrition - Frozen meals/pizza (#/month)
Drug Use - People that ever used marijuana or hashish (%)
Drug Use - Ever used hard drugs (%)
Drug Use - Ever used any form of cocaine (%)
Drug Use - Ever used heroin (%)
Drug Use - Ever used methamphetamine (%)
Health Insurance - People covered by health insurance (%)
Kidney Conditions-Urology - Avg. # of times urinating at night
Medical Conditions - People with asthma (%)
Medical Conditions - People with anemia (%)
Medical Conditions - People with psoriasis (%)
Medical Conditions - People with overweight (%)
Medical Conditions - Elderly people having difficulties in thinking or remembering (%)
Medical Conditions - People who ever received blood transfusion (%)
Medical Conditions - People having trouble seeing even with glass/contacts (%)
Medical Conditions - People with arthritis (%)
Medical Conditions - People with gout (%)
Medical Conditions - People with congestive heart failure (%)
Medical Conditions - People with coronary heart disease (%)
Medical Conditions - People with angina pectoris (%)
Medical Conditions - People who ever had heart attack (%)
Medical Conditions - People who ever had stroke (%)
Medical Conditions - People with emphysema (%)
Medical Conditions - People with thyroid problem (%)
Medical Conditions - People with chronic bronchitis (%)
Medical Conditions - People with any liver condition (%)
Medical Conditions - People who ever had cancer or malignancy (%)
Mental Health - People who have little interest in doing things (%)
Mental Health - People feeling down, depressed, or hopeless (%)
Mental Health - People who have trouble sleeping or sleeping too much (%)
Mental Health - People feeling tired or having little energy (%)
Mental Health - People with poor appetite or overeating (%)
Mental Health - People feeling bad about themself (%)
Mental Health - People who have trouble concentrating on things (%)
Mental Health - People moving or speaking slowly or too fast (%)
Mental Health - People having thoughts they would be better off dead (%)
Oral Health - Average years since last visit a dentist
Oral Health - People embarrassed because of mouth (%)
Oral Health - People with gum disease (%)
Oral Health - General health of teeth and gums (%)
Oral Health - Average days a week using dental floss/device
Oral Health - Average days a week using mouthwash for dental problem
Oral Health - Average number of teeth
Pesticide Use - Households using pesticides to control insects (%)
Pesticide Use - Households using pesticides to kill weeds (%)
Physical Activity - People doing vigorous-intensity work activities (%)
Physical Activity - People doing moderate-intensity work activities (%)
Physical Activity - People walking or bicycling (%)
Physical Activity - People doing vigorous-intensity recreational activities (%)
Physical Activity - People doing moderate-intensity recreational activities (%)
Physical Activity - Average hours a day doing sedentary activities
Physical Activity - Average hours a day watching TV or videos
Physical Activity - Average hours a day using computer
Physical Functioning - People having limitations keeping them from working (%)
Physical Functioning - People limited in amount of work they can do (%)
Physical Functioning - People that need special equipment to walk (%)
Physical Functioning - People experiencing confusion/memory problems (%)
Physical Functioning - People requiring special healthcare equipment (%)
Prescription Medications - Average number of prescription medicines taking
Preventive Aspirin Use - Adults 40+ taking low-dose aspirin (%)
Reproductive Health - Vaginal deliveries (%)
Reproductive Health - Cesarean deliveries (%)
Reproductive Health - Deliveries resulted in a live birth (%)
Reproductive Health - Pregnancies resulted in a delivery (%)
Reproductive Health - Women breastfeeding newborns (%)
Reproductive Health - Women that had a hysterectomy (%)
Reproductive Health - Women that had both ovaries removed (%)
Reproductive Health - Women that have ever taken birth control pills (%)
Reproductive Health - Women taking birth control pills (%)
Reproductive Health - Women that have ever used Depo-Provera or injectables (%)
Reproductive Health - Women that have ever used female hormones (%)
Sexual Behavior - People 18+ that ever had sex (vaginal, anal, or oral) (%)
Sexual Behavior - Males 18+ that ever had vaginal sex with a woman (%)
Sexual Behavior - Males 18+ that ever performed oral sex on a woman (%)
Sexual Behavior - Males 18+ that ever had anal sex with a woman (%)
Sexual Behavior - Males 18+ that ever had any sex with a man (%)
Sexual Behavior - Females 18+ that ever had vaginal sex with a man (%)
Sexual Behavior - Females 18+ that ever performed oral sex on a man (%)
Sexual Behavior - Females 18+ that ever had anal sex with a man (%)
Sexual Behavior - Females 18+ that ever had any kind of sex with a woman (%)
Sexual Behavior - Average age people first had sex
Sexual Behavior - Average number of female sex partners in lifetime (males 18+)
Sexual Behavior - Average number of female vaginal sex partners in lifetime (males 18+)
Sexual Behavior - Average age people first performed oral sex on a woman (18+)
Sexual Behavior - Average number of woman performed oral sex on in lifetime (18+)
Sexual Behavior - Average number of male sex partners in lifetime (males 18+)
Sexual Behavior - Average number of male anal sex partners in lifetime (males 18+)
Sexual Behavior - Average age people first performed oral sex on a man (18+)
Sexual Behavior - Average number of male oral sex partners in lifetime (18+)
Sexual Behavior - People using protection when performing oral sex (%)
Sexual Behavior - Average number of times people have vaginal or anal sex a year
Sexual Behavior - People having sex without condom (%)
Sexual Behavior - Average number of male sex partners in lifetime (females 18+)
Sexual Behavior - Average number of male vaginal sex partners in lifetime (females 18+)
Sexual Behavior - Average number of female sex partners in lifetime (females 18+)
Sexual Behavior - Circumcised males 18+ (%)
Sleep Disorders - Average hours sleeping at night
Sleep Disorders - People that has trouble sleeping (%)
Smoking-Cigarette Use - People smoking cigarettes (%)
Taste & Smell - People 40+ having problems with smell (%)
Taste & Smell - People 40+ having problems with taste (%)
Taste & Smell - People 40+ that ever had wisdom teeth removed (%)
Taste & Smell - People 40+ that ever had tonsils teeth removed (%)
Taste & Smell - People 40+ that ever had a loss of consciousness because of a head injury (%)
Taste & Smell - People 40+ that ever had a broken nose or other serious injury to face or skull (%)
Taste & Smell - People 40+ that ever had two or more sinus infections (%)
Weight - Average height (inches)
Weight - Average weight (pounds)
Weight - Average BMI
Weight - People that are obese (%)
Weight - People that ever were obese (%)
Weight - People trying to lose weight (%)
75,525 43.9% White alone 62,028 36.0% Hispanic 14,129 8.2% Asian alone 11,400 6.6% Two or more races 5,600 3.3% Black alone 1,550 0.9% Native Hawaiian and Other 1,580 0.9% Other race alone 378 0.2% American Indian alone
According to our research of California and other state lists, there were 157 registered sex offenders living in Oceanside, California as of April 26, 2024 . The ratio of all residents to sex offenders in Oceanside is 1,117 to 1.The ratio of registered sex offenders to all residents in this city is lower than the state average.
The City-Data.com crime index weighs serious crimes and violent crimes more heavily. Higher means more crime, U.S. average is 246.1. It adjusts for the number of visitors and daily workers commuting into cities.
- means the value is smaller than the state average.
- means the value is about the same as the state average.
- means the value is bigger than the state average.
- means the value is much bigger than the state average.
Crime rate in Oceanside detailed stats: murders, rapes, robberies, assaults, burglaries, thefts, arson Officers per 1,000 residents here:
1.14California average:
2.30
Latest news from Oceanside, CA collected exclusively by city-data.com from local newspapers, TV, and radio stations
Oceanside, CA City Guides: Ancestries: German (3.9%), English (3.8%), Irish (3.7%), American (3.7%), European (2.7%), Italian (2.7%).
Current Local Time:
Land area: 40.6 square miles.
Population density: 4,242 people per square mile (average).
34,941 residents are foreign born (11.9% Latin America , 5.7% Asia ).
This city:
20.2%California:
26.5%
Median real estate property taxes paid for housing units with mortgages in 2022: $4,826 (0.6%)Median real estate property taxes paid for housing units with no mortgage in 2022: $3,570 (0.5%)
Nearest city with pop. 200,000+: South Coast, CA (30.2 miles
Nearest city with pop. 1,000,000+: San Diego, CA
Nearest cities:
Latitude: 33.21 N, Longitude: 117.33 W
Daytime population change due to commuting: -22,623 (-13.1%)Workers who live and work in this city: 34,763 (40.0%)
Area code commonly used in this area: 760
Oceanside tourist attractions:
Single-family new house construction building permits:
2022: 82 buildings , average cost: $245,6002021: 72 buildings , average cost: $190,1002020: 33 buildings , average cost: $257,0002019: 71 buildings , average cost: $177,8002018: 122 buildings , average cost: $189,8002017: 105 buildings , average cost: $235,1002016: 26 buildings , average cost: $328,0002015: 36 buildings , average cost: $309,6002014: 86 buildings , average cost: $327,5002013: 119 buildings , average cost: $378,7002012: 92 buildings , average cost: $381,1002011: 106 buildings , average cost: $324,7002010: 82 buildings , average cost: $302,2002009: 51 buildings , average cost: $370,5002008: 52 buildings , average cost: $388,6002007: 149 buildings , average cost: $297,0002006: 284 buildings , average cost: $346,0002005: 250 buildings , average cost: $303,9002004: 419 buildings , average cost: $242,8002003: 579 buildings , average cost: $242,5002002: 711 buildings , average cost: $237,4002001: 671 buildings , average cost: $220,3002000: 504 buildings , average cost: $204,4001999: 639 buildings , average cost: $201,5001998: 628 buildings , average cost: $180,5001997: 537 buildings , average cost: $174,000Unemployment in December 2023:
Population change in the 1990s: +31,641 (+24.5%).
Most common occupations in Oceanside, CA (%)
Both Males Females
Cooks and food preparation workers (7.6%)
Building and grounds cleaning and maintenance occupations (6.1%)
Other management occupations, except farmers and farm managers (4.8%)
Retail sales workers, except cashiers (3.5%)
Supervisors and other personal care and service workers, except child care workers (3.2%)
Computer specialists (3.2%)
Cashiers (2.9%)
Cooks and food preparation workers (7.6%)
Building and grounds cleaning and maintenance occupations (7.5%)
Other management occupations, except farmers and farm managers (5.4%)
Computer specialists (5.1%)
Material recording, scheduling, dispatching, and distributing workers (3.2%)
Driver/sales workers and truck drivers (3.2%)
Electrical equipment mechanics and other installation, maintenance, and repair workers, including supervisors (3.2%)
Cooks and food preparation workers (7.5%)
Supervisors and other personal care and service workers, except child care workers (4.8%)
Cashiers (4.5%)
Building and grounds cleaning and maintenance occupations (4.4%)
Other management occupations, except farmers and farm managers (4.2%)
Retail sales workers, except cashiers (4.0%)
Information and record clerks, except customer service representatives (4.0%)
Earthquake activity:
Oceanside-area historical earthquake activity is significantly above California state average. It is 6335% greater than the overall U.S. average. On 6/28/1992 at 11:57:34, a magnitude 7.6 (6.2 MB, 7.6 MS, 7.3 MW, Depth: 0.7 mi, Class: Major, Intensity: VIII - XII) earthquake occurred 81.3 miles away from the city center, causing 3 deaths ( 1 shaking deaths, 2 other deaths) and 400 injuries, causing $100,000,000 total damage and $40,000,000 insured lossesOn 7/21/1952 at 11:52:14, a magnitude 7.7 (7.7 UK) earthquake occurred 156.5 miles away from Oceanside center, causing $50,000,000 total damage On 10/16/1999 at 09:46:44, a magnitude 7.4 (6.3 MB, 7.4 MS, 7.2 MW, 7.3 ML) earthquake occurred 103.7 miles away from Oceanside center On 5/19/1940 at 04:36:40, a magnitude 7.2 (7.2 UK) earthquake occurred 94.2 miles away from Oceanside center, causing $33,000,000 total damage On 12/31/1934 at 18:45:56, a magnitude 7.1 (7.1 UK) earthquake occurred 97.8 miles away from Oceanside center On 4/21/1918 at 22:32:30, a magnitude 6.8 (6.8 UK, Class: Strong, Intensity: VII - IX) earthquake occurred 42.1 miles away from the city center Magnitude types: body-wave magnitude (MB), local magnitude (ML), surface-wave magnitude (MS), moment magnitude (MW) Natural disasters: The number of natural disasters in San Diego County (39) is a lot greater than the US average (15).Major Disasters (Presidential) Declared: 21Emergencies Declared: 2Fires: 21, Floods: 17, Storms: 9, Winter Storms: 6, Landslides: 5, Mudslides: 4, Freeze: 1, Heavy Rain: 1, Hurricane: 1, Tornado: 1, Other: 1 (Note: some incidents may be assigned to more than one category). Main business address for: SERACARE LIFE SCIENCES INC IN VITRO & IN VIVO DIAGNOSTIC SUBSTANCES ).
Hospitals and medical centers in Oceanside: ANDRU HOME (311 DEL FLORA STREET) MARBLEHEAD HOUSE (4728 MARBLEHEAD BAY DRIVE) TRI-CITY MEDICAL CENTER (Government - Hospital District or Authority, 4002 VISTA WAY) VIA MINDANAO HOUSE (5124 VIA MINDANAO) LA PALOMA HEALTHCARE CENTER (3232 THUNDER DRIVE)
DSI OCEANSIDE DIALYSIS (2227- B EL CAMINO REAL)
FMC-NORTH COAST KIDNEY CENTER (3300 VISTA WAY, SUITE A)
Amtrak station: OCEANSIDE (235 S. TREMONT ST.)
.
Services: ticket office, fully wheelchair accessible, enclosed waiting area, public restrooms, public payphones, snack bar, free short-term parking, free long-term parking, call for car rental service, taxi stand, intercity bus service, public transit connection.
Colleges/Universities in Oceanside: MiraCosta College Full-time enrollment: 11,189; Location: One Barnard Drive; Public; Website: www.miracosta.edu)
Oceanside College of Beauty Full-time enrollment: 112; Location: 1575 S Coast Hwy; Private, for-profit; Website: ocb.edu/)
MediaTech Institute-Oceanside Full-time enrollment: 53; Location: 302 Oceanside Boulevard; Private, for-profit; Website: www.mediatech.edu)
Other colleges/universities with over 2000 students near Oceanside:
Palomar College (about 10 miles; San Marcos, CA ; Full-time enrollment: 15,037)
California State University-San Marcos (about 12 miles; San Marcos, CA ; FT enrollment: 8,070)
National University (about 22 miles; La Jolla, CA ; FT enrollment: 24,215)
University of California-San Diego (about 24 miles; La Jolla, CA ; FT enrollment: 29,297)
San Diego Miramar College (about 25 miles; San Diego, CA ; FT enrollment: 5,128)
Alliant International University (about 26 miles; San Diego, CA ; FT enrollment: 3,155)
San Diego Mesa College (about 30 miles; San Diego, CA ; FT enrollment: 12,487)
Public high schools in Oceanside: EL CAMINO HIGH Students: 2,135, Location: 400 RANCHO DEL ORO DR., Grades: 9-12)OCEANSIDE HIGH Students: 1,640, Location: 1 PIRATES COVE WAY, Grades: 9-12)PACIFIC VIEW CHARTER Students: 168, Location: 3670 OCEAN RANCH BLVD., Grades: KG-12, Charter school )OCEAN SHORES HIGH (CONTINUATION) Students: 50, Location: 3131 OCEANSIDE BLVD., Grades: 9-12)SIATECH Students: 45, Location: 2611 TEMPLE HEIGHTS DR., Grades: 11-12, Charter school )SAN DIEGO NEIGHBORHOOD HOMESCHOOLS Students: 9, Location: 3548 SEAGATE WAY, STE. 140, Grades: KG-12, Charter school )MISSION VISTA HIGH Location: 1306 MELROSE DR., Grades: 9-12)
Biggest public elementary/middle schools in Oceanside: MARTIN LUTHER KING JR. MIDDLE Students: 1,434, Location: 1290 IVEY RANCH RD., Grades: 6-8)JEFFERSON MIDDLE Students: 1,108, Location: 823 ACACIA ST., Grades: 6-8)CESAR CHAVEZ MIDDLE Students: 742, Location: 202 OLEANDER DR, Grades: 6-8)REYNOLDS ELEMENTARY Students: 495, Location: 4575 DOUGLAS DR., Grades: KG-5)NICHOLS ELEMENTARY Students: 484, Location: 4250 OLD GROVE RD., Grades: KG-5)IVEY RANCH ELEMENTARY Students: 459, Location: 4275 VIA RANCHO RD., Grades: KG-5)SOUTH OCEANSIDE ELEMENTARY Students: 447, Location: 1806 S. HORNE ST., Grades: KG-5)PALMQUIST ELEMENTARY Students: 414, Location: 1999 CALIFORNIA ST., Grades: KG-5)CHRISTA MCAULIFFE ELEMENTARY Students: 412, Location: 3701 KELTON DR., Grades: KG-5)MARY FAY PENDLETON ELEMENTARY Students: 402, Location: 110 MARINE DR., Grades: KG-8)Private elementary/middle schools in Oceanside: ST MARY STAR OF THE SEA SCHOOL Students: 385, Location: 515 WISCONSIN AVE, Grades: PK-8)
OLD MISSION MONTESSORI SCHOOL Students: 228, Location: 4070 MISSION AVE, Grades: PK-8)
MONTESSORI SCHOOL OF OCEANSIDE Students: 148, Location: 3525 CANNON RD, Grades: PK-5)
OCEANSIDE ADVENTIST ELEMENTARY Students: 141, Location: 1943 CALIFORNIA ST, Grades: UG-8)
PEPPERTREE MONTESSORI Students: 132, Location: 427 COLLEGE BLVD STE I, Grades: UG-2)
NEW VENTURE CHRISTIAN SCHOOLS Students: 113, Location: 4000 MYSTRA WAY, Grades: PK-8)
GEC CHRISTIAN ACADEMY Students: 19, Location: 1985 PEACOCK BLVD, Grades: PK-T1)
See full list of schools located in Oceanside Library in Oceanside: OCEANSIDE PUBLIC LIBRARY Operating income: $5,445,964; Location: 330 N. COAST HIGHWAY; 298,976 books ; 2,636 e-books ; 16,468 audio materials ; 11,943 video materials ; 2 local licensed databases ; 3 state licensed databases ; 26 other licensed databases ; 468 print serial subscriptions ; 64 electronic serial subscriptions )
User-submitted facts and corrections:
Please add to churches: Shepherd of the Valley Lutheran Church 4510 North River Road web site is www.svlchurch.org
The zip code, 92057 is also in Oceanside. I know this because I am a resident of Oceanside and that is my zip code! It was not listed along with the others. added by kat
Notable locations in Oceanside: (A) , Emerald Isle Golf Course (B) , The Strand (C) , Oceanside Municipal Golf Course (D) , Oceanside-Carlsbad Country Club (E) , El Camino Country Club (F) , Oceanside Community Center (G) , Oceanside City Hall (H) , Oceanside Chamber of Commerce and Visitor Information Center (I) , North River Road Park Community Center (J) , Oceanside Fire Department Station 8 (K) , Oceanside Fire Department Station 7 (L) , Oceanside Fire Department Station 5 (M) , Oceanside Fire Department Station 1 Headquarters (N) , Oceanside Fire Department Station 3 (O) , Oceanside Fire Department Station 2 (P) , Oceanside Fire Department Station 6 (Q) , Oceanside Fire Department Station 4 (R) . Display/hide their locations on the map
Shopping Centers: (1) , Rancho del Oro Plaza Shopping Center (2) , Oceanside Village Square Shopping Center (3) , Oceanside Shopping Center (4) , Oceanside Plaza Shopping Center (5) , Oceanside Five Shopping Center (6) , Mission-Douglas Plaza Shopping Center (7) , Mission Square Shopping Center (8) , Mission Shopping Center (9) . Display/hide their locations on the map
Main business address in Oceanside: (A) . Display/hide its location on the map
Churches in Oceanside include: (A) , Church of God (B) , First Baptist Church (C) , First Christian Church (D) , First Methodist Episcopal Church (E) , Foursquare Church (F) , Saint Marys Star of the Sea Roman Catholic Church (G) , Seventh Day Adventist Church (H) , Temple Juda (I) . Display/hide their locations on the map
Cemeteries: (1) , Eternal Hills Memorial Park (2) . Display/hide their locations on the map
Lakes and reservoirs: (A) , Little Libby Lake (B) , Guajome Lake (C) , Hubbert Lake (D) , Whelan Lake (E) . Display/hide their locations on the map
Creeks: (A) , Loma Alta Creek (B) . Display/hide their locations on the map
Parks in Oceanside include: (1) , Eastside Park (2) , Landes Park (3) , Marshall Street Park (4) , Todd Memorial Park (5) , Libby Lake City Park (6) , North River Road Park (7) , Oak Riparian Park (8) , Pacific Street Linear Park (9) . Display/hide their locations on the map
Beaches: (A) , South Oceanside Beach (B) . Display/hide their locations on the map
Tourist attractions: (1) , Audubon Society-Buena Vista (Museums; 2202 South Coast Highway) (2) , Carlsbad Mineral Water Spa (Recreation Areas; 2802 Carlsbad Boulevard) (3) , California Welcome Center of Oceanside (928 North Coast Highway) (4) , All In One Travel Services (Recreational Trips & Guides; 303 Dogwood Road) (5) . Display/hide their approximate locations on the map
Hotels: (1) , Best Western Oceanside Inn (1680 Oceanside Boulevard) (2) , Best Western - Oceanside Inn (1680 Oceanside Blvd.) (3) , Beach Condo Rentals (999 North Pacific Street) (4) , Best Western Marty's Valley Inn (3240 Mission Ave) (5) , Beach City Cab (4750 Athos Way) (6) , Book Em Dan O Tropical Vacations (3625 Vista Oceana 35) (7) . Display/hide their approximate locations on the map
Court: (1) . Display/hide its approximate location on the map
Birthplace of: Chris Thile - Musician, James Siena - Artist, Thomas Keller - Chef, Cappie Pondexter - Basketball player, Israel Houghton - Worship leader, Charde Houston - Women's basketball player, Justin Blackmon - Football wide receiver, Michael D. Lumpkin - Soilder, Chris Moreno - Illustrator, David Mendenhall - Child actor.
San Diego County has a predicted average indoor radon screening level less than 2 pCi/L (pico curies per liter) - Low Potential Drinking water stations with addresses in Oceanside and their reported violations in the past:
SHELL #508 (Serves OR, Population served: 100, Groundwater):
Past health violations:
MCL, Monthly (TCR) - In SEP-2011, Contaminant: Coliform. Follow-up actions: St Public Notif requested (OCT-24-2011), St Violation/Reminder Notice (OCT-31-2011), St Compliance achieved (NOV-18-2011)
MCL, Monthly (TCR) - Between JUL-2011 and SEP-2011, Contaminant: Coliform. Follow-up actions: St Public Notif requested (SEP-21-2011), St Violation/Reminder Notice (SEP-26-2011), St Compliance achieved (NOV-18-2011)
Past monitoring violations:
11 routine major monitoring violations
One minor monitoring violation
4 regular monitoring violations
Population served: 25, Groundwater):
Past health violations:
MCL, Monthly (TCR) - In OCT-2013, Contaminant: Coliform. Follow-up actions: St AO (w/o penalty) issued (NOV-13-2013)
MCL, Monthly (TCR) - In SEP-2013, Contaminant: Coliform. Follow-up actions: St AO (w/o penalty) issued (NOV-13-2013)
MCL, Monthly (TCR) - In DEC-2010, Contaminant: Coliform. Follow-up actions: St AO (w/o penalty) issued (MAR-24-2011)
Past monitoring violations:
2 routine major monitoring violations
One minor monitoring violation
2 regular monitoring violations
Average household size: This city:
2.8 peopleCalifornia:
2.9 people
Percentage of family households: This city:
68.0%Whole state:
68.7%
Percentage of households with unmarried partners: This city:
6.7%Whole state:
7.2%
Likely homosexual households (counted as self-reported same-sex unmarried-partner households)
Lesbian couples: 0.4% of all households Gay men: 0.4% of all households
People in group quarters in Oceanside in 2010:
292 people in emergency and transitional shelters (with sleeping facilities) for people experiencing homelessness
226 people in group homes intended for adults
198 people in other noninstitutional facilities
91 people in nursing facilities/skilled-nursing facilities
55 people in workers' group living quarters and job corps centers
31 people in residential treatment centers for adults
16 people in local jails and other municipal confinement facilities
12 people in residential treatment centers for juveniles (non-correctional)
10 people in group homes for juveniles (non-correctional)
5 people in in-patient hospice facilities
People in group quarters in Oceanside in 2000:
516 people in other noninstitutional group quarters
157 people in agriculture workers' dormitories on farms
156 people in nursing homes
152 people in homes or halfway houses for drug/alcohol abuse
78 people in religious group quarters
72 people in homes for the mentally retarded
59 people in other group homes
56 people in homes for the mentally ill
25 people in homes for abused, dependent, and neglected children
5 people in college dormitories (includes college quarters off campus)
4 people in other workers' dormitories
Banks with most branches in Oceanside (2011 data):
Bank of America, National Association: Quarry Creek Plaza Branch, Plaza Rancho Del Oro Branch, San Luis Rey Valley Branch, Tri-City Crossroads Night Drop, Oceanside Branch. Info updated 2009/11/18: Bank assets: $1,451,969.3 mil, Deposits: $1,077,176.8 mil, headquarters in Charlotte, NC, positive income , 5782 total offices , Holding Company: Bank Of America Corporation
Wells Fargo Bank, National Association: Quarry Creek Branch, Oceanside(Ralphs) Branch, Oceanside College Boulevard Branch, Oceanside/78 Branch, Rancho Del Oro Branch. Info updated 2011/04/05: Bank assets: $1,161,490.0 mil, Deposits: $905,653.0 mil, headquarters in Sioux Falls, SD, positive income , 6395 total offices , Holding Company: Wells Fargo & Company
JPMorgan Chase Bank, National Association: Oceanside & State Tree Banking Cente, Mission Ave Branch, Oceanside Branch, Oceanside Branch, Oceanside (College Bridge) Branch. Info updated 2011/11/10: Bank assets: $1,811,678.0 mil, Deposits: $1,190,738.0 mil, headquarters in Columbus, OH, positive income , International Specialization, 5577 total offices , Holding Company: Jpmorgan Chase & Co.
U.S. Bank National Association: Oceanside Branch, Oceanside - Old Grove Road Branch, Oceanside Albertsons Branch. Info updated 2012/01/30: Bank assets: $330,470.8 mil, Deposits: $236,091.5 mil, headquarters in Cincinnati, OH, positive income , 3121 total offices , Holding Company: U.S. Bancorp
Union Bank, National Association: San Luis Rey Instore Branch, El Camino Real Branch, Oceanside Branch. Info updated 2011/09/01: Bank assets: $88,967.5 mil, Deposits: $65,286.4 mil, headquarters in San Francisco, CA, positive income , Commercial Lending Specialization, 403 total offices , Holding Company: Mitsubishi Ufj Financial Group, Inc.
The Fort Sill National Bank: Fsnb - Oceanside Branch at 3825 Mission Avenue Suite D-9, branch established on 1997/07/01. Info updated 2006/11/03: Bank assets: $369.8 mil, Deposits: $324.4 mil, headquarters in Fort Sill, OK, positive income , 71 total offices , Holding Company: Jrmb Ii, Inc
Citibank, National Association: Oceanside Branch at 4120 Oceanside Blvd, Suite 119, branch established on 2006/09/18. Info updated 2012/01/10: Bank assets: $1,288,658.0 mil, Deposits: $882,541.0 mil, headquarters in Sioux Falls, SD, positive income , International Specialization, 1048 total offices , Holding Company: Citigroup Inc.
Compass Bank: Oceanside Branch at 815 Mission Avenue, branch established on 1996/06/24. Info updated 2011/02/24: Bank assets: $63,107.0 mil, Deposits: $46,232.4 mil, headquarters in Birmingham, AL, negative income in the last year , Commercial Lending Specialization, 720 total offices , Holding Company: Banco Bilbao Vizcaya Argentaria, S.A.
Community Commerce Bank: Oceanside Branch at 3124 West Vista Way, Suite 101, branch established on 1980/09/01. Info updated 2009/03/12: Bank assets: $313.5 mil, Deposits: $245.1 mil, headquarters in Claremont, CA, positive income , Commercial Lending Specialization, 6 total offices
For population 15 years and over in Oceanside:
Never married: 31.6%Now married: 50.5%Separated: 1.6%Widowed: 4.7%Divorced: 11.6% For population 25 years and over in Oceanside:
High school or higher: 88.3%Bachelor's degree or higher: 37.5%Graduate or professional degree: 12.0%Unemployed: 5.7%Mean travel time to work (commute): 21.9 minutes
Education Gini index (Inequality in education) Here:
12.8California average:
15.5
Religion statistics for Oceanside, CA (based on San Diego County data)
Religion Adherents Congregations Catholic 801,850 115 Evangelical Protestant 302,320 974 Other 161,530 349 Mainline Protestant 74,992 211 Black Protestant 10,857 52 Orthodox 7,828 19 None 1,735,936 -
Source: Clifford Grammich, Kirk Hadaway, Richard Houseal, Dale E.Jones, Alexei Krindatch, Richie Stanley and Richard H.Taylor. 2012. 2010 U.S.Religion Census: Religious Congregations & Membership Study. Association of Statisticians of American Religious Bodies. Jones, Dale E., et al. 2002. Congregations and Membership in the United States 2000. Nashville, TN: Glenmary Research Center. Graphs represent county-level data
Food Environment Statistics: Number of grocery stores : 574San Diego County :
1.94 / 10,000 pop.State :
2.14 / 10,000 pop.
Number of supercenters and club stores : 17Here :
0.06 / 10,000 pop.California :
0.04 / 10,000 pop.
Number of convenience stores (no gas) : 227Here :
0.77 / 10,000 pop.California :
0.62 / 10,000 pop.
Number of convenience stores (with gas) : 487This county :
1.65 / 10,000 pop.California :
1.49 / 10,000 pop.
Number of full-service restaurants : 2,238Here :
7.56 / 10,000 pop.California :
7.42 / 10,000 pop.
Adult diabetes rate : This county :
6.5%State :
7.3%
Adult obesity rate : Here :
22.2%California :
21.3%
Low-income preschool obesity rate : San Diego County :
16.0%State :
17.9%
Health and Nutrition: Healthy diet rate : Oceanside:
49.7%State:
49.4%
Average overall health of teeth and gums : People feeling badly about themselves : Oceanside:
19.8%California:
20.2%
People not drinking alcohol at all : Oceanside:
11.1%California:
11.2%
Average hours sleeping at night : Overweight people : This city:
31.9%State:
31.5%
General health condition : Oceanside:
56.7%California:
56.4%
Average condition of hearing : Oceanside:
80.3%California:
80.9%
More about Health and Nutrition of Oceanside, CA Residents
Local government employment and payroll (March 2022)
Function
Full-time employees
Monthly full-time payroll
Average yearly full-time wage
Part-time employees
Monthly part-time payroll
Police Protection - Officers
225 $2,112,795 $112,682 0 $0 Firefighters
131 $1,229,718 $112,646 0 $0 Other Government Administration
105 $805,495 $92,057 0 $0 Police - Other
85 $721,541 $101,865 4 $7,173 Sewerage
77 $532,960 $83,059 1 $1,747 Other and Unallocable
65 $475,766 $87,834 5 $22,058 Water Supply
60 $473,420 $94,684 11 $24,404 Financial Administration
52 $331,412 $76,480 4 $12,389 Local Libraries
49 $210,871 $51,642 9 $5,628 Streets and Highways
46 $280,301 $73,122 0 $0 Housing and Community Development (Local)
43 $245,019 $68,377 0 $0 Parks and Recreation
24 $252,048 $126,024 64 $170,609 Solid Waste Management
17 $83,650 $59,047 0 $0 Judicial and Legal
9 $103,398 $137,864 1 $4,235 Fire - Other
6 $73,778 $147,556 0 $0 Natural Resources
5 $26,641 $63,938 0 $0
Totals for Government
999 $7,958,812 $95,601 99 $248,242
Oceanside government finances - Expenditure in 2021 (per resident):
Construction - Parks and Recreation: $19,483,000 ($113.14)
Regular Highways: $7,000,000 ($40.65)General - Other: $3,076,000 ($17.86)Police Protection: $1,298,000 ($7.54)Health - Other: $814,000 ($4.73)Housing and Community Development: $53,000 ($0.31)Current Operations - Police Protection: $63,838,000 ($370.72)
Water Utilities: $58,543,000 ($339.97)Local Fire Protection: $31,320,000 ($181.88)Housing and Community Development: $29,849,000 ($173.34)Sewerage: $27,910,000 ($162.08)Central Staff Services: $26,444,000 ($153.57)Solid Waste Management: $23,385,000 ($135.80)Regular Highways: $22,887,000 ($132.91)Parks and Recreation: $14,849,000 ($86.23)Sea and Inland Port Facilities: $8,402,000 ($48.79)General - Other: $7,058,000 ($40.99)Libraries: $5,456,000 ($31.68)Protective Inspection and Regulation - Other: $4,763,000 ($27.66)Health - Other: $2,647,000 ($15.37)Transit Utilities: $1,949,000 ($11.32)Parking Facilities: $1,655,000 ($9.61)Air Transportation: $2,000 ($0.01)General - Interest on Debt: $6,098,000 ($35.41)
Water Utilities - Interest on Debt: $2,402,000 ($13.95)
Oceanside government finances - Revenue in 2021 (per resident):
Charges - Sewerage: $50,627,000 ($294.00)
Solid Waste Management: $30,665,000 ($178.08)Other: $23,704,000 ($137.65)Sea and Inland Port Facilities: $17,120,000 ($99.42)Parking Facilities: $2,632,000 ($15.28)Housing and Community Development: $1,852,000 ($10.75)Parks and Recreation: $1,696,000 ($9.85)Air Transportation: $94,000 ($0.55)Federal Intergovernmental - Other: $29,837,000 ($173.27)
Housing and Community Development: $2,315,000 ($13.44)Transit Utilities: $1,014,000 ($5.89)Local Intergovernmental - Transit Utilities: $627,000 ($3.64)
Miscellaneous - General Revenue - Other: $29,978,000 ($174.09)
Rents: $7,391,000 ($42.92)Interest Earnings: $4,097,000 ($23.79)Special Assessments: $3,416,000 ($19.84)Fines and Forfeits: $3,008,000 ($17.47)Donations From Private Sources: $257,000 ($1.49)Revenue - Water Utilities: $78,641,000 ($456.69)
Transit Utilities: $231,000 ($1.34)State Intergovernmental - Other: $13,250,000 ($76.95)
Highways: $7,627,000 ($44.29)General Local Government Support: $275,000 ($1.60)Transit Utilities: $141,000 ($0.82)Tax - Property: $71,222,000 ($413.60)
General Sales and Gross Receipts: $42,758,000 ($248.31)Other Selective Sales: $9,282,000 ($53.90)Public Utilities Sales: $4,300,000 ($24.97)Occupation and Business License - Other: $3,832,000 ($22.25)Other License: $3,586,000 ($20.82)Documentary and Stock Transfer: $1,397,000 ($8.11)Other: $789,000 ($4.58)
Oceanside government finances - Debt in 2021 (per resident):
Long Term Debt - Outstanding Unspecified Public Purpose: $246,938,000 ($1434.03)
Beginning Outstanding - Unspecified Public Purpose: $225,218,000 ($1307.89)Issue, Unspecified Public Purpose: $67,102,000 ($389.68)Retired Unspecified Public Purpose: $45,381,000 ($263.54)
Oceanside government finances - Cash and Securities in 2021 (per resident):
Bond Funds - Cash and Securities: $58,774,000 ($341.31)
Other Funds - Cash and Securities: $240,734,000 ($1398.00)
Sinking Funds - Cash and Securities: $8,424,000 ($48.92)
5.18% of this county's 2021 resident taxpayers lived in other counties in 2020 ($90,734 average adjusted gross income )
Here:
5.18%California average:
5.19%
0.14% of residents moved from foreign countries ($1,493 average AGI )San Diego County:
0.14%California average:
0.03%
Top counties from which taxpayers relocated into this county between 2020 and 2021:
5.71% of this county's 2020 resident taxpayers moved to other counties in 2021 ($83,556 average adjusted gross income )
Here:
5.71%California average:
6.14%
0.09% of residents moved to foreign countries ($1,067 average AGI )San Diego County:
0.09%California average:
0.02%
Top counties to which taxpayers relocated from this county between 2020 and 2021:
Businesses in Oceanside, CA
Name Count Name Count
24 Hour Fitness 2 Kroger 4 7-Eleven 9 La Quinta 1 99 Cents Only Stores 1 Lane Bryant 1 AT&T 5 LensCrafters 1 Ace Hardware 1 Little Caesars Pizza 5 Albertsons 3 Lowe's 1 Applebee's 1 Marriott 1 Arby's 1 MasterBrand Cabinets 2 AutoZone 3 McDonald's 12 Avenue 1 Men's Wearhouse 1 Barnes & Noble 1 Motel 6 2 Baskin-Robbins 2 Nike 8 Bed Bath & Beyond 1 Nissan 1 Best Western 1 Office Depot 1 Blockbuster 4 Outback 1 Burger King 4 Outback Steakhouse 1 CVS 4 Panda Express 3 Carl\s Jr. 3 Papa John's Pizza 1 Chick-Fil-A 1 Payless 2 Chipotle 1 Penske 1 Chuck E. Cheese's 1 PetSmart 1 Church's Chicken 1 Pier 1 Imports 1 Circle K 5 Pizza Hut 3 Cold Stone Creamery 3 Popeyes 2 Comfort Suites 1 Quality 1 Cricket Wireless 4 Quiznos 2 Curves 1 RadioShack 2 DHL 7 Ramada 1 Dairy Queen 1 Red Lobster 1 Days Inn 1 Rite Aid 3 Dennys 3 Safeway 1 Discount Tire 3 Sprint Nextel 2 Domino's Pizza 3 Staples 1 El Pollo Loco 1 Starbucks 9 Extended Stay America 1 Subway 10 Famous Footwear 1 Super 8 1 FedEx 15 T-Mobile 8 GNC 3 Taco Bell 6 GameStop 2 Target 1 Goodwill 2 Toys"R"Us 2 H&R Block 4 Trader Joe's 1 Holiday Inn 2 Travelodge 1 Home Depot 2 U-Haul 3 HomeTown Buffet 1 UPS 18 IHOP 2 Vans 4 Jack In The Box 5 Verizon Wireless 2 Jamba Juice 2 Vons 1 Jones New York 1 Walgreens 3 KFC 3 Walmart 3 Kincaid 1 Wendy's 3 Kmart 1 YMCA 1 Kohl's 1
Strongest AM radio stations in Oceanside:
KKSM (1320 AM; 0 kW; OCEANSIDE, CA; Owner: PALOMAR COMMUNITY COLLEGE DISTRICT)
KCEO (1000 AM; 2 kW; VISTA, CA; Owner: NORTH COUNTY BROADCASTING CORPORATIO)
KPRZ (1210 AM; 20 kW; SAN MARCOS, CA; Owner: RADIO 1210, INC.)
KFMB (760 AM; 50 kW; SAN DIEGO, CA; Owner: MIDWEST TELEVISION, INC.)
KCBQ (1170 AM; 50 kW; SAN DIEGO, CA; Owner: RADIO 1210, INC.)
KPLS (830 AM; 50 kW; ORANGE, CA; Owner: CRN LICENSES, LLC)
KFI (640 AM; 50 kW; LOS ANGELES, CA; Owner: CAPSTAR TX LIMITED PARTNERSHIP)
KLAC (570 AM; 50 kW; LOS ANGELES, CA; Owner: AMFM RADIO LICENSES, L.L.C.)
KTNQ (1020 AM; 50 kW; LOS ANGELES, CA; Owner: KTNQ-AM LICENSE CORP.)
KXTA (1150 AM; 50 kW; LOS ANGELES, CA; Owner: CITICASTERS LICENSES, L.P.)
KNX (1070 AM; 50 kW; LOS ANGELES, CA; Owner: INFINITY BROADCASTING OPERATIONS, INC.)
KFWB (980 AM; 50 kW; LOS ANGELES, CA; Owner: INFINITY BROADCASTING OPERATIONS, INC.)
KDIS (1110 AM; 50 kW; PASADENA, CA; Owner: ABC,INC.)
Strongest FM radio stations in Oceanside:
KWVE (107.9 FM; SAN CLEMENTE, CA; Owner: CALVARY CHAPEL OF COSTA MESA)
KRTM (88.9 FM; TEMECULA, CA; Owner: PENFOLD COMMUNICATIONS, INC.)
KPRI (102.1 FM; ENCINITAS, CA; Owner: COMPASS RADIO OF SAN DIEGO, INC.)
KFSD-FM (92.1 FM; ESCONDIDO, CA; Owner: NORTH COUNTY BROADCASTING CORP.)
KLQV (102.9 FM; SAN DIEGO, CA; Owner: HBC LICENSE CORPORATION)
KPBS-FM (89.5 FM; SAN DIEGO, CA; Owner: THE BD. OF TRUSTEES, CALIFORNIA STATE UNIVERSITY)
KLVJ (100.1 FM; JULIAN, CA; Owner: EDUCATIONAL MEDIA FOUNDATION)
KLRD (90.1 FM; YUCAIPA, CA; Owner: EDUCATIONAL MEDIA FOUNDATION)
KGBB (103.3 FM; TEMECULA, CA; Owner: CLEAR CHANNEL BROADCASTING LICENSES, INC.)
KMYT (94.5 FM; TEMECULA, CA; Owner: CLEAR CHANNEL BROADCASTING LICENSES, INC.)
KHTS-FM (93.3 FM; EL CAJON, CA; Owner: CITICASTERS LICENSES, L.P.)
KUOR-FM (89.1 FM; REDLANDS, CA; Owner: UNIVERSITY OF REDLANDS)
K210CL (89.9 FM; LEMON GROVE, CA; Owner: SANTA MONICA COMMUNITY COLLEGE DISTRICT)
KGB-FM (101.5 FM; SAN DIEGO, CA; Owner: CITICASTERS LICENSES, L.P.)
KSON-FM (97.3 FM; SAN DIEGO, CA; Owner: JEFFERSON-PILOT COMMUNICATIONS COMPANY OF CALIFORNIA)
KATY-FM (101.3 FM; IDYLLWILD, CA; Owner: ALL PRO BROADCASTING, INC.)
K201AR (88.1 FM; BANNING, CA; Owner: KSGN, INC.)
K232CX (94.3 FM; DESERT HOT SPRINGS, CA; Owner: MCC RADIO, LLC)
KCBS-FM (93.1 FM; LOS ANGELES, CA; Owner: INFINITY BROADCASTING OPERATIONS, INC.)
K252BF (98.3 FM; TEMECULA, CA; Owner: ENTRAVISION HOLDINGS, LLC)
TV broadcast stations around Oceanside:
K26FA (Channel 26; VISTA, CA; Owner: RICK D'AMICO)
KHAX-LP (Channel 49; VISTA, CA; Owner: ENTRAVISION HOLDINGS, LLC)
National Bridge Inventory (NBI) Statistics 89 Number of bridges2,067ft / 630m Total length $9,239,000 Total costs5,580,359 Total average daily traffic269,797 Total average daily truck traffic
New bridges - historical statistics
1 1920-1929 1 1930-1939 3 1940-1949 2 1950-1959 29 1960-1969 27 1970-1979 8 1980-1989 14 1990-1999 3 2000-2009 1 2010-2019
See full National Bridge Inventory statistics for Oceanside, CA
Home Mortgage Disclosure Act Aggregated Statistics For Year 2009(Based on 24 full and 7 partial tracts) A) FHA, FSA/RHS & VA B) Conventional C) Refinancings D) Home Improvement Loans E) Loans on Dwellings For 5+ Families F) Non-occupant Loans on G) Loans On Manufactured Number Average Value Number Average Value Number Average Value Number Average Value Number Average Value Number Average Value Number Average Value
LOANS ORIGINATED 932 $288,951 937 $233,769 2,606 $263,189 77 $181,206 6 $3,930,115 590 $227,709 37 $116,850 APPLICATIONS APPROVED, NOT ACCEPTED 81 $287,574 138 $247,180 301 $283,028 21 $105,914 1 $1,748,850 63 $258,218 16 $76,376 APPLICATIONS DENIED 172 $283,502 216 $228,303 949 $291,096 46 $121,088 1 $1,696,210 201 $220,898 35 $86,137 APPLICATIONS WITHDRAWN 129 $268,314 182 $244,297 634 $289,481 20 $173,098 0 $0 134 $214,642 4 $151,360 FILES CLOSED FOR INCOMPLETENESS 48 $263,366 43 $255,505 163 $281,883 4 $177,418 1 $1,637,720 29 $235,382 3 $104,103
Aggregated Statistics For Year 2008(Based on 24 full and 7 partial tracts) A) FHA, FSA/RHS & VA B) Conventional C) Refinancings D) Home Improvement Loans E) Loans on Dwellings For 5+ Families F) Non-occupant Loans on G) Loans On Manufactured Number Average Value Number Average Value Number Average Value Number Average Value Number Average Value Number Average Value Number Average Value
LOANS ORIGINATED 557 $293,386 1,355 $259,192 1,358 $276,599 130 $152,430 18 $2,520,151 593 $237,101 34 $88,123 APPLICATIONS APPROVED, NOT ACCEPTED 65 $303,570 306 $249,760 354 $305,417 16 $114,330 3 $3,299,670 99 $245,238 71 $99,124 APPLICATIONS DENIED 128 $281,709 465 $271,956 1,094 $335,563 147 $103,468 3 $5,276,573 237 $298,031 55 $87,990 APPLICATIONS WITHDRAWN 124 $286,155 312 $263,754 514 $301,139 32 $187,642 4 $1,533,788 152 $239,849 7 $89,677 FILES CLOSED FOR INCOMPLETENESS 25 $302,222 61 $407,381 130 $329,325 14 $149,767 0 $0 48 $298,279 1 $279,000
Aggregated Statistics For Year 2007(Based on 24 full and 7 partial tracts) A) FHA, FSA/RHS & VA B) Conventional C) Refinancings D) Home Improvement Loans E) Loans on Dwellings For 5+ Families F) Non-occupant Loans on G) Loans On Manufactured Number Average Value Number Average Value Number Average Value Number Average Value Number Average Value Number Average Value Number Average Value
LOANS ORIGINATED 24 $283,988 2,055 $296,837 3,620 $304,943 328 $213,256 39 $3,825,196 787 $347,380 48 $95,825 APPLICATIONS APPROVED, NOT ACCEPTED 0 $0 504 $287,100 1,051 $316,034 86 $180,901 2 $417,500 177 $351,856 40 $86,178 APPLICATIONS DENIED 10 $308,591 793 $283,691 2,833 $342,366 322 $181,931 4 $655,408 378 $336,794 89 $86,012 APPLICATIONS WITHDRAWN 10 $280,566 361 $308,422 1,170 $340,251 97 $212,016 9 $3,224,383 153 $405,703 14 $120,466 FILES CLOSED FOR INCOMPLETENESS 0 $0 100 $331,274 347 $335,422 21 $274,051 3 $523,333 45 $347,363 0 $0
Aggregated Statistics For Year 2006(Based on 24 full and 7 partial tracts) A) FHA, FSA/RHS & VA B) Conventional C) Refinancings D) Home Improvement Loans E) Loans on Dwellings For 5+ Families F) Non-occupant Loans on G) Loans On Manufactured Number Average Value Number Average Value Number Average Value Number Average Value Number Average Value Number Average Value Number Average Value
LOANS ORIGINATED 19 $271,277 3,672 $283,208 5,557 $309,448 513 $192,095 26 $1,875,153 1,024 $329,535 38 $93,172 APPLICATIONS APPROVED, NOT ACCEPTED 0 $0 797 $279,233 1,290 $307,033 105 $195,869 0 $0 204 $319,061 47 $81,577 APPLICATIONS DENIED 2 $265,430 1,358 $291,686 2,973 $339,760 390 $186,968 4 $401,362 357 $365,665 55 $94,464 APPLICATIONS WITHDRAWN 3 $273,333 766 $298,270 1,859 $326,513 157 $216,725 2 $1,007,665 245 $308,031 6 $173,000 FILES CLOSED FOR INCOMPLETENESS 0 $0 193 $275,535 450 $337,008 17 $325,318 1 $740,000 39 $315,366 1 $38,000
Aggregated Statistics For Year 2005(Based on 24 full and 7 partial tracts) A) FHA, FSA/RHS & VA B) Conventional C) Refinancings D) Home Improvement Loans E) Loans on Dwellings For 5+ Families F) Non-occupant Loans on G) Loans On Manufactured Number Average Value Number Average Value Number Average Value Number Average Value Number Average Value Number Average Value Number Average Value
LOANS ORIGINATED 23 $254,954 5,291 $286,821 7,204 $309,144 687 $211,898 36 $2,599,179 1,446 $308,474 45 $102,316 APPLICATIONS APPROVED, NOT ACCEPTED 0 $0 995 $268,645 1,204 $301,047 109 $173,877 0 $0 225 $292,356 59 $92,961 APPLICATIONS DENIED 7 $255,294 1,502 $282,736 2,618 $326,226 426 $166,647 2 $542,500 388 $316,893 72 $97,017 APPLICATIONS WITHDRAWN 5 $294,760 1,053 $293,775 2,032 $323,537 239 $213,837 4 $2,501,900 294 $341,082 18 $150,306 FILES CLOSED FOR INCOMPLETENESS 0 $0 251 $295,539 836 $328,478 42 $165,368 0 $0 70 $308,434 7 $212,886
Aggregated Statistics For Year 2004(Based on 24 full and 7 partial tracts) A) FHA, FSA/RHS & VA B) Conventional C) Refinancings D) Home Improvement Loans E) Loans on Dwellings For 5+ Families F) Non-occupant Loans on G) Loans On Manufactured Number Average Value Number Average Value Number Average Value Number Average Value Number Average Value Number Average Value Number Average Value
LOANS ORIGINATED 40 $239,284 5,050 $283,126 8,593 $263,957 620 $177,330 50 $2,806,749 1,429 $279,092 48 $87,893 APPLICATIONS APPROVED, NOT ACCEPTED 3 $221,770 903 $280,677 1,314 $262,258 99 $158,059 1 $389,650 232 $293,691 42 $77,399 APPLICATIONS DENIED 7 $227,169 1,167 $287,059 2,256 $273,243 395 $136,334 3 $686,997 281 $280,974 76 $91,960 APPLICATIONS WITHDRAWN 7 $190,487 881 $294,882 2,193 $262,912 228 $172,439 4 $1,306,532 183 $285,751 22 $122,102 FILES CLOSED FOR INCOMPLETENESS 2 $205,000 185 $278,139 717 $281,139 51 $116,028 0 $0 47 $293,940 5 $84,170
Aggregated Statistics For Year 2003(Based on 24 full and 7 partial tracts) A) FHA, FSA/RHS & VA B) Conventional C) Refinancings D) Home Improvement Loans E) Loans on Dwellings For 5+ Families F) Non-occupant Loans on Number Average Value Number Average Value Number Average Value Number Average Value Number Average Value Number Average Value
LOANS ORIGINATED 234 $213,768 4,626 $226,367 14,579 $205,728 301 $73,647 49 $1,325,013 1,864 $214,171 APPLICATIONS APPROVED, NOT ACCEPTED 22 $180,369 754 $226,138 2,009 $211,039 62 $57,361 1 $125,420 287 $231,959 APPLICATIONS DENIED 24 $211,155 823 $218,285 2,867 $211,775 245 $62,754 5 $461,400 331 $242,431 APPLICATIONS WITHDRAWN 44 $218,039 638 $249,641 3,336 $212,223 105 $83,913 4 $2,660,250 243 $203,191 FILES CLOSED FOR INCOMPLETENESS 3 $196,910 183 $267,952 524 $221,001 20 $48,447 2 $4,927,500 72 $212,800
Aggregated Statistics For Year 2002(Based on 9 full tracts) A) FHA, FSA/RHS & VA B) Conventional C) Refinancings D) Home Improvement Loans E) Loans on Dwellings For 5+ Families F) Non-occupant Loans on Number Average Value Number Average Value Number Average Value Number Average Value Number Average Value Number Average Value
LOANS ORIGINATED 140 $191,770 1,401 $218,513 2,738 $194,037 83 $61,967 24 $1,517,972 620 $225,500 APPLICATIONS APPROVED, NOT ACCEPTED 22 $177,364 245 $219,269 416 $189,261 21 $37,260 0 $0 80 $209,353 APPLICATIONS DENIED 24 $170,208 283 $198,444 572 $184,318 65 $56,300 7 $871,214 100 $241,918 APPLICATIONS WITHDRAWN 16 $145,500 286 $224,266 599 $185,592 43 $56,562 3 $901,383 77 $195,216 FILES CLOSED FOR INCOMPLETENESS 4 $176,250 86 $252,587 182 $190,760 2 $41,000 0 $0 18 $230,577
Aggregated Statistics For Year 2001(Based on 9 full tracts) A) FHA, FSA/RHS & VA B) Conventional C) Refinancings D) Home Improvement Loans E) Loans on Dwellings For 5+ Families F) Non-occupant Loans on Number Average Value Number Average Value Number Average Value Number Average Value Number Average Value Number Average Value
LOANS ORIGINATED 174 $174,122 823 $186,847 2,104 $171,137 93 $35,551 31 $1,504,907 432 $197,302 APPLICATIONS APPROVED, NOT ACCEPTED 17 $183,471 154 $170,598 297 $164,686 20 $54,065 2 $309,400 55 $204,767 APPLICATIONS DENIED 25 $180,978 192 $177,598 614 $148,829 91 $37,254 5 $428,774 81 $217,529 APPLICATIONS WITHDRAWN 19 $162,303 168 $183,899 452 $154,075 36 $33,181 4 $1,123,958 47 $184,083 FILES CLOSED FOR INCOMPLETENESS 6 $179,500 29 $182,647 134 $173,808 3 $43,000 2 $862,500 13 $286,414
Aggregated Statistics For Year 2000(Based on 9 full tracts) A) FHA, FSA/RHS & VA B) Conventional C) Refinancings D) Home Improvement Loans E) Loans on Dwellings For 5+ Families F) Non-occupant Loans on Number Average Value Number Average Value Number Average Value Number Average Value Number Average Value Number Average Value
LOANS ORIGINATED 246 $152,247 1,009 $165,102 526 $126,417 123 $30,912 26 $750,422 231 $174,190 APPLICATIONS APPROVED, NOT ACCEPTED 27 $169,655 168 $185,819 116 $112,722 51 $34,031 1 $180,000 34 $199,383 APPLICATIONS DENIED 29 $157,961 239 $136,687 304 $114,352 101 $23,065 7 $268,501 35 $172,035 APPLICATIONS WITHDRAWN 40 $145,014 136 $164,216 191 $105,063 26 $32,717 5 $275,400 21 $184,567 FILES CLOSED FOR INCOMPLETENESS 0 $0 49 $170,183 68 $146,728 8 $84,120 7 $1,806,361 11 $175,155
Aggregated Statistics For Year 1999(Based on 11 full and 7 partial tracts) A) FHA, FSA/RHS & VA B) Conventional C) Refinancings D) Home Improvement Loans E) Loans on Dwellings For 5+ Families F) Non-occupant Loans on Number Average Value Number Average Value Number Average Value Number Average Value Number Average Value Number Average Value
LOANS ORIGINATED 907 $146,652 2,442 $135,156 3,233 $127,529 396 $29,138 37 $1,760,718 554 $119,030 APPLICATIONS APPROVED, NOT ACCEPTED 47 $140,854 343 $138,604 767 $129,329 132 $27,984 1 $205,000 92 $137,503 APPLICATIONS DENIED 121 $144,485 636 $118,238 1,455 $112,254 258 $27,915 8 $269,361 126 $118,440 APPLICATIONS WITHDRAWN 87 $141,769 455 $129,201 821 $120,172 40 $42,515 8 $7,332,710 87 $130,926 FILES CLOSED FOR INCOMPLETENESS 17 $144,414 108 $137,394 303 $127,990 7 $75,067 10 $2,546,513 40 $126,248
Detailed mortgage data for all 31 tracts in Oceanside, CA
Private Mortgage Insurance Companies Aggregated Statistics For Year 2009(Based on 24 full and 7 partial tracts) A) Conventional B) Refinancings C) Non-occupant Loans on Number Average Value Number Average Value Number Average Value
LOANS ORIGINATED 92 $264,042 23 $317,711 5 $167,600 APPLICATIONS APPROVED, NOT ACCEPTED 44 $304,759 19 $316,133 4 $141,000 APPLICATIONS DENIED 25 $256,957 12 $306,060 1 $153,000 APPLICATIONS WITHDRAWN 5 $379,844 4 $264,250 0 $0 FILES CLOSED FOR INCOMPLETENESS 12 $288,042 3 $329,627 0 $0
Aggregated Statistics For Year 2008(Based on 24 full and 7 partial tracts) A) Conventional B) Refinancings C) Non-occupant Loans on D) Loans On Manufactured Number Average Value Number Average Value Number Average Value Number Average Value
LOANS ORIGINATED 350 $302,296 70 $342,142 33 $258,924 0 $0 APPLICATIONS APPROVED, NOT ACCEPTED 155 $317,808 91 $368,862 18 $299,101 1 $270,000 APPLICATIONS DENIED 54 $251,678 8 $349,465 18 $197,938 0 $0 APPLICATIONS WITHDRAWN 23 $304,107 10 $316,706 6 $229,900 0 $0 FILES CLOSED FOR INCOMPLETENESS 12 $269,807 5 $278,450 1 $239,000 0 $0
Aggregated Statistics For Year 2007(Based on 24 full and 7 partial tracts) A) Conventional B) Refinancings C) Non-occupant Loans on D) Loans On Manufactured Number Average Value Number Average Value Number Average Value Number Average Value
LOANS ORIGINATED 178 $342,717 105 $389,291 31 $345,580 1 $263,350 APPLICATIONS APPROVED, NOT ACCEPTED 30 $318,730 53 $410,208 9 $290,821 0 $0 APPLICATIONS DENIED 11 $446,963 13 $378,546 1 $178,100 0 $0 APPLICATIONS WITHDRAWN 14 $377,131 14 $416,084 1 $178,100 0 $0 FILES CLOSED FOR INCOMPLETENESS 1 $176,000 2 $384,640 0 $0 0 $0
Aggregated Statistics For Year 2006(Based on 23 full and 7 partial tracts) A) Conventional B) Refinancings C) Non-occupant Loans on Number Average Value Number Average Value Number Average Value
LOANS ORIGINATED 41 $359,592 49 $412,260 4 $316,250 APPLICATIONS APPROVED, NOT ACCEPTED 9 $437,570 25 $421,958 0 $0 APPLICATIONS DENIED 0 $0 4 $496,905 0 $0 APPLICATIONS WITHDRAWN 8 $393,000 12 $587,026 2 $193,500 FILES CLOSED FOR INCOMPLETENESS 0 $0 0 $0 0 $0
Aggregated Statistics For Year 2005(Based on 21 full and 7 partial tracts) A) Conventional B) Refinancings C) Non-occupant Loans on D) Loans On Manufactured Number Average Value Number Average Value Number Average Value Number Average Value
LOANS ORIGINATED 74 $338,789 73 $364,167 16 $294,256 0 $0 APPLICATIONS APPROVED, NOT ACCEPTED 17 $370,466 11 $413,031 4 $276,785 1 $429,000 APPLICATIONS DENIED 2 $439,000 2 $501,500 1 $324,000 0 $0 APPLICATIONS WITHDRAWN 9 $389,057 8 $379,040 2 $347,500 0 $0 FILES CLOSED FOR INCOMPLETENESS 0 $0 1 $204,000 0 $0 0 $0
Aggregated Statistics For Year 2004(Based on 24 full and 7 partial tracts) A) Conventional B) Refinancings C) Non-occupant Loans on D) Loans On Manufactured Number Average Value Number Average Value Number Average Value Number Average Value
LOANS ORIGINATED 135 $325,012 66 $280,818 27 $296,873 1 $158,030 APPLICATIONS APPROVED, NOT ACCEPTED 33 $320,043 40 $299,870 7 $302,003 0 $0 APPLICATIONS DENIED 4 $545,500 2 $371,395 0 $0 0 $0 APPLICATIONS WITHDRAWN 8 $251,709 13 $300,008 3 $243,910 0 $0 FILES CLOSED FOR INCOMPLETENESS 0 $0 2 $123,000 0 $0 0 $0
Aggregated Statistics For Year 2003(Based on 24 full and 7 partial tracts) A) Conventional B) Refinancings C) Non-occupant Loans on Number Average Value Number Average Value Number Average Value
LOANS ORIGINATED 371 $260,913 224 $238,883 46 $241,271 APPLICATIONS APPROVED, NOT ACCEPTED 79 $293,661 112 $236,745 11 $265,872 APPLICATIONS DENIED 8 $277,711 3 $284,333 1 $319,000 APPLICATIONS WITHDRAWN 17 $317,068 27 $236,681 4 $342,545 FILES CLOSED FOR INCOMPLETENESS 0 $0 1 $252,630 0 $0
Aggregated Statistics For Year 2002(Based on 9 full tracts) A) Conventional B) Refinancings C) Non-occupant Loans on Number Average Value Number Average Value Number Average Value
LOANS ORIGINATED 141 $242,800 76 $204,200 21 $219,255 APPLICATIONS APPROVED, NOT ACCEPTED 26 $267,181 27 $214,916 5 $258,012 APPLICATIONS DENIED 1 $270,000 6 $224,500 2 $206,500 APPLICATIONS WITHDRAWN 20 $215,111 14 $189,201 2 $164,500 FILES CLOSED FOR INCOMPLETENESS 1 $275,000 1 $168,000 0 $0
Aggregated Statistics For Year 2001(Based on 9 full tracts) A) Conventional B) Refinancings C) Non-occupant Loans on Number Average Value Number Average Value Number Average Value
LOANS ORIGINATED 174 $210,243 105 $194,917 20 $203,030 APPLICATIONS APPROVED, NOT ACCEPTED 27 $204,716 25 $201,571 7 $179,247 APPLICATIONS DENIED 6 $246,567 6 $199,390 4 $252,600 APPLICATIONS WITHDRAWN 3 $191,490 1 $180,000 0 $0 FILES CLOSED FOR INCOMPLETENESS 0 $0 1 $140,000 0 $0
Aggregated Statistics For Year 2000(Based on 9 full tracts) A) Conventional B) Refinancings C) Non-occupant Loans on Number Average Value Number Average Value Number Average Value
LOANS ORIGINATED 205 $185,218 38 $169,234 31 $160,726 APPLICATIONS APPROVED, NOT ACCEPTED 35 $173,764 12 $157,462 8 $152,921 APPLICATIONS DENIED 11 $174,989 6 $192,167 4 $152,395 APPLICATIONS WITHDRAWN 7 $241,154 1 $144,000 3 $261,407 FILES CLOSED FOR INCOMPLETENESS 1 $143,870 2 $142,500 0 $0
Aggregated Statistics For Year 1999(Based on 11 full and 7 partial tracts) A) Conventional B) Refinancings C) Non-occupant Loans on Number Average Value Number Average Value Number Average Value
LOANS ORIGINATED 507 $172,473 282 $160,521 30 $137,952 APPLICATIONS APPROVED, NOT ACCEPTED 45 $173,588 104 $155,376 9 $125,250 APPLICATIONS DENIED 42 $172,758 25 $186,205 5 $128,762 APPLICATIONS WITHDRAWN 20 $163,582 17 $157,161 2 $85,000 FILES CLOSED FOR INCOMPLETENESS 5 $166,356 5 $173,652 0 $0
Fire-safe hotels and motels in Oceanside, California:
Best Western Oceanside, 1680 Oceanside Blvd, Oceanside, California 92054 Phone: (760) 722-1821, Fax: (760) 967-8969
Travelodge, 1403 Mission Ave, Oceanside, California 92058 Phone: (760) 721-6663, Fax: (760) 967-8649
QUALITY INN & SUITES, 3170 Vista Way, Oceanside, California 92056 Phone: (760) 757-2200, Fax: (760) 757-2389
Extended Stay America - San Diego - Oceanside, 3190 Vista Way, Oceanside, California 92056 Phone: (760) 439-1499, Fax: (760) 439-1494
Rodeway Inn, 1103 N Coast Hwy, Oceanside, California 92054 Phone: (760) 722-1904, Fax: (760) 722-1168
La Quinta Inn Oceanside, 937 N Coast Hwy, Oceanside, California 92054 Phone: (760) 450-0730, Fax: (760) 450-0626
Residence Inn Oceanside, 3603 Ocean Ranch Blvd, Oceanside, California 92056 Phone: (760) 722-9600, Fax: (760) 722-9699
Holiday Inn Oceanside Marina, 1401 Carmelo Dr, Oceanside, California 92054 Phone: (760) 231-7000, Fax: (760) 637-2900
6 other hotels and motels
All 14 fire-safe hotels and motels in Oceanside, California
Most common first names in Oceanside, CA among deceased individuals Name Count Lived (average)
John 694 76.6 years Robert 656 74.8 years William 569 76.1 years Mary 569 79.7 years James 414 72.6 years Charles 368 76.3 years George 348 78.1 years Helen 311 80.6 years Joseph 308 76.6 years Margaret 307 80.2 years
Most common last names in Oceanside, CA among deceased individuals Last name Count Lived (average)
Smith 276 76.8 years Johnson 166 77.4 years Miller 131 75.7 years Brown 121 76.2 years Jones 119 72.3 years Williams 110 75.4 years Wilson 99 75.7 years Anderson 92 75.7 years Davis 80 75.8 years Taylor 69 75.8 years
Oceanside compared to California state average:
Unemployed percentage below state average. Length of stay since moving in below state average. House age below state average. Oceanside, CA compared to other similar cities:
#35 on the list of "Top 101 cities with the smallest temperature differences during a year (population 50,000+)"
#38 on the list of "Top 101 cities with the smallest differences between morning and afternoon humidity (population 50,000+)"
#38 on the list of "Top 101 cities with the smallest humidity differences during a year (population 50,000+)"
#40 on the list of "Top 101 cities with largest percentage of males in industries: utilities (population 50,000+)"
#52 on the list of "Top 101 cities with the highest cost per building permit(population 50,000+)"
#56 on the list of "Top 101 cities with the smallest percentage of high school students in private schools (3,000+ students)"
#60 on the list of "Top 101 cities with largest percentage of males in occupations: health technologists and technicians (population 50,000+)"
#69 on the list of "Top 101 cities with largest percentage of males in occupations: farming, fishing, and forestry occupations (population 50,000+)"
#71 on the list of "Top 101 cities with the lowest average yearly precipitation (population 50,000+)"
#71 on the list of "Top 101 larger cities with the largest decrease or smallest increase in household income from 2000 (population 50,000+)"
#73 on the list of "Top 101 cities with largest percentage of females in occupations: construction and extraction occupations (population 50,000+)"
#74 on the list of "Top 101 cities with the smallest racial income disparities between White and Black householders (with at least 2,000 householders)"
#77 on the list of "Top 101 cities with the lowest average wind speeds (population 50,000+)"
#82 on the list of "Top 101 cities with largest percentage of females in industries: retail trade (population 50,000+)"
#91 on the list of "Top 101 cities with the smallest differences between daily high and daily low temperatures (population 50,000+)"
#92 on the list of "Top 100 cities with highest ratio of median house value to median household income (pop. 50,000+)"
#4 on the list of "Top 101 counties with the most Catholic adherents"
#4 on the list of "Top 101 counties with the highest lead air pollution readings in 2012 (µg/m3 )"
#7 on the list of "Top 101 counties with the most Evangelical Protestant congregations"
#7 on the list of "Top 101 counties with the most Catholic congregations"
#7 on the list of "Top 101 counties with the highest surface withdrawal of fresh water for public supply (pop. 50,000+)"
Top Patent Applicants
Thomas A. Hall (49)
Nathan T. Sargent (47)
Nigel J. Clarke (38)
Brian Bear (30)
Hiroaki Miyagawa (22)
Richard L. Cleghorn (20)
Robert J. Sanchez, Jr. (19)
Joe Mullis (19)
Joseph E. Payne (18)
Nigel Clarke (18)
Total of 1882 patent applications in 2008-2024.

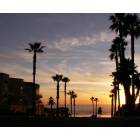

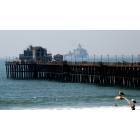

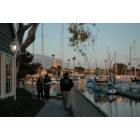
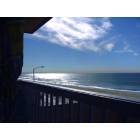
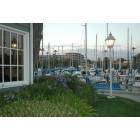
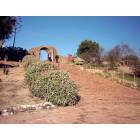
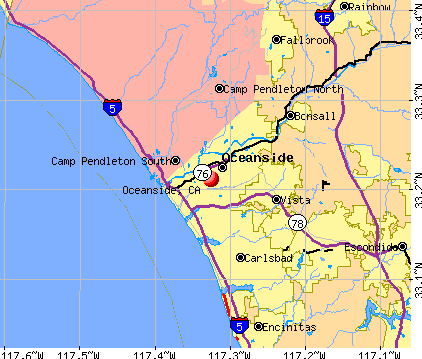


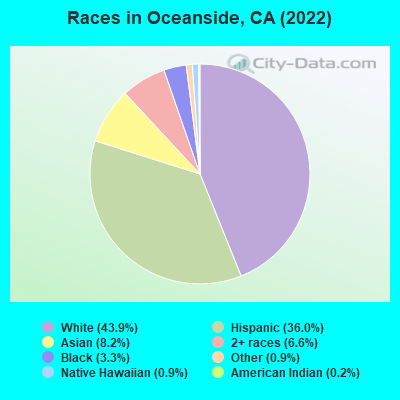
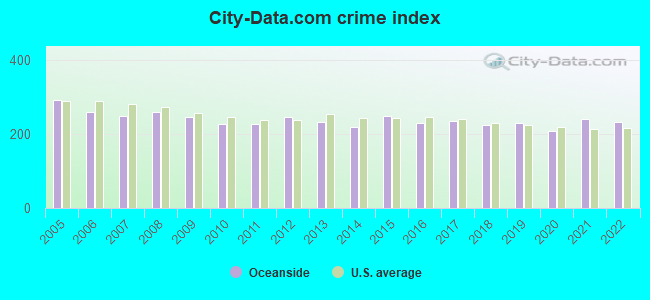
 Recent articles from our blog. Our writers, many of them Ph.D. graduates or candidates, create easy-to-read articles on a wide variety of topics.

 , pop. 288,147).
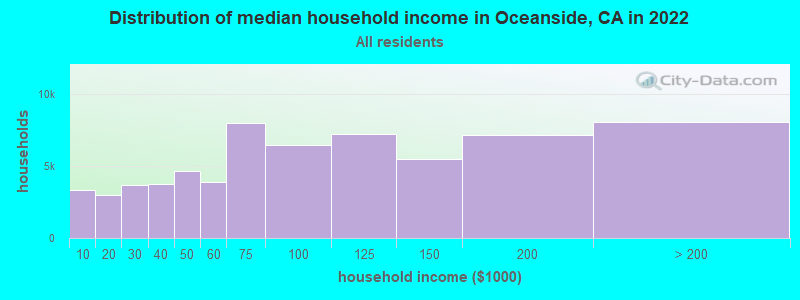
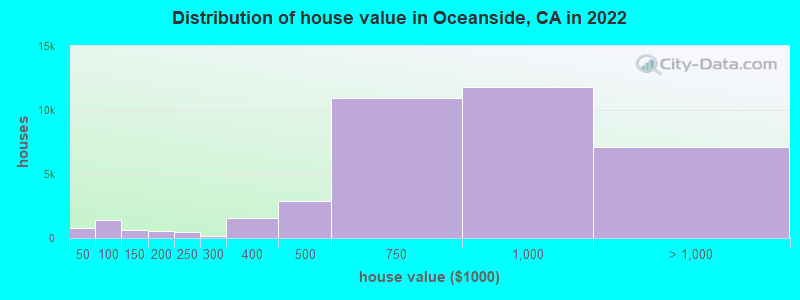
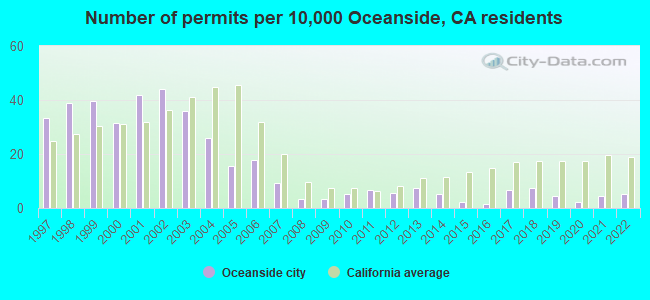
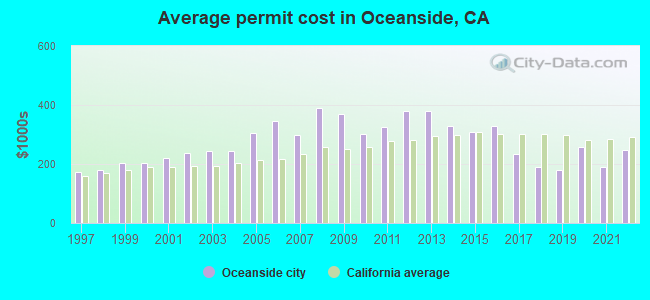
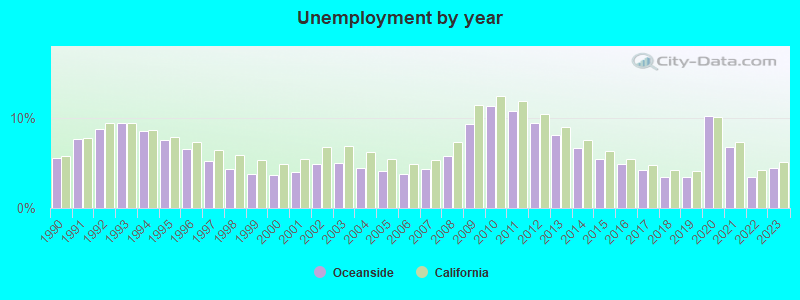
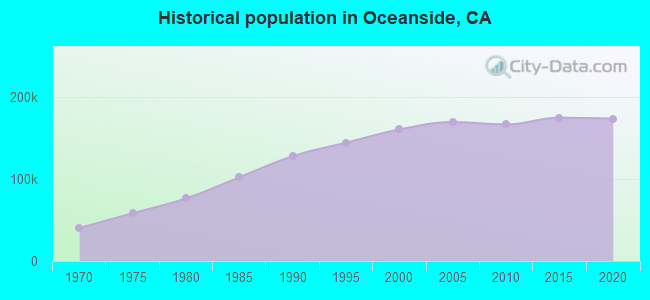
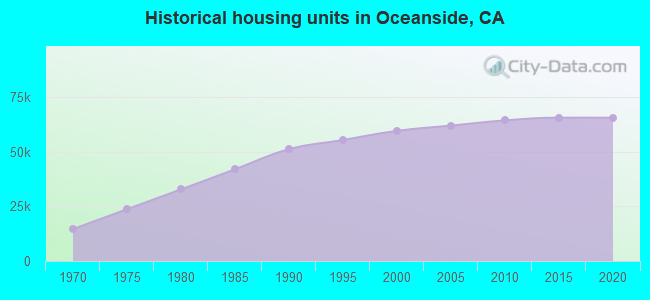
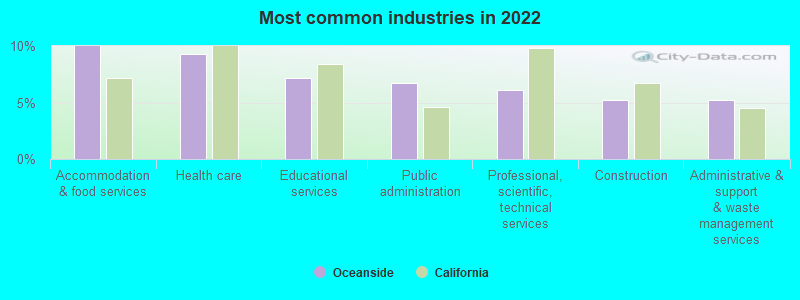
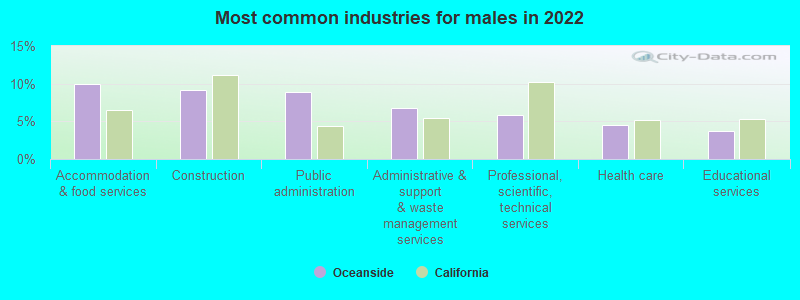
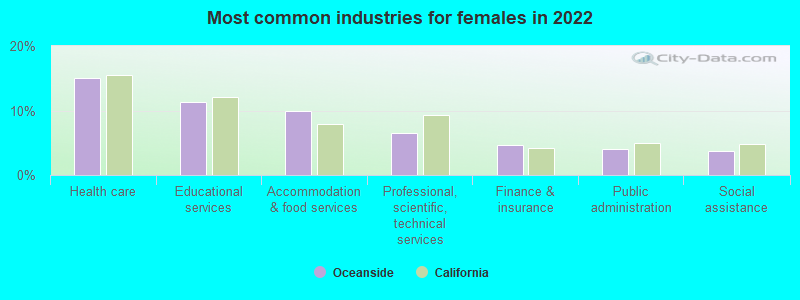
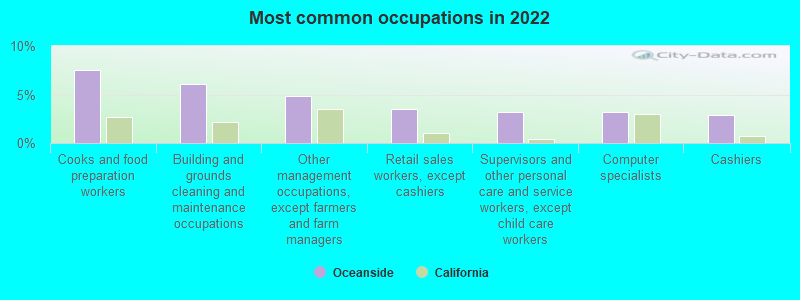
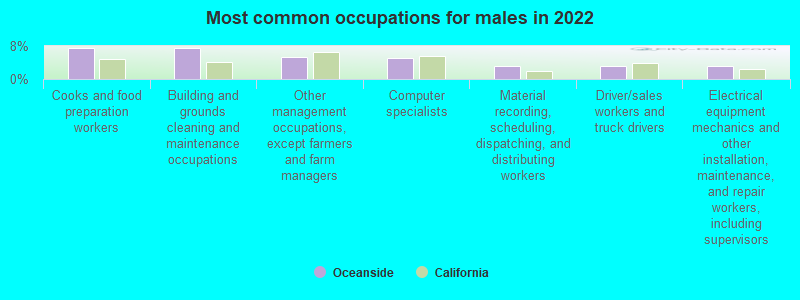
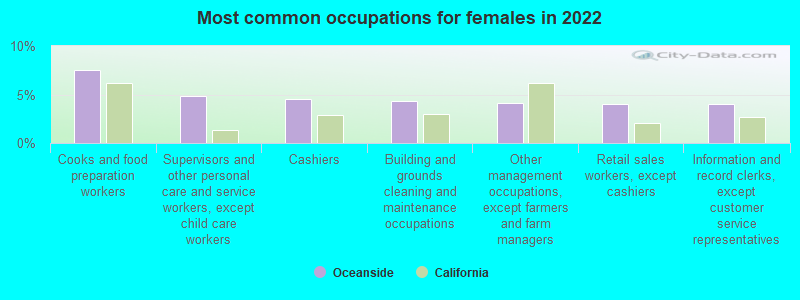
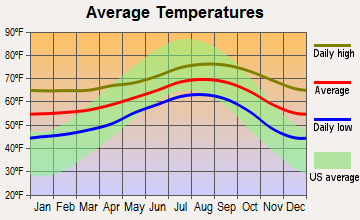
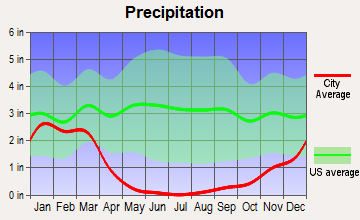
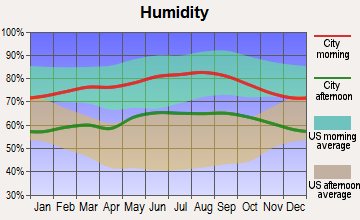
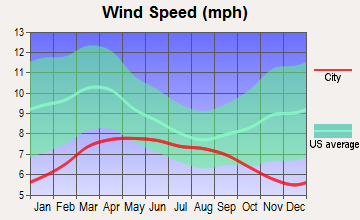
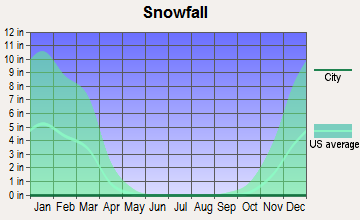
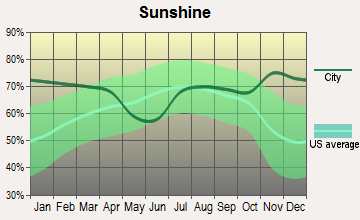
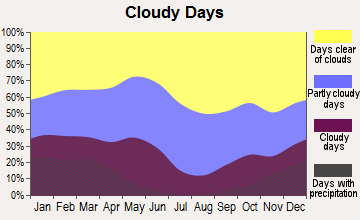
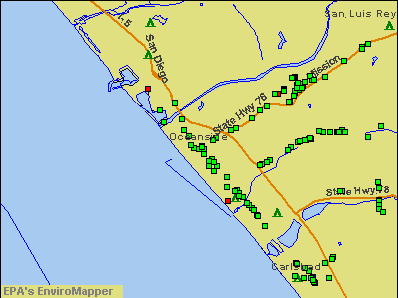

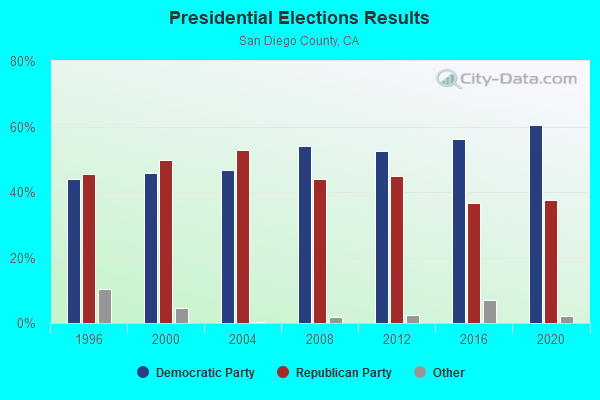
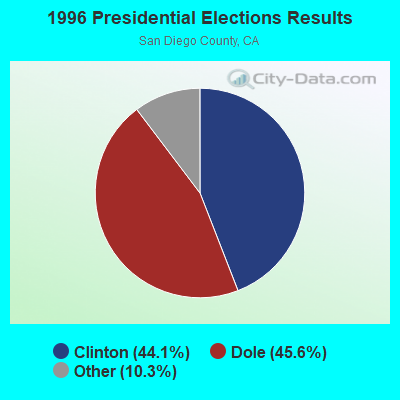
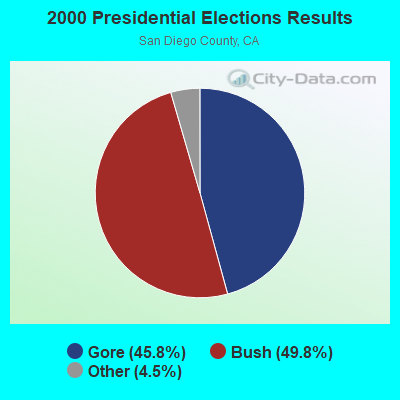
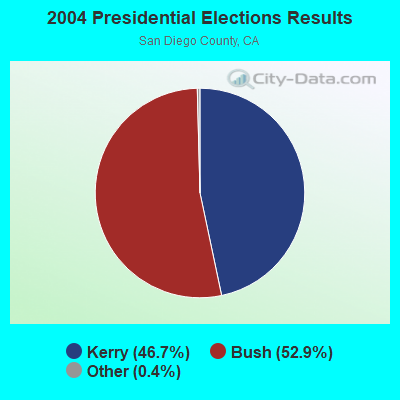
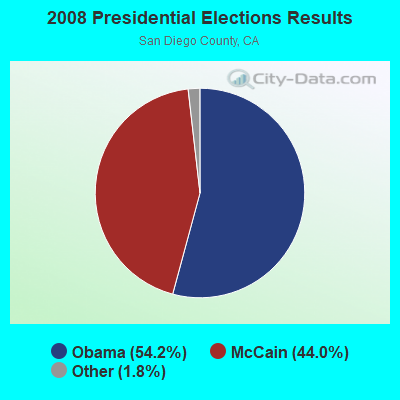
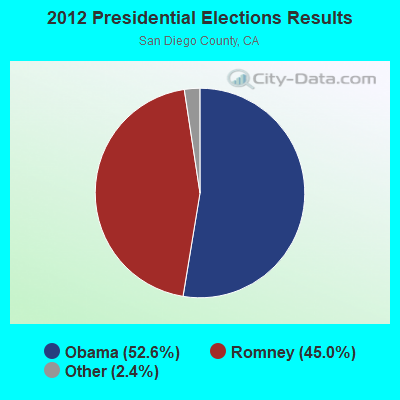
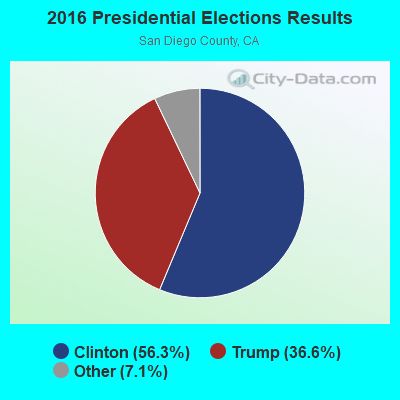
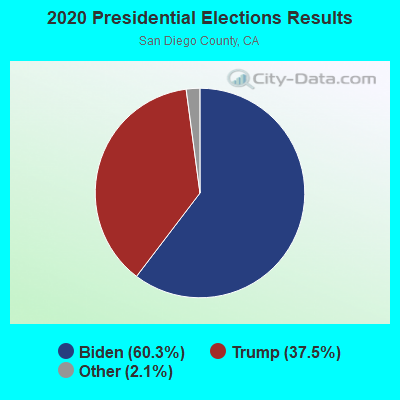
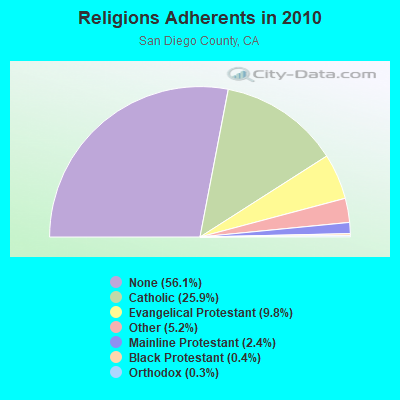
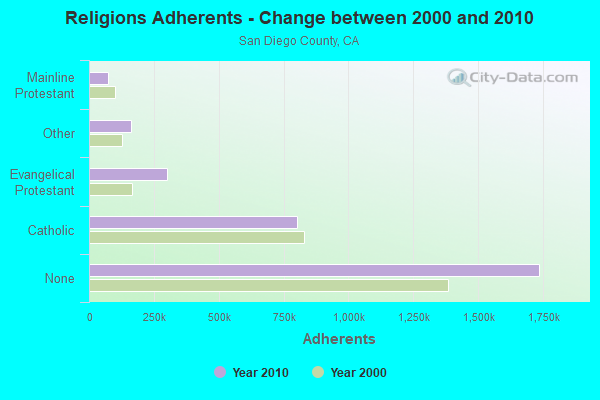
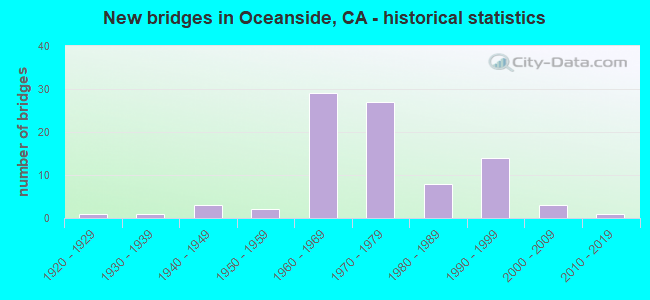
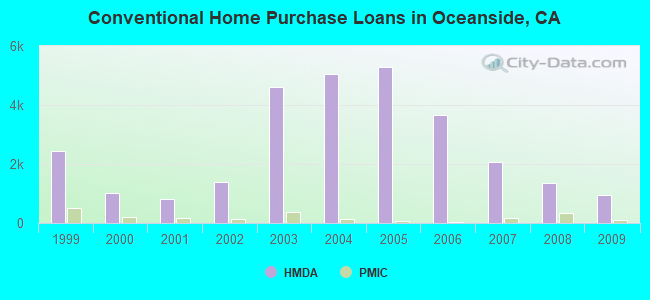
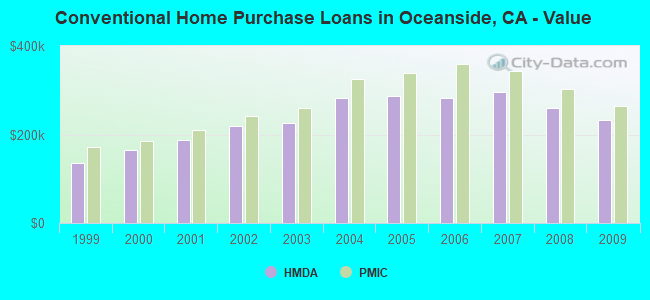
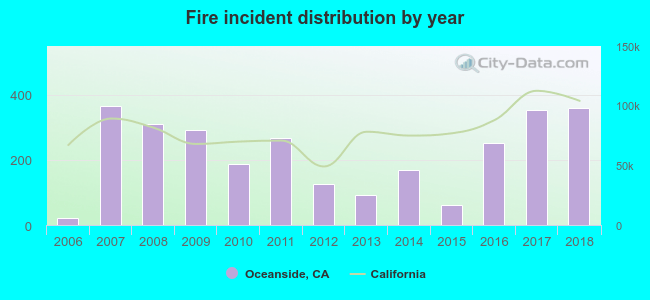 According to the data from the years 2006 - 2018 the average number of fire incidents per year is 219. The highest number of reported fires - 366 took place in 2007, and the least - 22 in 2006. The data has a rising trend.
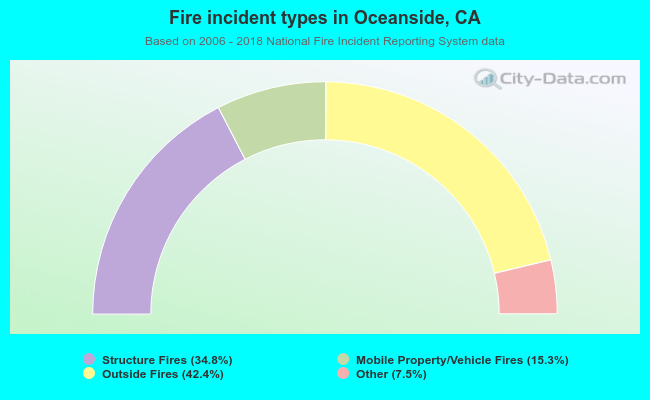 When looking into fire subcategories, the most incidents belonged to: Outside Fires (42.4%), and Structure Fires (34.8%).