Estimated zip code population in 2022: 37,549 Zip code population in 2010: 36,975 Zip code population in 2000: 62,030
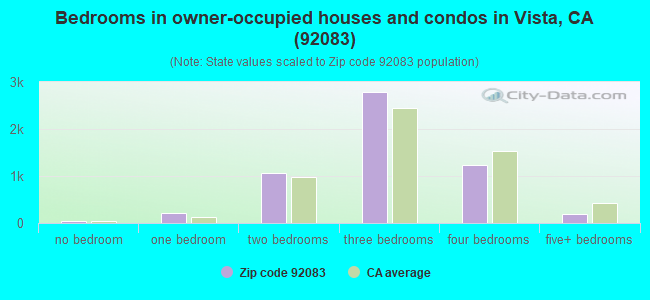
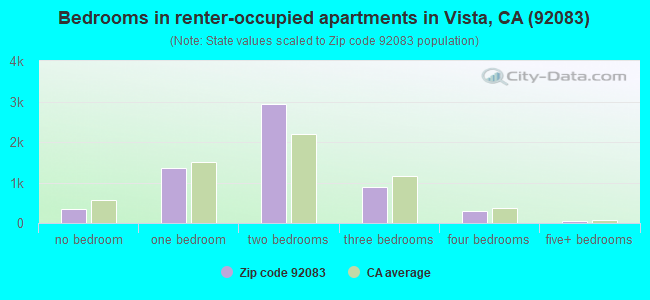
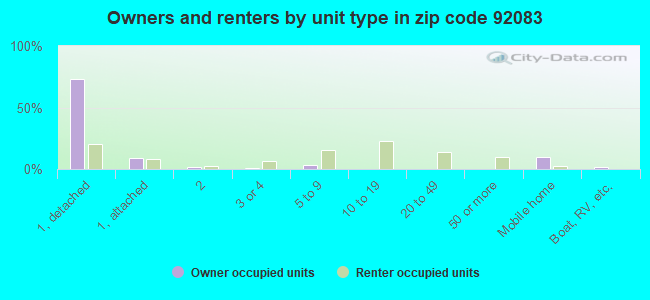
Houses and condos: 11,929 Renter-occupied apartments: 5,891
% of renters here:
51%
State:
44%
March 2022 cost of living index in zip code 92083: 122.0 (high, U.S. average is 100)
Land area: 5.6 sq. mi. Water area: 0.0 sq. mi.
Population density: 6,740 people per square mile
(high).
OSM Map
General Map
Google Map
MSN Map
OSM Map
General Map
Google Map
MSN Map
OSM Map
General Map
Google Map
MSN Map
OSM Map
General Map
Google Map
MSN Map
Please wait while loading the map...
Real estate property taxes paid for housing units in 2022:
This zip code:
0.7% ($4,053)
California:
0.7% ($4,831)
Median real estate property taxes paid for housing units with mortgages in 2022: $4,311 (0.7%) Median real estate property taxes paid for housing units with no mortgage in 2022: $3,244 (0.7%)
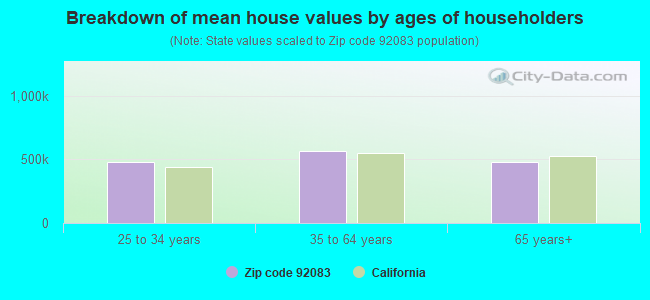
Estimated median house/condo value in 2022: $612,962
92083:
$612,962
California:
$715,900
According to our research of California and other state lists, there were 43 registered sex offenders living in 92083 zip code as of April 27, 2024. The ratio of all residents to sex offenders in zip code 92083 is 881 to 1. The ratio of registered sex offenders to all residents in this zip code is near the state average.
Median resident age:
This zip code:
34.6 years
California median age:
37.9 years
Average household size:
This zip code:
3.2 people
California:
2.8 people
Averages for the 2020 tax year for zip code 92083, filed in 2021:
Average Adjusted Gross Income (AGI) in 2020: $50,372 (Individual Income Tax Returns)
Here:
$50,372
State:
$95,910
Salary/wage: $46,658 (reported on 86.4% of returns)
Here:
$46,658
State:
$77,331
(% of AGI for various income ranges: 1366.6% for AGIs below $25k, 4196.2% for AGIs $25k-50k, 7652.4% for AGIs $50k-75k, 10969.9% for AGIs $75k-100k, 20814.0% for AGIs $100k-200k, 58039.1% for AGIs over 200k)
Taxable interest for individuals: $465 (reported on 22.8% of returns)
This zip code:
$465
California:
$2,294
(% of AGI for various income ranges: 6.5% for AGIs below $25k, 4.9% for AGIs $25k-50k, 17.0% for AGIs $50k-75k, 36.4% for AGIs $75k-100k, 72.1% for AGIs $100k-200k, 150.9% for AGIs over 200k)
Ordinary dividends: $2,081 (reported on 8.6% of returns)
Here:
$2,081
State:
$10,949
(% of AGI for various income ranges: 10.8% for AGIs below $25k, 9.8% for AGIs $25k-50k, 36.9% for AGIs $50k-75k, 46.3% for AGIs $75k-100k, 87.1% for AGIs $100k-200k, 499.1% for AGIs over 200k)
Net capital gain/loss in AGI: +$9,826 (reported on 8.5% of returns)
Here:
+$9,826
State:
+$49,306
(% of AGI for various income ranges: 4.1% for AGIs below $25k, 9.8% for AGIs $25k-50k, 32.6% for AGIs $50k-75k, 89.9% for AGIs $75k-100k, 347.3% for AGIs $100k-200k, 9433.6% for AGIs over 200k)
Profit/loss from business: +$11,769 (reported on 16.6% of returns)
Here:
+$11,769
State:
+$15,671
(% of AGI for various income ranges: 241.5% for AGIs below $25k, 176.2% for AGIs $25k-50k, 302.5% for AGIs $50k-75k, 402.8% for AGIs $75k-100k, 599.4% for AGIs $100k-200k, 3277.3% for AGIs over 200k)
Taxable individual retirement arrangement distribution: $16,584 (reported on 3.3% of returns)
92083:
$16,584
California:
$23,505
(% of AGI for various income ranges: 22.6% for AGIs below $25k, 29.4% for AGIs $25k-50k, 83.9% for AGIs $50k-75k, 175.9% for AGIs $75k-100k, 362.5% for AGIs $100k-200k, 1293.6% for AGIs over 200k)
Self-employed (Keogh) retirement plans: $15,325 (reported on 0.2% of returns)
92083:
$15,325
California:
$30,163
(% of AGI for various income ranges: 63.2% for AGIs $100k-200k)
Total itemized deductions: $28,591 (reported on 9.1% of returns)
Here:
$28,591
State:
$39,517
(% of AGI for various income ranges: 38.0% for AGIs below $25k, 98.2% for AGIs $25k-50k, 374.7% for AGIs $50k-75k, 798.6% for AGIs $75k-100k, 2076.0% for AGIs $100k-200k, 7687.3% for AGIs over 200k)
Charity contributions: $4,907 (reported on 6.6% of returns)
Here:
$4,907
State:
$12,598
(% of AGI for various income ranges: 1.4% for AGIs below $25k, 6.8% for AGIs $25k-50k, 40.4% for AGIs $50k-75k, 61.3% for AGIs $75k-100k, 287.5% for AGIs $100k-200k, 1497.3% for AGIs over 200k)
Taxes paid: $8,186 (reported on 9.0% of returns)
92083:
$8,186
State:
$8,807
(% of AGI for various income ranges: 8.1% for AGIs below $25k, 23.7% for AGIs $25k-50k, 103.8% for AGIs $50k-75k, 257.9% for AGIs $75k-100k, 642.4% for AGIs $100k-200k, 1734.5% for AGIs over 200k)
Earned income credit: $2,128 (reported on 17.7% of returns)
Here:
$2,128
State:
$2,074
(% of AGI for various income ranges: 90.6% for AGIs below $25k, 72.3% for AGIs $25k-50k, 1.1% for AGIs $50k-75k)
Percentage of individuals using paid preparers for their 2020 taxes: 93.0%
Here:
93%
State:
92%
(% for various income ranges: 91.2% for AGIs below $25k, 93.6% for AGIs $25k-50k, 94.2% for AGIs $50k-75k, 94.4% for AGIs $75k-100k, 93.5% for AGIs $100k-200k, 93.5% for AGIs over 200k)
Averages for the 2012 tax year for zip code 92083, filed in 2013:
Average Adjusted Gross Income (AGI) in 2012: $36,672 (Individual Income Tax Returns)
Here:
$36,672
State:
$72,726
Salary/wage: $34,353 (reported on 88.2% of returns)
Here:
$34,353
State:
$59,079
(% of AGI for various income ranges: 80.6% for AGIs below $25k, 86.7% for AGIs $25k-50k, 83.6% for AGIs $50k-75k, 82.4% for AGIs $75k-100k, 82.1% for AGIs $100k-200k, 58.1% for AGIs over 200k)
Taxable interest for individuals: $404 (reported on 22.3% of returns)
This zip code:
$404
California:
$2,146
(% of AGI for various income ranges: 0.3% for AGIs below $25k, 0.2% for AGIs $25k-50k, 0.3% for AGIs $50k-75k, 0.3% for AGIs $75k-100k, 0.2% for AGIs $100k-200k, 0.1% for AGIs over 200k)
Ordinary dividends: $1,723 (reported on 7.3% of returns)
Here:
$1,723
State:
$9,308
(% of AGI for various income ranges: 0.3% for AGIs below $25k, 0.4% for AGIs $25k-50k, 0.4% for AGIs $50k-75k, 0.3% for AGIs $75k-100k, 0.4% for AGIs $100k-200k, 0.2% for AGIs over 200k)
Net capital gain/loss in AGI: +$974 (reported on 5.9% of returns)
Here:
+$974
State:
+$30,460
(% of AGI for various income ranges: 0.1% for AGIs $75k-100k, 0.4% for AGIs $100k-200k, 1.8% for AGIs over 200k)
Profit/loss from business: +$10,852 (reported on 15.0% of returns)
Here:
+$10,852
State:
+$17,064
(% of AGI for various income ranges: 10.6% for AGIs below $25k, 4.3% for AGIs $25k-50k, 3.0% for AGIs $50k-75k, 2.3% for AGIs $75k-100k, 2.5% for AGIs $100k-200k)
Taxable individual retirement arrangement distribution: $12,912 (reported on 3.8% of returns)
92083:
$12,912
California:
$19,557
(% of AGI for various income ranges: 0.8% for AGIs below $25k, 0.9% for AGIs $25k-50k, 1.1% for AGIs $50k-75k, 1.7% for AGIs $75k-100k, 2.9% for AGIs $100k-200k)
Self-employment retirement plans: $12,600 (reported on 0.1% of returns)
92083:
$12,600
California:
$24,530
Total itemized deductions: $21,131 (29% of AGI, reported on 22.4% of returns)
Here:
$21,131
State:
$34,004
Here:
29.3% of AGI
State:
22.7% of AGI
(% of AGI for various income ranges: 6.6% for AGIs below $25k, 9.2% for AGIs $25k-50k, 14.3% for AGIs $50k-75k, 18.4% for AGIs $75k-100k, 19.0% for AGIs $100k-200k, 17.3% for AGIs over 200k)
Charity contributions: $2,456 (reported on 16.5% of returns)
Here:
$2,456
State:
$4,659
(% of AGI for various income ranges: 0.4% for AGIs below $25k, 0.6% for AGIs $25k-50k, 1.3% for AGIs $50k-75k, 1.8% for AGIs $75k-100k, 1.8% for AGIs $100k-200k, 1.9% for AGIs over 200k)
Taxes paid: $6,180 (reported on 22.3% of returns)
92083:
$6,180
State:
$14,448
(% of AGI for various income ranges: 1.2% for AGIs below $25k, 2.1% for AGIs $25k-50k, 4.0% for AGIs $50k-75k, 5.4% for AGIs $75k-100k, 7.0% for AGIs $100k-200k, 7.0% for AGIs over 200k)
Earned income credit: $2,391 (reported on 25.4% of returns)
Here:
$2,391
State:
$2,286
(% of AGI for various income ranges: 6.8% for AGIs below $25k, 1.4% for AGIs $25k-50k)
Percentage of individuals using paid preparers for their 2012 taxes: 64.6%
Here:
65%
State:
64%
(% for various income ranges: 65.3% for AGIs below $25k, 64.2% for AGIs $25k-50k, 63.6% for AGIs $50k-75k, 61.1% for AGIs $75k-100k, 65.4% for AGIs $100k-200k, 71.4% for AGIs over 200k)
Averages for the 2004 tax year for zip code 92083, filed in 2005:
Average Adjusted Gross Income (AGI) in 2004: $35,344 (Individual Income Tax Returns)
Here:
$35,344
State:
$58,600
Salary/wage: $33,083 (reported on 87.7% of returns)
Here:
$33,083
State:
$49,455
(% of AGI for various income ranges: 106.6% for AGIs below $10k, 84.9% for AGIs $10k-25k, 86.6% for AGIs $25k-50k, 85.0% for AGIs $50k-75k, 84.8% for AGIs $75k-100k, 65.7% for AGIs over 100k)
Taxable interest for individuals: $927 (reported on 33.9% of returns)
This zip code:
$927
California:
$2,365
(% of AGI for various income ranges: 3.0% for AGIs below $10k, 0.8% for AGIs $10k-25k, 0.7% for AGIs $25k-50k, 0.8% for AGIs $50k-75k, 0.6% for AGIs $75k-100k, 1.4% for AGIs over 100k)
Taxable dividends: $1,741 (reported on 12.1% of returns)
Here:
$1,741
State:
$4,746
(% of AGI for various income ranges: 1.8% for AGIs below $10k, 0.7% for AGIs $10k-25k, 0.4% for AGIs $25k-50k, 0.5% for AGIs $50k-75k, 0.5% for AGIs $75k-100k, 0.8% for AGIs over 100k)
Net capital gain/loss: +$7,157 (reported on 9.7% of returns)
Here:
+$7,157
State:
+$23,418
(% of AGI for various income ranges: -0.7% for AGIs below $10k, -0.1% for AGIs $10k-25k, 0.3% for AGIs $25k-50k, 0.2% for AGIs $50k-75k, 1.3% for AGIs $75k-100k, 8.8% for AGIs over 100k)
Profit/loss from business: +$10,630 (reported on 15.0% of returns)
Here:
+$10,630
State:
+$16,826
(% of AGI for various income ranges: 8.2% for AGIs below $10k, 6.8% for AGIs $10k-25k, 4.5% for AGIs $25k-50k, 3.4% for AGIs $50k-75k, 2.8% for AGIs $75k-100k, 4.6% for AGIs over 100k)
Profit/loss from farming: +$4,706 (reported on 0.1% of returns)
Here:
+$4,706
State:
-$7,562
IRA payment deduction: $2,738 (reported on 2.0% of returns)
92083:
$2,738
California:
$3,192
(% of AGI for various income ranges: 0.2% for AGIs $10k-25k, 0.2% for AGIs $25k-50k, 0.1% for AGIs $50k-75k, 0.2% for AGIs $75k-100k, 0.1% for AGIs over 100k)
Self-employed pension: $8,625 (reported on 0.5% of returns)
Here:
$8,625
California:
$17,688
Total itemized deductions: $20,989 (33% of AGI, reported on 29.7% of returns)
Here:
$20,989
State:
$28,113
Here:
32.5% of AGI
State:
25.3% of AGI
(% of AGI for various income ranges: 14.9% for AGIs below $10k, 9.3% for AGIs $10k-25k, 15.5% for AGIs $25k-50k, 22.4% for AGIs $50k-75k, 22.2% for AGIs $75k-100k, 20.0% for AGIs over 100k)
Charity contributions deductions: $2,231 (3% of AGI, reported on 24.0% of returns)
Here:
$2,231
State:
$3,923
Here:
3.3% of AGI
State:
3.3% of AGI
(% of AGI for various income ranges: 0.6% for AGIs below $10k, 0.5% for AGIs $10k-25k, 1.1% for AGIs $25k-50k, 1.9% for AGIs $50k-75k, 2.2% for AGIs $75k-100k, 2.2% for AGIs over 100k)
Total tax: $4,247 (reported on 68.0% of returns)
92083:
$4,247
State:
$10,761
(% of AGI for various income ranges: 3.5% for AGIs below $10k, 3.7% for AGIs $10k-25k, 5.8% for AGIs $25k-50k, 7.6% for AGIs $50k-75k, 9.5% for AGIs $75k-100k, 15.7% for AGIs over 100k)
Earned income credit: $1,844 (reported on 20.6% of returns)
Here:
$1,844
State:
$1,763
Percentage of individuals using paid preparers for their 2004 taxes: 68.4%
Here:
68%
State:
66%
(% for various income ranges: 60.9% for AGIs below $10k, 71.8% for AGIs $10k-25k, 70.1% for AGIs $25k-50k, 66.6% for AGIs $50k-75k, 66.0% for AGIs $75k-100k, 67.4% for AGIs over 100k)
Likely homosexual households (counted as self-reported same-sex unmarried-partner households)
Lesbian couples: 0.2% of all households
Gay men: 0.0% of all households
Household received Food Stamps/SNAP in the past 12 months: 1,236 Household did not receive Food Stamps/SNAP in the past 12 months: 10,173
Women who had a birth in the past 12 months: 742 (481 now married, 261 unmarried) Women who did not have a birth in the past 12 months: 8,764 (3,588 now married, 5,171 unmarried)
Housing units in zip code 92083 with a mortgage: 3,935 (335 second mortgage, 9 home equity loan, 228 both second mortgage and home equity loan) Houses without a mortgage: 60
Median monthly owner costs for units with a mortgage: $2,359 Median monthly owner costs for units without a mortgage: $711
Residents with income below the poverty level in 2022:
This zip code:
11.9%
Whole state:
12.2%
Residents with income below 50% of the poverty level in 2022:
This zip code:
6.1%
Whole state:
6.2%
Median number of rooms in houses and condos:
Here:
5.4
State:
6.0
Median number of rooms in apartments:
Here:
3.9
State:
3.9
Notable locations in this zip code not listed on our city pages
Shopping Centers: Broadway Vista Shopping Center (1), Tri-City Square Shopping Center (2), Melrose Center Shopping Center (3). Display/hide their locations on the map
Churches in zip code 92083 include: North San Diego Buddhist Church (A), Assembly of God Church (B), Faith and Love Ministries (C), First Baptist Church of Vista (D), First Samoan Methodist Church (E), Hope Christian Community Church (F), North Vista Baptist Church (G), Saint Francis Catholic Church (H), United Pentecostal Church (I). Display/hide their locations on the map
5,118 married couples with children.
2,336 single-parent households (563 men, 1,773 women).
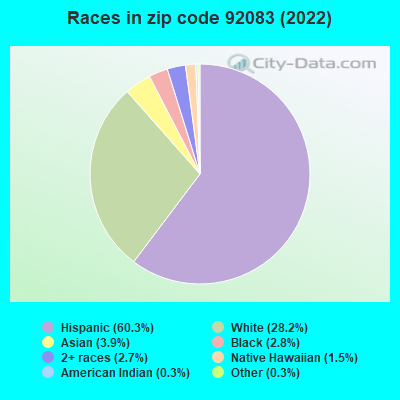
48.9% of residents of 92083 zip code speak English at home.
46.1% of residents speak Spanish at home (63% very well, 16% well, 11% not well, 10% not at all).
0.9% of residents speak other Indo-European language at home (71% very well, 21% well, 6% not well, 2% not at all).
2.7% of residents speak Asian or Pacific Island language at home (55% very well, 28% well, 17% not well).
0.8% of residents speak other language at home (42% very well, 8% well, 7% not well, 44% not at all).
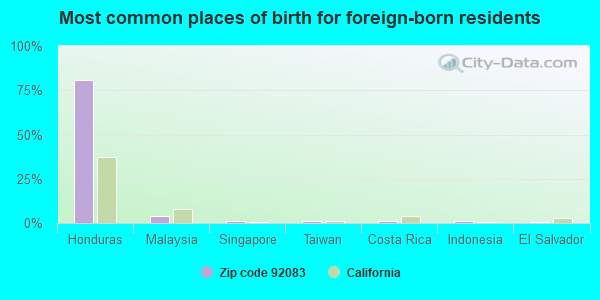
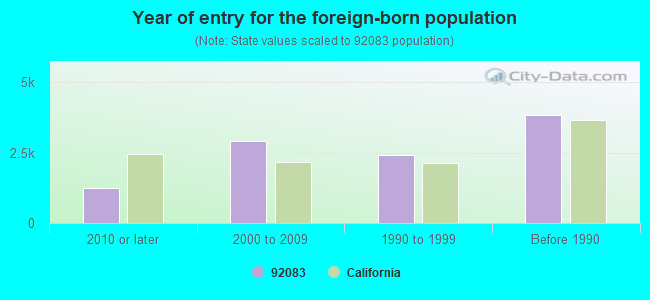
Foreign born population: 10,143 (27.0%) (51.9% of them are naturalized citizens)
Major facilities with environmental interests located in this zip code:
GE OSMONICS (760 SHADOWRIDGE DRIVE in VISTA, CA)
STATE MASTER (California - Hazardous Waste Tracking) - HAZARDOU WASTE PROGRAM CRITERIA AND HAZARDOUS AIR POLLUTANT INVENTORY (Inventory of air pollution sources) HAZARDOUS WASTE BIENNIAL REPORTER (Resource Conservation and Recovery Act (tracking hazardous waste)) Large Quantity Generators, more that 1000 kg of hazardous waste/month (Resource Conservation and Recovery Act (tracking hazardous waste)) TRI REPORTER (Tracking of toxic chemicals releasing facilities) Business SIC classification: MANUFACTURING INDUSTRIES Business NAICS classification: ALL OTHER MISCELLANEOUS MANUFACTURING. Alternative names: DESAL/VESTA, G.E. OSMONICS, OSMONICS DESAL
FERRO ELECTRONIC MATERIALS (1395 ASPEN WAY in VISTA, CA)
STATE MASTER (California - Hazardous Waste Tracking) - HAZARDOU WASTE PROGRAM CRITERIA AND HAZARDOUS AIR POLLUTANT INVENTORY (Inventory of air pollution sources) HAZARDOUS WASTE BIENNIAL REPORTER (Resource Conservation and Recovery Act (tracking hazardous waste)) Large Quantity Generators, more that 1000 kg of hazardous waste/month (Resource Conservation and Recovery Act (tracking hazardous waste)) - notification TRI REPORTER (Tracking of toxic chemicals releasing facilities) Business SIC classification: INDUSTRIAL INORGANIC CHEMICALS Business NAICS classification: ALL OTHER MISCELLANEOUS CHEMICAL PRODUCT AND PREPARATION MANUFACTURING. Organizations: FERRO ELECTRONIC MATERIAL SYSTEMS (CONTACT/OPERATOR)
, FERRO CORP (CONTACT/OWNER)
Alternative names: FERRO ELECTRONIC MATERIAL SYS.
AMERICAN PEPTIDE COMPANY INCORPORATED (1271 AVENIDA CHELSEA in VISTA, CA)
STATE MASTER (California - Hazardous Waste Tracking) - HAZARDOU WASTE PROGRAM Large Quantity Generators, more that 1000 kg of hazardous waste/month (Resource Conservation and Recovery Act (tracking hazardous waste)) - notification Organizations: AMERICAN PEPTIDE COMPANY, INC. (CONTACT/OPERATOR)
Alternative names: AMERICAN PEPTIDE CO INC
JIFFY LUBE (1213 E VISTA WAY in VISTA, CA)
Small Quantity Generators, between 100 kg and 1000 kg of hazardous waste/month (Resource Conservation and Recovery Act (tracking hazardous waste)) Small Quantity Generators, between 100 kg and 1000 kg of hazardous waste/month (Resource Conservation and Recovery Act (tracking hazardous waste)) STATE MASTER (California - Used Oil Recycling System ) - USED OIL RECYCLING, USED OIL PROGRAM Organizations: SAN DIEGO LUBRICANTS (CONTACT/OWNER)
Alternative names: JIFFY LUBE #432
ACCUTECH LLC (2641 LA MIRADA DR in VISTA, CA)
STATE MASTER (California - Hazardous Waste Tracking) - HAZARDOU WASTE PROGRAM HAZARDOUS WASTE BIENNIAL REPORTER (Resource Conservation and Recovery Act (tracking hazardous waste)) Small Quantity Generators, between 100 kg and 1000 kg of hazardous waste/month (Resource Conservation and Recovery Act (tracking hazardous waste)) Business NAICS classification: IN-VITRO DIAGNOSTIC SUBSTANCE MANUFACTURING. Organizations: TAYYEAN LIN, VP OPERATIONS (CONTACT/OPERATOR)
, JAMES WU, CEO, GENERAL PARTNER (CONTACT/OWNER)
Alternative names: ACCUTECH L L C
AMERICAN FAUCET AND COATINGS CO. (3280 CORPORATE VIEW DR. in VISTA, CA)
STATE MASTER (California - Hazardous Waste Tracking) - HAZARDOU WASTE PROGRAM HAZARDOUS WASTE BIENNIAL REPORTER (Resource Conservation and Recovery Act (tracking hazardous waste)) Large Quantity Generators, more that 1000 kg of hazardous waste/month (Resource Conservation and Recovery Act (tracking hazardous waste)) Business NAICS classification: ELECTROPLATING, PLATING, POLISHING, ANODIZING, AND COLORING. Alternative names: AMERICAN FAUCET COATING CORP
7 ELEVEN #13625 SO PAC (470 N MELROSE in VISTA, CA)
STATE MASTER (California - Hazardous Waste Tracking) - HAZARDOU WASTE PROGRAM CRITERIA AND HAZARDOUS AIR POLLUTANT INVENTORY (Inventory of air pollution sources) Small Quantity Generators, between 100 kg and 1000 kg of hazardous waste/month (Resource Conservation and Recovery Act (tracking hazardous waste)) Business SIC classification: GASOLINE SERVICE STATIONS Alternative names: SOUTHLAND / MELROSE DR VISTA
KISS INTERNATIONAL INC (965 PARK CENTER DR in VISTA, CA)
(Integrated Compliance Information System) - ICIS-09-2002-0123, FORMAL ENFORCEMENT ACTION COMPLIANCE ACTIVITY (Tracking inspections of insecticide, fungicide, and rodenticide, and toxic substances)
ARCO #616 (745 SANTA FE AVENUE SOUTH in VISTA, CA)
STATE MASTER (California - Hazardous Waste Tracking) - HAZARDOU WASTE PROGRAM CRITERIA AND HAZARDOUS AIR POLLUTANT INVENTORY (Inventory of air pollution sources) Small Quantity Generators, between 100 kg and 1000 kg of hazardous waste/month (Resource Conservation and Recovery Act (tracking hazardous waste)) - notification Business SIC classification: GASOLINE SERVICE STATIONS Organizations: B P WEST COAST PRODUCTS L L C (CONTACT/OWNER)
Alternative names: ARCO FACILITY NO 03006, BP WEST COAST PRODUCTS LLC 03006, PRESTIGE STATIONS INC NO 0616
ARCO #6315 (1403 SOUTH SANTA FE AVENUE in VISTA, CA)
STATE MASTER (California - Hazardous Waste Tracking) - HAZARDOU WASTE PROGRAM CRITERIA AND HAZARDOUS AIR POLLUTANT INVENTORY (Inventory of air pollution sources) Small Quantity Generators, between 100 kg and 1000 kg of hazardous waste/month (Resource Conservation and Recovery Act (tracking hazardous waste)) - notification Business SIC classification: GASOLINE SERVICE STATIONS Organizations: B P WEST COAST PRODUCTS LLC (CONTACT/OWNER)
Alternative names: ARCO FACILITY NO 06315, BP WEST COAST PRODUCTS LLC 06315, PRESTIGE STATIONS INC NO 6315
EQUILON ENTERPRISES (210 MELROSE SAP NO 120878 in VISTA, CA) . Federal Facility
STATE MASTER (California - Hazardous Waste Tracking) - HAZARDOU WASTE PROGRAM CRITERIA AND HAZARDOUS AIR POLLUTANT INVENTORY (Inventory of air pollution sources) Small Quantity Generators, between 100 kg and 1000 kg of hazardous waste/month (Resource Conservation and Recovery Act (tracking hazardous waste)) - notification Business SIC classification: GASOLINE SERVICE STATIONS Alternative names: TEXACO / MELROSE DR, TEXACO SERVICE STATION
EXXON MOBIL OIL CORP (170 N EMERALD DR in VISTA, CA)
CRITERIA AND HAZARDOUS AIR POLLUTANT INVENTORY (Inventory of air pollution sources) HAZARDOUS WASTE BIENNIAL REPORTER (Resource Conservation and Recovery Act (tracking hazardous waste)) Large Quantity Generators, more that 1000 kg of hazardous waste/month (Resource Conservation and Recovery Act (tracking hazardous waste)) Large Quantity Generators, more that 1000 kg of hazardous waste/month (Resource Conservation and Recovery Act (tracking hazardous waste)) Business SIC classification: GASOLINE SERVICE STATIONS Organizations: EXXONMOBIL OIL CORPORATION (CONTACT/OPERATOR)
, PAUL M AND CHIZUKO KUIDA (CONTACT/OWNER)
Alternative names: EXXONMOBIL OIL CORPORATION 12951, MOBIL / N EMERALD DRIVE VISTA
INTERFACE AIR REPAIR INC (2790 LA MIRADA DR in VISTA, CA)
STATE MASTER (California - Hazardous Waste Tracking) - HAZARDOU WASTE PROGRAM Small Quantity Generators, between 100 kg and 1000 kg of hazardous waste/month (Resource Conservation and Recovery Act (tracking hazardous waste)) - notification Organizations: CHARLENE CENTER (CONTACT/OWNER)
Housing units lacking complete kitchen facilities: 1.4%
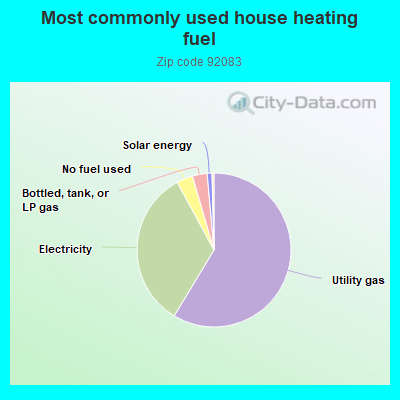
58.6%Utility gas
33.4%Electricity
3.4%No fuel used
3.1%Bottled, tank, or LP gas
1.0%Solar energy
Population in 1990: 50,641. Population change in the 1990s: +11,389 (+22.5%).
Place of birth for U.S.-born residents:
This state: 21,048
Northeast: 1,386
Midwest: 1,888
South: 1,380
West: 1,220
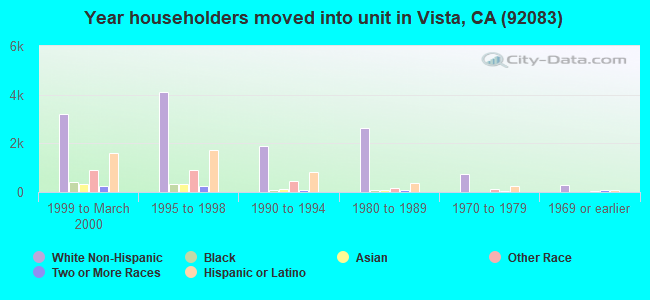
45% of the 92083 zip code residents lived in the same house 5 years ago. Out of people who lived in different houses, 71% lived in this county. Out of people who lived in different counties, 50% lived in California.
90% of the 92083 zip code residents lived in the same house 1 year ago. Out of people who lived in different houses, 61% moved from this county. Out of people who lived in different houses, 18% moved from different county within same state. Out of people who lived in different houses, 18% moved from different state. Out of people who lived in different houses, 1% moved from abroad.
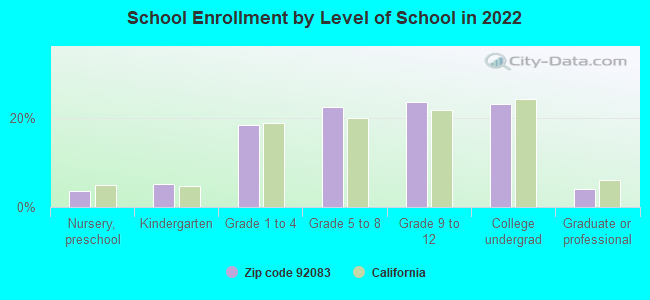
Private vs. public school enrollment:
Students in private schools in grades 1 to 8 (elementary and middle school): 138
Here:
3.7%
California:
10.5%
Students in private schools in grades 9 to 12 (high school): 83
Here:
3.8%
California:
8.5%
Students in private undergraduate colleges: 166
Here:
7.8%
California:
15.9%
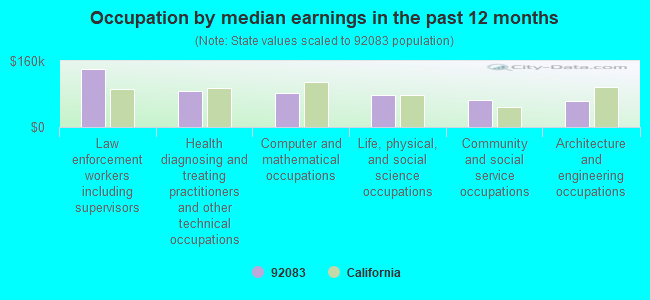
Occupation by median earnings in the past 12 months ($)
139,613Law enforcement workers including supervisors
87,071Health diagnosing and treating practitioners and other technical occupations
82,498Computer and mathematical occupations
76,715Life, physical, and social science occupations
65,841Community and social service occupations
63,712Architecture and engineering occupations
Companies with biggest federal contracts located in this zip code (VISTA, CA):
METRIC SYSTEMS CORPORATION (2320 COUSTEAU COURT; small business) : $1,697,737 in 12 contractsfrom 2001 to 2004
Contracts for Defense Electronics and Communication Equipment -- Advanced Development (R&D), Other Research and Development -- Applied Research and Exploratory Development (R&D), Fiber Optic Switches, Defense Electronics and Communication Equipment -- Applied Research and Exploratory Development (R&D) by Navy Signed by year:2000: $0; 2001: $199,077; 2002: $999,998; 2003: $199,406; 2004: $299,256; 2005: $0; 2006: $0.
Biggest contracts:
$400,131 with Navy for Defense Electronics and Communication Equipment -- Advanced Development (R&D). Signed on 2002-09-03. Completion date: 2004-03-03.
$400,045, same as above.Signed on 2002-07-31. Completion date: 2004-04-23.
$149,646, same as above.Signed on 2004-03-17. Completion date: 2004-10-17.
$149,610, same as above.Signed on 2004-03-17. Completion date: 2004-10-17.
RUSTY WALLIS INC (2011 W VISTA WAY; small business) : $1,066,659 in 20 contractsfrom 1999 to 2005
Contracts for Maintenance, Repair or Alteration of Real Property -- Miscellaneous Buildings, Water Purification Equipment, Water Services, Water Quality Support Services by Navy, Public Buildings Service Signed by year:2000: $0; 2001: $167,474; 2002: $175,843; 2003: $202,302; 2004: $209,634; 2005: $218,166; 2006: $0.
Biggest contracts:
$204,000 with Navy for Maintenance, Repair or Alteration of Real Property -- Miscellaneous Buildings. Signed on 2005-01-16. Completion date: 2006-01-15.
$194,400, same as above.Signed on 2004-01-15. Completion date: 2005-01-14.
$185,220, same as above.Signed on 2003-01-16. Completion date: 2004-01-15.
$176,400, same as above.Signed on 2002-01-15. Completion date: 2002-01-15.
FALCON GENERALENGINEERING INC (572COLLYN ST; small business) : $920,819 in 18 contractsfrom 1999 to 2005
Contracts for Facilities Operations Support Services, Maintenance, Repair or Alteration of Real Property -- Fuel Storage Buildings, Maintenance, Repair or Alteration of Real Property -- Other Non-Building Facilities, Maintenance, Repair or Alteration of Real Property -- Sewage and Waste Facilities by Navy Signed by year:2000: $0; 2001: $0; 2002: $1,405; 2003: $0; 2004: $562,114; 2005: $347,886; 2006: $0.
Biggest contracts:
$100,000 with Navy for Facilities Operations Support Services. Signed on 2005-05-02. Completion date: 2005-09-30.
$100,000, same as above.Signed on 2005-05-02. Completion date: 2005-09-30.
$94,339, same as above.Signed on 2004-06-16. Completion date: 2004-09-30.
$94,339, same as above.Signed on 2004-06-16. Completion date: 2004-09-30.
MACKENZIE AIRCRAFT PARTS INC (1400 DECISION ST; small business) : $820,798 in 40 contractsfrom 1999 to 2006
Contracts for Gas Turbines and Jet Engines, Aircraft; Prime Moving, and Components, Miscellaneous Power Transmission Equipment, Circuit Breakers, Valves, Powered, and moreby Navy, Defense Logistics Agency, Air Force Signed by year:2000: $313,774; 2001: $279,675; 2002: $75,225; 2003: $0; 2004: $29,684; 2005: $31,690; 2006: $9,950.
Biggest contracts:
$112,000 with Navy for Gas Turbines and Jet Engines, Aircraft; Prime Moving, and Components. Signed on 2001-02-19. Completion date: 2001-04-25.
$81,120 with Defense Logistics Agency for Miscellaneous Power Transmission Equipment. Signed on 2000-09-19. Completion date: 2000-11-06.
$75,170 with Defense Logistics Agency for Circuit Breakers. Signed on 2000-11-13. Completion date: 2000-12-28.
$72,150 with Defense Logistics Agency for Valves, Powered. Signed on 2001-05-21. Completion date: 2001-07-05.
KOLLMORGEN MAGNEDYNE (1360 PARK CENTER DRIVE; small business) : $463,395 in 6 contractsfrom 1999 to 2001
Contracts for Liquid and Gas Flow, Liquid Level, and Mechanical Motion Measuring Instruments, Electrical Contact Brushes and Electrodes by Defense Logistics Agency Signed by year:2000: $149,100; 2001: $85,800; 2002: $0; 2003: $0; 2004: $0; 2005: $0; 2006: $0.
Biggest contracts:
$149,100 with Defense Logistics Agency for Liquid and Gas Flow, Liquid Level, and Mechanical Motion Measuring Instruments. Signed on 2000-12-06. Completion date: 2001-08-28.
$139,380, same as above.Signed on 1999-11-24. Completion date: 2000-11-24.
$45,760 with Defense Logistics Agency for Electrical Contact Brushes and Electrodes. Signed on 1999-10-29. Completion date: 2000-02-26.
$43,355, same as above.Signed on 1999-12-20. Completion date: 2000-04-23.
OMARIMAC ENTERPRISES LTD (344 PLUMOSA AVE; small business) : $346,769 in 6 contractsfrom 1999 to 2004
Contracts for Legal Services by Navy Signed by year:2000: $0; 2001: $68,923; 2002: $68,923; 2003: $70,000; 2004: $70,000; 2005: $0; 2006: $0.
Biggest contracts:
$70,000 with Navy for Legal Services. Signed on 2004-08-23. Completion date: 2005-09-30.
$70,000, same as above.Signed on 2003-11-17. Completion date: 2005-09-30.
$68,923, same as above.Signed on 2002-11-18. Completion date: 2005-09-30.
$68,923, same as above.Signed on 2001-12-11. Completion date: 2005-09-30.
RUDY ZANAS (1275 PHILLIPS STREET; small business)
$156,570 with Navy for Miscellaneous Alarm, Signal and Security Detection Systems. Signed on 2005-09-30. Completion date: 2005-12-29.
NEXTEC APPLICATIONS, INC (2611 COMMERCE WAY) : $142,297 in 6 contractsfrom 2002 to 2004
Contracts for Textile Fabrics by Army Signed by year:2000: $0; 2001: $0; 2002: $121,615; 2003: $11,082; 2004: $9,600; 2005: $0; 2006: $0.
Biggest contracts:
$119,938 with Army for Textile Fabrics. Signed on 2002-03-20. Completion date: 2002-04-19.
$21,490, same as above.Signed on 2002-09-12. Completion date: 2002-09-23.
$9,600, same as above.Signed on 2004-09-17. Completion date: 2005-01-14.
$7,002, same as above.Signed on 2003-12-23. Completion date: 2004-04-01.
P K SANTA MARIA (503 EDNA WAY; small business)
$98,000 with Navy for General Health Care Services. Signed on 2002-07-30. Completion date: 2002-08-29.
EAGLE CREEK, INC (3055 ENTERPRISE COURT; small business) : $58,212 in 2 contractsin 2005
$46,500 with Department of Defense for Individual Equipment. Taking place in VA. Signed on 2005-02-25. Completion date: 2005-04-15.
$11,712 with Department of Defense for Individual Equipment. Signed on 2005-06-01. Completion date: 2005-06-30.
Top industries in this zip code by the number of employees in 2005:
Health Care and Social Assistance: Offices of Physicians (except Mental Health Specialists) (100-249 employees: 3 establishments, 50-99 employees: 2 establishments, 20-49 employees: 4 establishments, 10-19 employees: 8 establishments, 5-9 employees: 7 establishments, 1-4 employees: 19 establishments)
Administrative and Support and Waste Management and Remediation Services: Landscaping Services (250-499: 1, 100-249: 1, 50-99: 1, 20-49: 3, 10-19: 4, 5-9: 5, 1-4: 21)
2005 - 2018 National Fire Incident Reporting System (NFIRS) incidents
According to the data from the years 2005 - 2018 the average number of fire incidents per year is 128. The highest number of reported fires - 176 took place in 2005, and the least - 71 in 2015. The data has a declining trend.
When looking into fire subcategories, the most incidents belonged to: Structure Fires (40.0%), and Outside Fires (37.2%).
Fire incident types reported to NFIRS in Zip Code 92083


+$4,706
-$7,562
 Nearest zip codes: 92081, 92010, 92056, 92084, 92057, 92008.
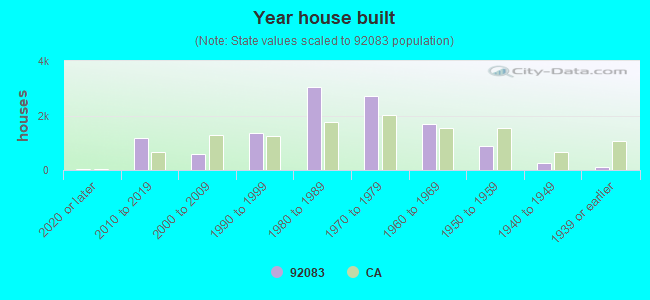


 According to the data from the years 2005 - 2018 the average number of fire incidents per year is 128. The highest number of reported fires - 176 took place in 2005, and the least - 71 in 2015. The data has a declining trend.
 When looking into fire subcategories, the most incidents belonged to: Structure Fires (40.0%), and Outside Fires (37.2%).