Estimated zip code population in 2022: 49,556 Zip code population in 2010: 47,654 Zip code population in 2000: 44,677
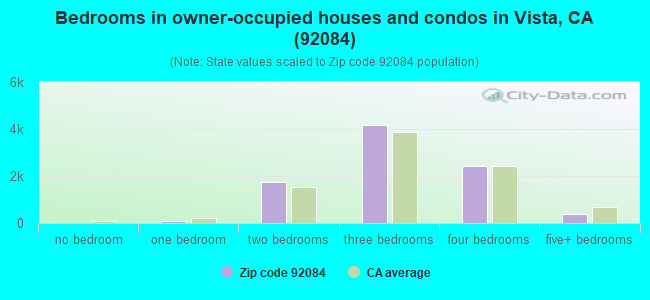
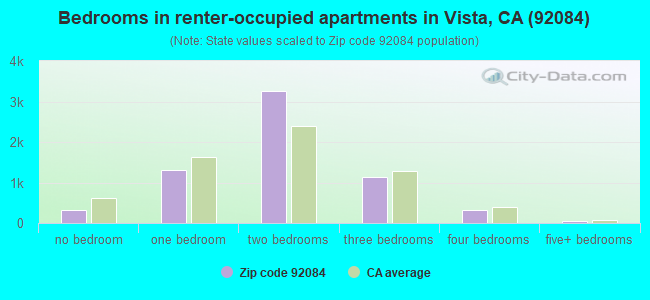
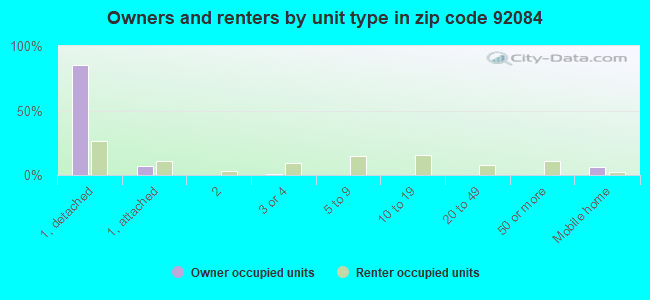
Houses and condos: 15,875 Renter-occupied apartments: 6,427
% of renters here:
42%
State:
44%
March 2022 cost of living index in zip code 92084: 122.1 (high, U.S. average is 100)
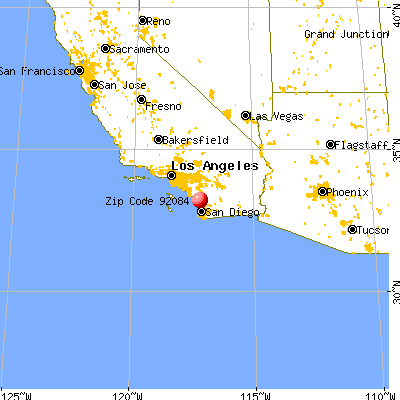
Land area: 26.2 sq. mi. Water area: 0.0 sq. mi.
Population density: 1,894 people per square mile
(low).
OSM Map
General Map
Google Map
MSN Map
OSM Map
General Map
Google Map
MSN Map
OSM Map
General Map
Google Map
MSN Map
OSM Map
General Map
Google Map
MSN Map
Please wait while loading the map...
Real estate property taxes paid for housing units in 2022:
This zip code:
0.6% ($4,633)
California:
0.7% ($4,831)
Median real estate property taxes paid for housing units with mortgages in 2022: $5,110 (0.7%) Median real estate property taxes paid for housing units with no mortgage in 2022: $3,513 (0.5%)
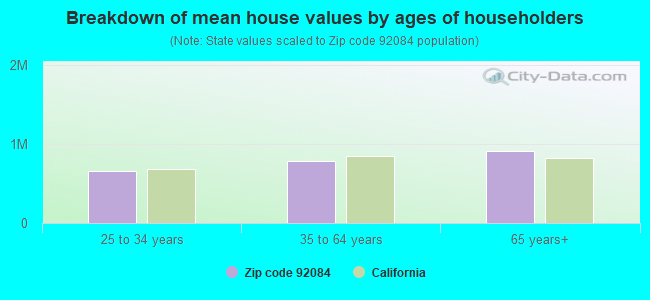
Estimated median house/condo value in 2022: $748,693
92084:
$748,693
California:
$715,900
According to our research of California and other state lists, there were 38 registered sex offenders living in 92084 zip code as of April 27, 2024. The ratio of all residents to sex offenders in zip code 92084 is 1,359 to 1. The ratio of registered sex offenders to all residents in this zip code is lower than the state average.
Median resident age:
This zip code:
36.1 years
California median age:
37.9 years
Average household size:
This zip code:
3.2 people
California:
2.8 people
Averages for the 2020 tax year for zip code 92084, filed in 2021:
Average Adjusted Gross Income (AGI) in 2020: $67,674 (Individual Income Tax Returns)
Here:
$67,674
State:
$95,910
Salary/wage: $55,410 (reported on 80.8% of returns)
Here:
$55,410
State:
$77,331
(% of AGI for various income ranges: 1357.5% for AGIs below $25k, 4134.4% for AGIs $25k-50k, 7420.4% for AGIs $50k-75k, 10608.4% for AGIs $75k-100k, 20323.1% for AGIs $100k-200k, 75565.0% for AGIs over 200k)
Taxable interest for individuals: $1,308 (reported on 30.6% of returns)
This zip code:
$1,308
California:
$2,294
(% of AGI for various income ranges: 13.3% for AGIs below $25k, 15.3% for AGIs $25k-50k, 41.7% for AGIs $50k-75k, 71.7% for AGIs $75k-100k, 200.6% for AGIs $100k-200k, 1153.1% for AGIs over 200k)
Ordinary dividends: $5,778 (reported on 15.3% of returns)
Here:
$5,778
State:
$10,949
(% of AGI for various income ranges: 26.5% for AGIs below $25k, 30.5% for AGIs $25k-50k, 71.0% for AGIs $50k-75k, 193.2% for AGIs $75k-100k, 385.6% for AGIs $100k-200k, 2931.2% for AGIs over 200k)
Net capital gain/loss in AGI: +$26,685 (reported on 15.3% of returns)
Here:
+$26,685
State:
+$49,306
(% of AGI for various income ranges: 4.9% for AGIs below $25k, 21.7% for AGIs $25k-50k, 69.0% for AGIs $50k-75k, 228.4% for AGIs $75k-100k, 715.7% for AGIs $100k-200k, 26185.9% for AGIs over 200k)
Profit/loss from business: +$13,098 (reported on 18.3% of returns)
Here:
+$13,098
State:
+$15,671
(% of AGI for various income ranges: 250.1% for AGIs below $25k, 217.8% for AGIs $25k-50k, 328.6% for AGIs $50k-75k, 541.9% for AGIs $75k-100k, 808.6% for AGIs $100k-200k, 3281.9% for AGIs over 200k)
Taxable individual retirement arrangement distribution: $21,787 (reported on 6.4% of returns)
92084:
$21,787
California:
$23,505
(% of AGI for various income ranges: 37.8% for AGIs below $25k, 56.4% for AGIs $25k-50k, 146.9% for AGIs $50k-75k, 377.0% for AGIs $75k-100k, 855.1% for AGIs $100k-200k, 2886.9% for AGIs over 200k)
Self-employed (Keogh) retirement plans: $21,936 (reported on 0.4% of returns)
92084:
$21,936
California:
$30,163
(% of AGI for various income ranges: 15.2% for AGIs $50k-75k, 29.3% for AGIs $100k-200k, 514.1% for AGIs over 200k)
Total itemized deductions: $33,712 (reported on 13.4% of returns)
Here:
$33,712
State:
$39,517
(% of AGI for various income ranges: 99.2% for AGIs below $25k, 149.2% for AGIs $25k-50k, 499.3% for AGIs $50k-75k, 1115.3% for AGIs $75k-100k, 2698.6% for AGIs $100k-200k, 10800.0% for AGIs over 200k)
Charity contributions: $6,217 (reported on 10.5% of returns)
Here:
$6,217
State:
$12,598
(% of AGI for various income ranges: 5.0% for AGIs below $25k, 12.2% for AGIs $25k-50k, 43.1% for AGIs $50k-75k, 155.2% for AGIs $75k-100k, 386.8% for AGIs $100k-200k, 2096.2% for AGIs over 200k)
Taxes paid: $8,481 (reported on 13.4% of returns)
92084:
$8,481
State:
$8,807
(% of AGI for various income ranges: 19.2% for AGIs below $25k, 31.5% for AGIs $25k-50k, 123.0% for AGIs $50k-75k, 329.7% for AGIs $75k-100k, 794.3% for AGIs $100k-200k, 2205.6% for AGIs over 200k)
Earned income credit: $2,080 (reported on 15.1% of returns)
Here:
$2,080
State:
$2,074
(% of AGI for various income ranges: 89.5% for AGIs below $25k, 68.6% for AGIs $25k-50k, 1.6% for AGIs $50k-75k)
Percentage of individuals using paid preparers for their 2020 taxes: 92.4%
Here:
92%
State:
92%
(% for various income ranges: 90.6% for AGIs below $25k, 92.9% for AGIs $25k-50k, 93.1% for AGIs $50k-75k, 92.8% for AGIs $75k-100k, 94.2% for AGIs $100k-200k, 94.3% for AGIs over 200k)
Averages for the 2012 tax year for zip code 92084, filed in 2013:
Average Adjusted Gross Income (AGI) in 2012: $51,003 (Individual Income Tax Returns)
Here:
$51,003
State:
$72,726
Salary/wage: $43,084 (reported on 81.8% of returns)
Here:
$43,084
State:
$59,079
(% of AGI for various income ranges: 77.2% for AGIs below $25k, 80.5% for AGIs $25k-50k, 73.1% for AGIs $50k-75k, 71.1% for AGIs $75k-100k, 70.1% for AGIs $100k-200k, 49.0% for AGIs over 200k)
Taxable interest for individuals: $1,444 (reported on 31.8% of returns)
This zip code:
$1,444
California:
$2,146
(% of AGI for various income ranges: 0.9% for AGIs below $25k, 0.6% for AGIs $25k-50k, 0.8% for AGIs $50k-75k, 0.9% for AGIs $75k-100k, 1.0% for AGIs $100k-200k, 1.2% for AGIs over 200k)
Ordinary dividends: $5,228 (reported on 15.0% of returns)
Here:
$5,228
State:
$9,308
(% of AGI for various income ranges: 1.2% for AGIs below $25k, 1.0% for AGIs $25k-50k, 1.4% for AGIs $50k-75k, 1.4% for AGIs $75k-100k, 1.4% for AGIs $100k-200k, 2.5% for AGIs over 200k)
Net capital gain/loss in AGI: +$8,387 (reported on 13.5% of returns)
Here:
+$8,387
State:
+$30,460
(% of AGI for various income ranges: 0.1% for AGIs $25k-50k, 0.3% for AGIs $50k-75k, 0.8% for AGIs $75k-100k, 1.2% for AGIs $100k-200k, 8.9% for AGIs over 200k)
Profit/loss from business: +$15,966 (reported on 17.5% of returns)
Here:
+$15,966
State:
+$17,064
(% of AGI for various income ranges: 10.2% for AGIs below $25k, 5.2% for AGIs $25k-50k, 3.9% for AGIs $50k-75k, 4.4% for AGIs $75k-100k, 3.6% for AGIs $100k-200k, 7.2% for AGIs over 200k)
Taxable individual retirement arrangement distribution: $17,578 (reported on 7.8% of returns)
92084:
$17,578
California:
$19,557
(% of AGI for various income ranges: 2.1% for AGIs below $25k, 1.6% for AGIs $25k-50k, 2.7% for AGIs $50k-75k, 3.0% for AGIs $75k-100k, 3.6% for AGIs $100k-200k, 2.6% for AGIs over 200k)
Self-employment retirement plans: $23,918 (reported on 0.5% of returns)
92084:
$23,918
California:
$24,530
(% of AGI for various income ranges: 0.3% for AGIs $50k-75k, 0.2% for AGIs $100k-200k, 0.8% for AGIs over 200k)
Total itemized deductions: $28,239 (27% of AGI, reported on 31.1% of returns)
Here:
$28,239
State:
$34,004
Here:
27.2% of AGI
State:
22.7% of AGI
(% of AGI for various income ranges: 9.9% for AGIs below $25k, 12.3% for AGIs $25k-50k, 17.7% for AGIs $50k-75k, 19.7% for AGIs $75k-100k, 21.6% for AGIs $100k-200k, 18.7% for AGIs over 200k)
Charity contributions: $3,425 (reported on 24.8% of returns)
Here:
$3,425
State:
$4,659
(% of AGI for various income ranges: 0.5% for AGIs below $25k, 0.9% for AGIs $25k-50k, 1.6% for AGIs $50k-75k, 2.0% for AGIs $75k-100k, 2.4% for AGIs $100k-200k, 1.9% for AGIs over 200k)
Taxes paid: $9,724 (reported on 30.9% of returns)
92084:
$9,724
State:
$14,448
(% of AGI for various income ranges: 2.0% for AGIs below $25k, 2.8% for AGIs $25k-50k, 4.7% for AGIs $50k-75k, 5.9% for AGIs $75k-100k, 7.8% for AGIs $100k-200k, 9.4% for AGIs over 200k)
Earned income credit: $2,307 (reported on 20.0% of returns)
Here:
$2,307
State:
$2,286
(% of AGI for various income ranges: 5.8% for AGIs below $25k, 1.3% for AGIs $25k-50k)
Percentage of individuals using paid preparers for their 2012 taxes: 64.7%
Here:
65%
State:
64%
(% for various income ranges: 62.6% for AGIs below $25k, 65.7% for AGIs $25k-50k, 65.7% for AGIs $50k-75k, 64.0% for AGIs $75k-100k, 67.0% for AGIs $100k-200k, 77.8% for AGIs over 200k)
Averages for the 2004 tax year for zip code 92084, filed in 2005:
Average Adjusted Gross Income (AGI) in 2004: $47,513 (Individual Income Tax Returns)
Here:
$47,513
State:
$58,600
Salary/wage: $40,296 (reported on 80.5% of returns)
Here:
$40,296
State:
$49,455
(% of AGI for various income ranges: 182.4% for AGIs below $10k, 78.5% for AGIs $10k-25k, 78.1% for AGIs $25k-50k, 72.5% for AGIs $50k-75k, 74.8% for AGIs $75k-100k, 55.2% for AGIs over 100k)
Taxable interest for individuals: $2,100 (reported on 45.1% of returns)
This zip code:
$2,100
California:
$2,365
(% of AGI for various income ranges: 14.0% for AGIs below $10k, 1.9% for AGIs $10k-25k, 1.5% for AGIs $25k-50k, 1.8% for AGIs $50k-75k, 1.5% for AGIs $75k-100k, 2.2% for AGIs over 100k)
Taxable dividends: $3,542 (reported on 22.0% of returns)
Here:
$3,542
State:
$4,746
(% of AGI for various income ranges: 8.8% for AGIs below $10k, 1.3% for AGIs $10k-25k, 1.1% for AGIs $25k-50k, 1.4% for AGIs $50k-75k, 1.1% for AGIs $75k-100k, 2.1% for AGIs over 100k)
Net capital gain/loss: +$16,834 (reported on 19.3% of returns)
Here:
+$16,834
State:
+$23,418
(% of AGI for various income ranges: 0.1% for AGIs below $10k, 0.1% for AGIs $10k-25k, 0.6% for AGIs $25k-50k, 1.3% for AGIs $50k-75k, 1.3% for AGIs $75k-100k, 15.4% for AGIs over 100k)
Profit/loss from business: +$15,935 (reported on 18.6% of returns)
Here:
+$15,935
State:
+$16,826
(% of AGI for various income ranges: 3.1% for AGIs below $10k, 8.2% for AGIs $10k-25k, 7.2% for AGIs $25k-50k, 6.7% for AGIs $50k-75k, 5.6% for AGIs $75k-100k, 5.4% for AGIs over 100k)
IRA payment deduction: $3,393 (reported on 2.8% of returns)
92084:
$3,393
California:
$3,192
(% of AGI for various income ranges: 0.7% for AGIs below $10k, 0.2% for AGIs $10k-25k, 0.3% for AGIs $25k-50k, 0.3% for AGIs $50k-75k, 0.2% for AGIs $75k-100k, 0.1% for AGIs over 100k)
Self-employed pension: $12,839 (reported on 1.2% of returns)
Here:
$12,839
California:
$17,688
(% of AGI for various income ranges: 0.2% for AGIs $25k-50k, 0.3% for AGIs $50k-75k, 0.2% for AGIs $75k-100k, 0.5% for AGIs over 100k)
Total itemized deductions: $25,830 (29% of AGI, reported on 36.7% of returns)
Here:
$25,830
State:
$28,113
Here:
28.8% of AGI
State:
25.3% of AGI
(% of AGI for various income ranges: 45.7% for AGIs below $10k, 11.7% for AGIs $10k-25k, 17.5% for AGIs $25k-50k, 22.9% for AGIs $50k-75k, 25.9% for AGIs $75k-100k, 19.6% for AGIs over 100k)
Charity contributions deductions: $3,265 (3% of AGI, reported on 31.5% of returns)
Here:
$3,265
State:
$3,923
Here:
3.4% of AGI
State:
3.3% of AGI
(% of AGI for various income ranges: 2.0% for AGIs below $10k, 0.8% for AGIs $10k-25k, 1.5% for AGIs $25k-50k, 2.4% for AGIs $50k-75k, 2.8% for AGIs $75k-100k, 2.5% for AGIs over 100k)
Total tax: $7,307 (reported on 72.1% of returns)
92084:
$7,307
State:
$10,761
(% of AGI for various income ranges: 7.5% for AGIs below $10k, 4.0% for AGIs $10k-25k, 6.3% for AGIs $25k-50k, 8.3% for AGIs $50k-75k, 9.4% for AGIs $75k-100k, 16.7% for AGIs over 100k)
Earned income credit: $1,800 (reported on 15.9% of returns)
Here:
$1,800
State:
$1,763
Percentage of individuals using paid preparers for their 2004 taxes: 68.8%
Here:
69%
State:
66%
(% for various income ranges: 59.0% for AGIs below $10k, 72.2% for AGIs $10k-25k, 68.8% for AGIs $25k-50k, 70.0% for AGIs $50k-75k, 70.1% for AGIs $75k-100k, 74.1% for AGIs over 100k)
Likely homosexual households (counted as self-reported same-sex unmarried-partner households)
Lesbian couples: 0.1% of all households
Gay men: 0.1% of all households
Household received Food Stamps/SNAP in the past 12 months: 1,260 Household did not receive Food Stamps/SNAP in the past 12 months: 13,864
Women who had a birth in the past 12 months: 503 (318 now married, 186 unmarried) Women who did not have a birth in the past 12 months: 12,015 (5,047 now married, 6,955 unmarried)
Housing units in zip code 92084 with a mortgage: 6,203 (465 second mortgage, 20 home equity loan, 410 both second mortgage and home equity loan) Houses without a mortgage: 35
Median monthly owner costs for units with a mortgage: $2,813 Median monthly owner costs for units without a mortgage: $774
Residents with income below the poverty level in 2022:
This zip code:
9.4%
Whole state:
12.2%
Residents with income below 50% of the poverty level in 2022:
This zip code:
4.6%
Whole state:
6.2%
Median number of rooms in houses and condos:
Here:
5.9
State:
6.0
Median number of rooms in apartments:
Here:
3.9
State:
3.9
Notable locations in this zip code not listed on our city pages
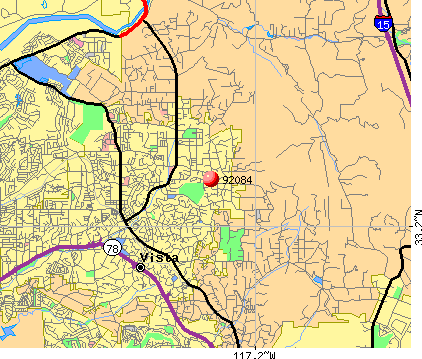
Notable locations in zip code 92084: Vista Valley Country Club (A), Sunrise Terrace Campground (B), Moonlight Ampitheater (C), Vista Paloma Riders Rodeo Arena (D), Vista City Hall (E), Vista Chamber of Commerce (F), Vista Fire Department Station 2 (G), Vista Fire Department Station 3 (H). Display/hide their locations on the map
Churches in zip code 92084 include: All Saints Episcopal Church (A), Calvary Chapel of Vista (B), Emmanuel Baptist Church of Vista (C), Manna Christian Fellowship Church (D), The Interdenominational Church (E), The Church of Jesus Christ of Latter Day Saints (F), Faith Lutheran Church of Vista (G), First Lutheran Church (H), Grace Presbyterian Church (I). Display/hide their locations on the map
Parks in zip code 92084 include: Brengle Terrace City Park (1), Civic Center Park (2), Raintree Park (3), Wildwood Park (4). Display/hide their locations on the map
6,655 married couples with children.
2,842 single-parent households (1,042 men, 1,800 women).
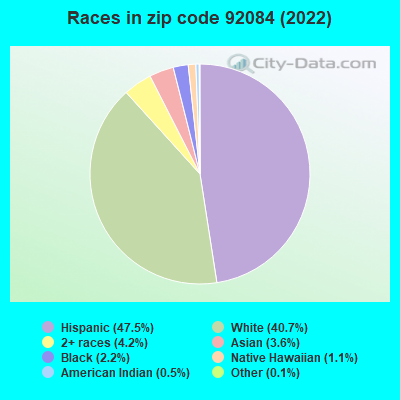
61.8% of residents of 92084 zip code speak English at home.
33.8% of residents speak Spanish at home (65% very well, 17% well, 11% not well, 7% not at all).
1.5% of residents speak other Indo-European language at home (75% very well, 19% well, 6% not well).
1.8% of residents speak Asian or Pacific Island language at home (66% very well, 25% well, 8% not well, 2% not at all).
0.5% of residents speak other language at home (59% very well, 18% well, 23% not well).
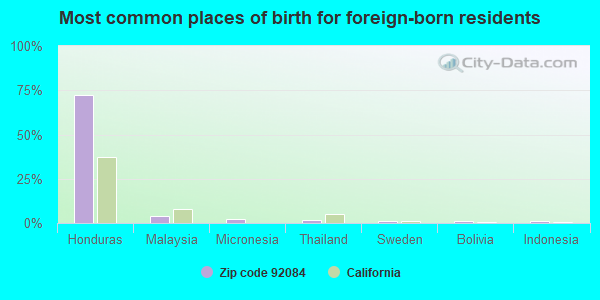
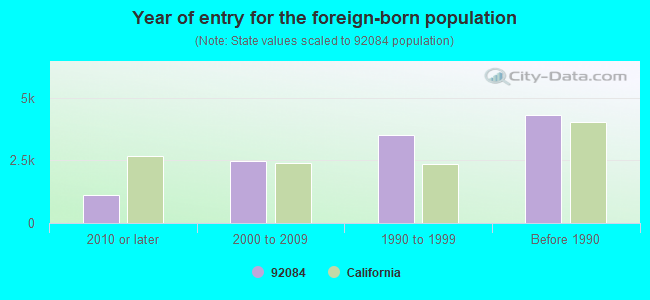
Foreign born population: 11,099 (22.4%) (58.1% of them are naturalized citizens)
Major facilities with environmental interests located in this zip code:
J AND R SCREENPRINTING (2470 S SANTA FE AVE in VISTA, CA)
STATE MASTER (California - Hazardous Waste Tracking) - HAZARDOU WASTE PROGRAM Small Quantity Generators, between 100 kg and 1000 kg of hazardous waste/month (Resource Conservation and Recovery Act (tracking hazardous waste)) - notification Small Quantity Generators, between 100 kg and 1000 kg of hazardous waste/month (Resource Conservation and Recovery Act (tracking hazardous waste)) - notification Organizations: GARY BROWER (CONTACT/OWNER)
Alternative names: CUSTOM CURB INC
LINCOLN MIDDLE SCHOOL (151 ESCONDIDO AVE in VISTA, CA)
COMPLIANCE ACTIVITY (Tracking inspections of insecticide, fungicide, and rodenticide, and toxic substances) (National Center for Education Statistics) - STATE ID-6059802 Organizations: VISTA UNIFIED (SCHOOL DISTRICT)
ALTA VISTA HIGH (CONT.) (1575 BONAIR DR. in VISTA, CA)
(National Center for Education Statistics) - STATE ID-3732039 Organizations: VISTA UNIFIED (SCHOOL DISTRICT)
EMPRESA ELEMENTARY (4850 VIA EMPRESA in VISTA, CA)
(National Center for Education Statistics) - STATE ID-6108708 Organizations: VISTA UNIFIED (SCHOOL DISTRICT)
MONTE VISTA ELEMENTARY (1720 MONTE VISTA DR. in VISTA, CA)
(National Center for Education Statistics) - STATE ID-6040638 Organizations: VISTA UNIFIED (SCHOOL DISTRICT)
INENTEC MEDICAL SVCS CALIFORNIA LLC (2462 S SANTA FE AVE in VISTA, CA)
Conditionally Exempt Small Quantity Generators, less than 100 kg/month of hazardous waste (Resource Conservation and Recovery Act (tracking hazardous waste)) TRANSPORTER (Resource Conservation and Recovery Act (tracking hazardous waste)) Organizations: DAVID L FARMER (CONTACT/OPERATOR)
AEROCURE INC (1025 SERVICE PL STE 202 in VISTA, CA)
Small Quantity Generators, between 100 kg and 1000 kg of hazardous waste/month (Resource Conservation and Recovery Act (tracking hazardous waste)) - notification
GENERAL AUTOMOTIVE SERVICE (460 E VISTA WAY in VISTA, CA)
Small Quantity Generators, between 100 kg and 1000 kg of hazardous waste/month (Resource Conservation and Recovery Act (tracking hazardous waste)) - notification Organizations: A REPAIR SERVICE INC (CONTACT/OWNER)
HK PHOTO CENTER (895 E VISTA WAY in VISTA, CA)
Small Quantity Generators, between 100 kg and 1000 kg of hazardous waste/month (Resource Conservation and Recovery Act (tracking hazardous waste)) - notification Organizations: HARRY KOYAMA (CONTACT/OWNER)
LADY DI CLEANERS (1745 E VISTA WAY SUITE 6 in VISTA, CA)
Small Quantity Generators, between 100 kg and 1000 kg of hazardous waste/month (Resource Conservation and Recovery Act (tracking hazardous waste)) - notification Organizations: PETER MARCONE (CONTACT/OWNER)
LEARMONTH EXXON SERVICE (900 E VISTA WAY in VISTA, CA)
Small Quantity Generators, between 100 kg and 1000 kg of hazardous waste/month (Resource Conservation and Recovery Act (tracking hazardous waste)) Organizations: EXXON CO USA (CONTACT/OWNER)
AAMCO (1144 S SANTA FE in VISTA, CA)
Small Quantity Generators, between 100 kg and 1000 kg of hazardous waste/month (Resource Conservation and Recovery Act (tracking hazardous waste))
EXXON #1043 (911 VISTA WY E in VISTA, CA)
CRITERIA AND HAZARDOUS AIR POLLUTANT INVENTORY (Inventory of air pollution sources) Business SIC classification: GASOLINE SERVICE STATIONS
Housing units lacking complete plumbing facilities: 0.4% Housing units lacking complete kitchen facilities: 1.5%
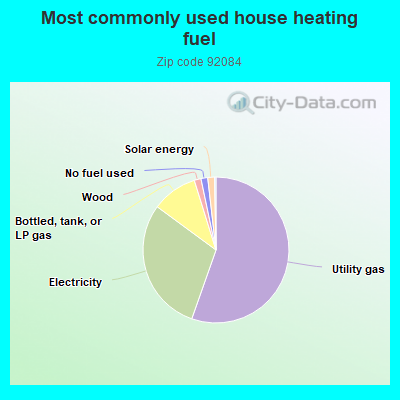
55.4%Utility gas
29.7%Electricity
10.1%Bottled, tank, or LP gas
1.5%Wood
1.5%No fuel used
1.5%Solar energy
Population in 1990: 38,088. Population change in the 1990s: +6,589 (+17.3%).
Place of birth for U.S.-born residents:
This state: 28,447
Northeast: 1,904
Midwest: 3,127
South: 2,200
West: 2,033
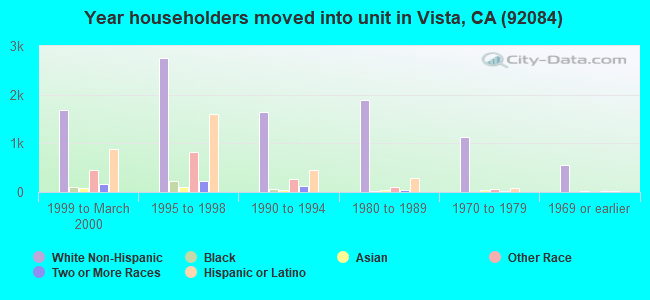
48% of the 92084 zip code residents lived in the same house 5 years ago. Out of people who lived in different houses, 78% lived in this county. Out of people who lived in different counties, 50% lived in California.
91% of the 92084 zip code residents lived in the same house 1 year ago. Out of people who lived in different houses, 67% moved from this county. Out of people who lived in different houses, 14% moved from different county within same state. Out of people who lived in different houses, 12% moved from different state. Out of people who lived in different houses, 6% moved from abroad.
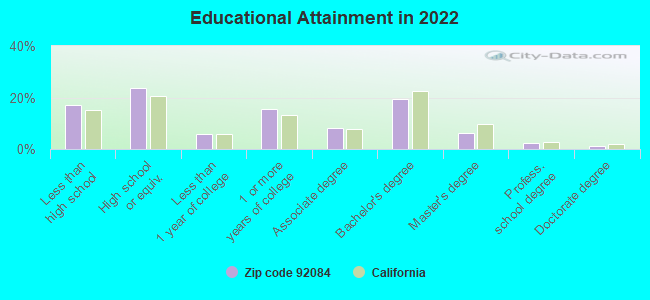
Private vs. public school enrollment:
Students in private schools in grades 1 to 8 (elementary and middle school): 335
Here:
6.5%
California:
10.5%
Students in private schools in grades 9 to 12 (high school): 138
Here:
4.6%
California:
8.5%
Students in private undergraduate colleges: 242
Here:
9.2%
California:
15.9%
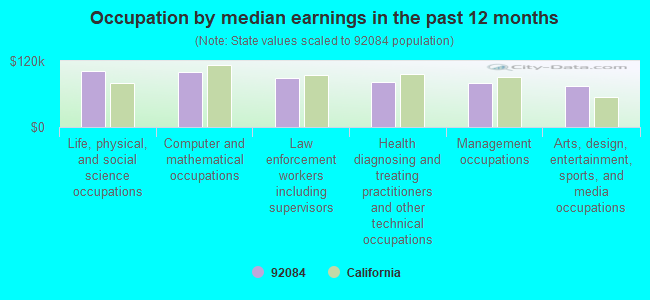
Occupation by median earnings in the past 12 months ($)
102,388Life, physical, and social science occupations
100,261Computer and mathematical occupations
88,460Law enforcement workers including supervisors
82,087Health diagnosing and treating practitioners and other technical occupations
79,919Management occupations
75,058Arts, design, entertainment, sports, and media occupations
Companies with biggest federal contracts located in this zip code (VISTA, CA):
AZTEC TECHNOLOGY CORPORTATION (2550 SOUTH SANTA FE AVE; small business) : $2,773,856 in 109 contractsfrom 2000 to 2006
Contracts for Boxes, Cartons, and Crates, Specialized Shipping and Storage Containers, Prefabricated and Portable Buildings, Miscellaneous Prefabricated Structures, and moreby Air Force, Army, Navy, Defense Logistics Agency, and others Signed by year:2000: $90,846; 2001: $436,366; 2002: $389,119; 2003: $323,100; 2004: $385,122; 2005: $827,914; 2006: $321,389.
Biggest contracts:
$171,370 with Air Force for Boxes, Cartons, and Crates. Signed on 2001-01-16. Completion date: 2001-05-12.
$160,830 with Army for Specialized Shipping and Storage Containers. Signed on 2005-02-07. Completion date: 2005-02-17.
$136,058 with Army for Prefabricated and Portable Buildings. Signed on 2004-09-10. Completion date: 2004-09-30.
$123,374 with Army for Specialized Shipping and Storage Containers. Signed on 2002-04-30. Completion date: 2002-08-20.
ADCO SERVICES INC (2462 S SANTA FE AVE STE C; small business) : $1,088,330 in 16 contractsfrom 2000 to 2005
Contracts for Trash/Garbage Collection Services - Including Portable Sanitation Services, Other Housekeeping Services by Navy Signed by year:2000: $587,124; 2001: $375,681; 2002: $39,406; 2003: $40,495; 2004: $42,115; 2005: $3,509; 2006: $0.
Biggest contracts:
$350,222 with Navy for Trash/Garbage Collection Services - Including Portable Sanitation Services. Signed on 2000-10-01. Completion date: 2000-09-21.
$338,241, same as above.Signed on 2001-10-01. Completion date: 2002-09-30.
$197,194, same as above.Signed on 2000-02-29. Completion date: 2000-03-01.
$42,115 with Navy for Other Housekeeping Services. Signed on 2004-09-01. Completion date: 2005-08-31.
ULTRASOUND ASSISTANCE LLC (973 VALE TERRACE #102; small business) : $600,243 in 6 contractsfrom 2003 to 2005
Contracts for Other Medical Services, Gynecology Services by Navy Signed by year:2000: $0; 2001: $0; 2002: $0; 2003: $89,332; 2004: $218,015; 2005: $292,896; 2006: $0.
Biggest contracts:
$222,168 with Navy for Other Medical Services. Signed on 2005-09-14. Completion date: 2006-09-30.
$162,987 with Navy for Gynecology Services. Signed on 2004-10-05. Completion date: 2004-09-30.
$89,332, same as above.Signed on 2003-11-19. Completion date: 2004-09-30.
$55,028, same as above.Signed on 2004-05-18. Completion date: 2004-09-30.
HEN'S NEST (3550 PICO RD; small business) : $348,983 in 9 contractsfrom 2004 to 2006
Contracts for Non-Food Items For Resale by Defense Commissary Agency Signed by year:2000: $0; 2001: $0; 2002: $0; 2003: $0; 2004: $88,644; 2005: $206,271; 2006: $54,068.
Biggest contracts:
$88,644 with Defense Commissary Agency for Non-Food Items For Resale. Signed on 2004-10-01. Completion date: 2005-09-30.
$54,068, same as above.Signed on 2006-01-01. Completion date: 2006-01-31.
$47,586, same as above.Signed on 2005-04-01. Completion date: 2005-05-31.
$39,799, same as above.Signed on 2005-01-01. Completion date: 2005-09-30.
Q NET SYSTEMS, LLC (1911 WARMLANDS AVE; small business)
$168,250 with Air Force for Miscellaneous Communication Equipment. Signed on 2001-06-20. Completion date: 2001-07-15.
QUADRAMED CORPORATION (110 ESCONDIDO AVENUE SUIT)
$83,735 with Army for ADP Software, Equipment, and Telecommunications Training. Taking place in HI. Signed on 1999-11-24. Completion date: 2000-09-30.
BASSOE ELECTRIC & POWER GENERA (1645 ALTA VISTA DR; small business)
$82,315 with Navy for Generators and Generators Sets, Electrical. Signed on 2003-03-17. Completion date: 2003-05-23.
TERRY MCLENDON (3568 GOPHER CANYON RD; small business) : $80,967 in 5 contractsfrom 2002 to 2006
Contracts for Miscellaneous Alarm, Signal and Security Detection Systems by Navy Signed by year:2000: $0; 2001: $0; 2002: $11,418; 2003: $30,659; 2004: $24,645; 2005: $0; 2006: $14,245.
Biggest contracts:
$26,844 with Navy for Miscellaneous Alarm, Signal and Security Detection Systems. Signed on 2003-06-10. Completion date: 2003-07-31.
$24,645, same as above.Signed on 2004-08-24. Completion date: 2004-09-13.
$14,245, same as above.Signed on 2006-04-25. Completion date: 2006-05-09.
$11,418, same as above.Signed on 2002-11-27. Completion date: 2002-12-05.
CALIFORNIA WATER TECHNOLOGIES, (1230 VIA DEL CERRO; small business) : $77,548 in 2 contractsin 2005
$46,958 with Air Force for Quality Control Services -- Water Purification and Sewage Treatment Equipment. Signed on 2005-10-24. Completion date: 2006-09-30.
$30,590, same as above.Signed on 2005-03-07. Completion date: 2005-03-07.
PRO-EM OF AMERICA (410 S. SANTA FE AVE,STE.20; small business) : $63,450 in 5 contractsin 2000
Contracts for Maintenance, Repair or Alteration of Real Property -- Other Non-Building Facilities, Maintenance, Repair or Alteration of Real Property -- Maintenance Buildings, Maintenance, Repair or Alteration of Real Property -- Miscellaneous Buildings by Bureau of Reclamation, Navy Signed by year:2000: $63,450; 2001: $0; 2002: $0; 2003: $0; 2004: $0; 2005: $0; 2006: $0.
Biggest contracts:
$30,000 with Bureau of Reclamation for Maintenance, Repair or Alteration of Real Property -- Other Non-Building Facilities. Signed on 2000-08-15. Completion date: 2000-08-15.
$20,875 with Navy for Maintenance, Repair or Alteration of Real Property -- Maintenance Buildings. Signed on 2000-02-14. Completion date: 2000-03-14.
$12,000 with Navy for Maintenance, Repair or Alteration of Real Property -- Other Non-Building Facilities. Signed on 2000-03-13. Completion date: 2000-04-19.
$4,900 with Navy for Maintenance, Repair or Alteration of Real Property -- Miscellaneous Buildings. Signed on 2000-06-19. Completion date: 2000-07-28.
Top industries in this zip code by the number of employees in 2005:
2005 - 2018 National Fire Incident Reporting System (NFIRS) incidents
According to the data from the years 2005 - 2018 the average number of fires per year is 76. The highest number of fire incidents - 110 took place in 2005, and the least - 39 in 2010. The data has a decreasing trend.
When looking into fire subcategories, the most incidents belonged to: Outside Fires (44.1%), and Structure Fires (37.9%).
Fire incident types reported to NFIRS in Zip Code 92084


 Nearest zip codes: 92083, 92003, 92069, 92081, 92026, 92057.


 According to the data from the years 2005 - 2018 the average number of fires per year is 76. The highest number of fire incidents - 110 took place in 2005, and the least - 39 in 2010. The data has a decreasing trend.
 When looking into fire subcategories, the most incidents belonged to: Outside Fires (44.1%), and Structure Fires (37.9%).