Estimated zip code population in 2022: 52,612 Zip code population in 2010: 48,922 Zip code population in 2000: 43,426
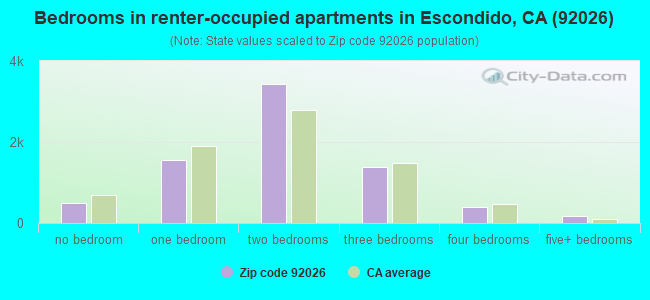
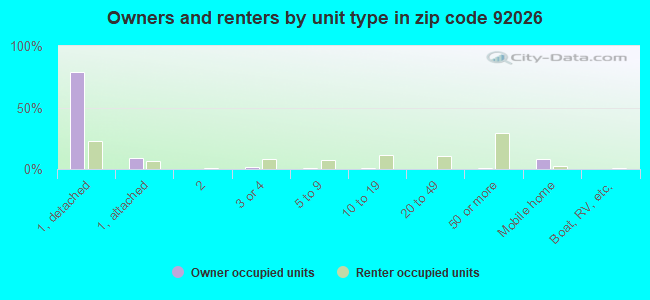
Houses and condos: 20,236 Renter-occupied apartments: 7,445
% of renters here:
38%
State:
44%
March 2022 cost of living index in zip code 92026: 122.4 (high, U.S. average is 100)
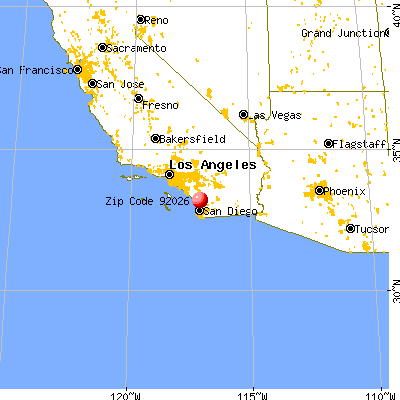
Land area: 37.2 sq. mi. Water area: 0.0 sq. mi.
Population density: 1,414 people per square mile
(low).
OSM Map
General Map
Google Map
MSN Map
OSM Map
General Map
Google Map
MSN Map
OSM Map
General Map
Google Map
MSN Map
OSM Map
General Map
Google Map
MSN Map
Please wait while loading the map...
Real estate property taxes paid for housing units in 2022:
This zip code:
0.7% ($5,012)
California:
0.7% ($4,831)
Median real estate property taxes paid for housing units with mortgages in 2022: $5,473 (0.8%) Median real estate property taxes paid for housing units with no mortgage in 2022: $3,944 (0.6%)
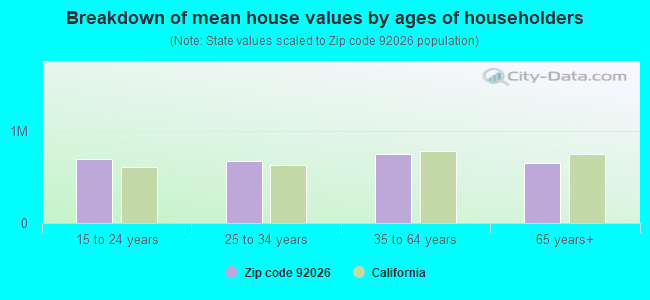
Estimated median house/condo value in 2022: $686,908
92026:
$686,908
California:
$715,900
According to our research of California and other state lists, there were 40 registered sex offenders living in 92026 zip code as of April 27, 2024. The ratio of all residents to sex offenders in zip code 92026 is 1,251 to 1. The ratio of registered sex offenders to all residents in this zip code is lower than the state average.
Median resident age:
This zip code:
38.3 years
California median age:
37.9 years
Average household size:
This zip code:
2.7 people
California:
2.8 people
Averages for the 2020 tax year for zip code 92026, filed in 2021:
Average Adjusted Gross Income (AGI) in 2020: $73,506 (Individual Income Tax Returns)
Here:
$73,506
State:
$95,910
Salary/wage: $64,414 (reported on 80.8% of returns)
Here:
$64,414
State:
$77,331
(% of AGI for various income ranges: 1259.2% for AGIs below $25k, 4043.8% for AGIs $25k-50k, 7314.7% for AGIs $50k-75k, 10173.0% for AGIs $75k-100k, 19919.9% for AGIs $100k-200k, 76416.1% for AGIs over 200k)
Taxable interest for individuals: $1,394 (reported on 36.4% of returns)
This zip code:
$1,394
California:
$2,294
(% of AGI for various income ranges: 21.4% for AGIs below $25k, 20.2% for AGIs $25k-50k, 50.3% for AGIs $50k-75k, 91.9% for AGIs $75k-100k, 140.7% for AGIs $100k-200k, 1311.2% for AGIs over 200k)
Ordinary dividends: $5,412 (reported on 18.2% of returns)
Here:
$5,412
State:
$10,949
(% of AGI for various income ranges: 35.0% for AGIs below $25k, 39.4% for AGIs $25k-50k, 99.0% for AGIs $50k-75k, 166.8% for AGIs $75k-100k, 298.7% for AGIs $100k-200k, 2505.4% for AGIs over 200k)
Net capital gain/loss in AGI: +$15,755 (reported on 17.8% of returns)
Here:
+$15,755
State:
+$49,306
(% of AGI for various income ranges: 9.0% for AGIs below $25k, 24.9% for AGIs $25k-50k, 95.6% for AGIs $50k-75k, 159.5% for AGIs $75k-100k, 538.0% for AGIs $100k-200k, 13250.2% for AGIs over 200k)
Profit/loss from business: +$12,113 (reported on 17.4% of returns)
Here:
+$12,113
State:
+$15,671
(% of AGI for various income ranges: 188.0% for AGIs below $25k, 202.6% for AGIs $25k-50k, 278.6% for AGIs $50k-75k, 342.7% for AGIs $75k-100k, 592.2% for AGIs $100k-200k, 2716.6% for AGIs over 200k)
Taxable individual retirement arrangement distribution: $19,591 (reported on 8.2% of returns)
92026:
$19,591
California:
$23,505
(% of AGI for various income ranges: 61.5% for AGIs below $25k, 91.1% for AGIs $25k-50k, 219.2% for AGIs $50k-75k, 392.6% for AGIs $75k-100k, 680.5% for AGIs $100k-200k, 1891.0% for AGIs over 200k)
Self-employed (Keogh) retirement plans: $19,350 (reported on 0.5% of returns)
92026:
$19,350
California:
$30,163
(% of AGI for various income ranges: 10.7% for AGIs $50k-75k, 23.4% for AGIs $100k-200k, 369.8% for AGIs over 200k)
Total itemized deductions: $33,526 (reported on 16.4% of returns)
Here:
$33,526
State:
$39,517
(% of AGI for various income ranges: 99.1% for AGIs below $25k, 169.7% for AGIs $25k-50k, 589.1% for AGIs $50k-75k, 1165.8% for AGIs $75k-100k, 2434.7% for AGIs $100k-200k, 10191.0% for AGIs over 200k)
Charity contributions: $7,604 (reported on 13.1% of returns)
Here:
$7,604
State:
$12,598
(% of AGI for various income ranges: 6.0% for AGIs below $25k, 14.1% for AGIs $25k-50k, 62.0% for AGIs $50k-75k, 126.8% for AGIs $75k-100k, 349.4% for AGIs $100k-200k, 3284.6% for AGIs over 200k)
Taxes paid: $8,664 (reported on 16.4% of returns)
92026:
$8,664
State:
$8,807
(% of AGI for various income ranges: 19.6% for AGIs below $25k, 39.0% for AGIs $25k-50k, 153.9% for AGIs $50k-75k, 348.5% for AGIs $75k-100k, 722.7% for AGIs $100k-200k, 2041.7% for AGIs over 200k)
Earned income credit: $2,011 (reported on 12.1% of returns)
Here:
$2,011
State:
$2,074
(% of AGI for various income ranges: 76.7% for AGIs below $25k, 61.2% for AGIs $25k-50k, 1.0% for AGIs $50k-75k)
Percentage of individuals using paid preparers for their 2020 taxes: 92.1%
Here:
92%
State:
92%
(% for various income ranges: 90.3% for AGIs below $25k, 91.7% for AGIs $25k-50k, 92.8% for AGIs $50k-75k, 92.4% for AGIs $75k-100k, 93.7% for AGIs $100k-200k, 95.2% for AGIs over 200k)
Averages for the 2012 tax year for zip code 92026, filed in 2013:
Average Adjusted Gross Income (AGI) in 2012: $57,112 (Individual Income Tax Returns)
Here:
$57,112
State:
$72,726
Salary/wage: $49,976 (reported on 81.3% of returns)
Here:
$49,976
State:
$59,079
(% of AGI for various income ranges: 73.1% for AGIs below $25k, 78.1% for AGIs $25k-50k, 73.6% for AGIs $50k-75k, 72.5% for AGIs $75k-100k, 75.0% for AGIs $100k-200k, 54.3% for AGIs over 200k)
Taxable interest for individuals: $1,315 (reported on 37.4% of returns)
This zip code:
$1,315
California:
$2,146
(% of AGI for various income ranges: 1.2% for AGIs below $25k, 0.7% for AGIs $25k-50k, 1.0% for AGIs $50k-75k, 0.9% for AGIs $75k-100k, 0.7% for AGIs $100k-200k, 1.0% for AGIs over 200k)
Ordinary dividends: $4,662 (reported on 18.1% of returns)
Here:
$4,662
State:
$9,308
(% of AGI for various income ranges: 1.6% for AGIs below $25k, 1.1% for AGIs $25k-50k, 1.6% for AGIs $50k-75k, 1.2% for AGIs $75k-100k, 1.3% for AGIs $100k-200k, 2.2% for AGIs over 200k)
Net capital gain/loss in AGI: +$10,855 (reported on 16.1% of returns)
Here:
+$10,855
State:
+$30,460
(% of AGI for various income ranges: 0.4% for AGIs $50k-75k, 0.5% for AGIs $75k-100k, 1.1% for AGIs $100k-200k, 15.0% for AGIs over 200k)
Profit/loss from business: +$13,211 (reported on 17.0% of returns)
Here:
+$13,211
State:
+$17,064
(% of AGI for various income ranges: 9.8% for AGIs below $25k, 4.9% for AGIs $25k-50k, 3.5% for AGIs $50k-75k, 3.5% for AGIs $75k-100k, 3.0% for AGIs $100k-200k, 2.6% for AGIs over 200k)
Taxable individual retirement arrangement distribution: $17,040 (reported on 10.6% of returns)
92026:
$17,040
California:
$19,557
(% of AGI for various income ranges: 3.2% for AGIs below $25k, 2.6% for AGIs $25k-50k, 2.8% for AGIs $50k-75k, 3.7% for AGIs $75k-100k, 3.5% for AGIs $100k-200k, 2.9% for AGIs over 200k)
Self-employment retirement plans: $15,655 (reported on 0.5% of returns)
92026:
$15,655
California:
$24,530
(% of AGI for various income ranges: 0.2% for AGIs $25k-50k, 0.2% for AGIs $75k-100k, 0.1% for AGIs $100k-200k, 0.2% for AGIs over 200k)
Total itemized deductions: $26,951 (26% of AGI, reported on 37.0% of returns)
Here:
$26,951
State:
$34,004
Here:
26.2% of AGI
State:
22.7% of AGI
(% of AGI for various income ranges: 11.5% for AGIs below $25k, 12.9% for AGIs $25k-50k, 17.1% for AGIs $50k-75k, 19.1% for AGIs $75k-100k, 20.8% for AGIs $100k-200k, 18.0% for AGIs over 200k)
Charity contributions: $3,744 (reported on 30.2% of returns)
Here:
$3,744
State:
$4,659
(% of AGI for various income ranges: 0.7% for AGIs below $25k, 1.0% for AGIs $25k-50k, 1.6% for AGIs $50k-75k, 1.9% for AGIs $75k-100k, 2.2% for AGIs $100k-200k, 3.4% for AGIs over 200k)
Taxes paid: $9,099 (reported on 36.9% of returns)
92026:
$9,099
State:
$14,448
(% of AGI for various income ranges: 2.1% for AGIs below $25k, 2.7% for AGIs $25k-50k, 4.4% for AGIs $50k-75k, 5.8% for AGIs $75k-100k, 7.7% for AGIs $100k-200k, 8.7% for AGIs over 200k)
Earned income credit: $2,179 (reported on 15.9% of returns)
Here:
$2,179
State:
$2,286
(% of AGI for various income ranges: 5.1% for AGIs below $25k, 1.1% for AGIs $25k-50k)
Percentage of individuals using paid preparers for their 2012 taxes: 59.6%
Here:
60%
State:
64%
(% for various income ranges: 58.0% for AGIs below $25k, 58.4% for AGIs $25k-50k, 59.1% for AGIs $50k-75k, 60.4% for AGIs $75k-100k, 63.9% for AGIs $100k-200k, 72.4% for AGIs over 200k)
Averages for the 2004 tax year for zip code 92026, filed in 2005:
Average Adjusted Gross Income (AGI) in 2004: $52,760 (Individual Income Tax Returns)
Here:
$52,760
State:
$58,600
Salary/wage: $46,226 (reported on 80.8% of returns)
Here:
$46,226
State:
$49,455
(% of AGI for various income ranges: 217.3% for AGIs below $10k, 73.6% for AGIs $10k-25k, 77.6% for AGIs $25k-50k, 76.1% for AGIs $50k-75k, 76.8% for AGIs $75k-100k, 61.6% for AGIs over 100k)
Taxable interest for individuals: $1,777 (reported on 50.3% of returns)
This zip code:
$1,777
California:
$2,365
(% of AGI for various income ranges: 16.3% for AGIs below $10k, 2.6% for AGIs $10k-25k, 1.7% for AGIs $25k-50k, 1.5% for AGIs $50k-75k, 1.5% for AGIs $75k-100k, 1.5% for AGIs over 100k)
Taxable dividends: $2,835 (reported on 24.5% of returns)
Here:
$2,835
State:
$4,746
(% of AGI for various income ranges: 13.6% for AGIs below $10k, 2.0% for AGIs $10k-25k, 1.4% for AGIs $25k-50k, 1.2% for AGIs $50k-75k, 1.0% for AGIs $75k-100k, 1.2% for AGIs over 100k)
Net capital gain/loss: +$12,064 (reported on 21.9% of returns)
Here:
+$12,064
State:
+$23,418
(% of AGI for various income ranges: -1.9% for AGIs below $10k, -0.1% for AGIs $10k-25k, 0.5% for AGIs $25k-50k, 1.1% for AGIs $50k-75k, 1.5% for AGIs $75k-100k, 10.7% for AGIs over 100k)
Profit/loss from business: +$14,987 (reported on 16.6% of returns)
Here:
+$14,987
State:
+$16,826
(% of AGI for various income ranges: 6.7% for AGIs below $10k, 7.7% for AGIs $10k-25k, 5.3% for AGIs $25k-50k, 4.6% for AGIs $50k-75k, 4.9% for AGIs $75k-100k, 3.9% for AGIs over 100k)
IRA payment deduction: $3,333 (reported on 2.9% of returns)
92026:
$3,333
California:
$3,192
(% of AGI for various income ranges: 0.9% for AGIs below $10k, 0.2% for AGIs $10k-25k, 0.2% for AGIs $25k-50k, 0.2% for AGIs $50k-75k, 0.2% for AGIs $75k-100k, 0.1% for AGIs over 100k)
Self-employed pension: $12,876 (reported on 1.1% of returns)
Here:
$12,876
California:
$17,688
(% of AGI for various income ranges: 0.1% for AGIs $10k-25k, 0.2% for AGIs $25k-50k, 0.2% for AGIs $50k-75k, 0.4% for AGIs $75k-100k, 0.3% for AGIs over 100k)
Total itemized deductions: $25,645 (29% of AGI, reported on 43.1% of returns)
Here:
$25,645
State:
$28,113
Here:
28.6% of AGI
State:
25.3% of AGI
(% of AGI for various income ranges: 75.0% for AGIs below $10k, 14.3% for AGIs $10k-25k, 18.3% for AGIs $25k-50k, 22.7% for AGIs $50k-75k, 24.7% for AGIs $75k-100k, 20.7% for AGIs over 100k)
Charity contributions deductions: $3,176 (3% of AGI, reported on 37.3% of returns)
Here:
$3,176
State:
$3,923
Here:
3.3% of AGI
State:
3.3% of AGI
(% of AGI for various income ranges: 2.6% for AGIs below $10k, 1.1% for AGIs $10k-25k, 1.6% for AGIs $25k-50k, 2.2% for AGIs $50k-75k, 2.6% for AGIs $75k-100k, 2.6% for AGIs over 100k)
Total tax: $7,765 (reported on 77.4% of returns)
92026:
$7,765
State:
$10,761
(% of AGI for various income ranges: 8.9% for AGIs below $10k, 4.4% for AGIs $10k-25k, 6.5% for AGIs $25k-50k, 8.4% for AGIs $50k-75k, 9.5% for AGIs $75k-100k, 16.6% for AGIs over 100k)
Earned income credit: $1,631 (reported on 11.6% of returns)
Here:
$1,631
State:
$1,763
Percentage of individuals using paid preparers for their 2004 taxes: 63.8%
Here:
64%
State:
66%
(% for various income ranges: 54.4% for AGIs below $10k, 64.0% for AGIs $10k-25k, 64.0% for AGIs $25k-50k, 65.6% for AGIs $50k-75k, 67.4% for AGIs $75k-100k, 69.6% for AGIs over 100k)
Likely homosexual households (counted as self-reported same-sex unmarried-partner households)
Lesbian couples: 0.1% of all households
Gay men: 0.0% of all households
Household received Food Stamps/SNAP in the past 12 months: 1,294 Household did not receive Food Stamps/SNAP in the past 12 months: 17,800
Women who had a birth in the past 12 months: 682 (543 now married, 137 unmarried) Women who did not have a birth in the past 12 months: 11,052 (5,002 now married, 6,024 unmarried)
Housing units in zip code 92026 with a mortgage: 8,452 (674 second mortgage, 14 home equity loan, 517 both second mortgage and home equity loan) Houses without a mortgage: 42
Median monthly owner costs for units with a mortgage: $2,722 Median monthly owner costs for units without a mortgage: $737
Residents with income below the poverty level in 2022:
This zip code:
11.6%
Whole state:
12.2%
Residents with income below 50% of the poverty level in 2022:
This zip code:
4.0%
Whole state:
6.2%
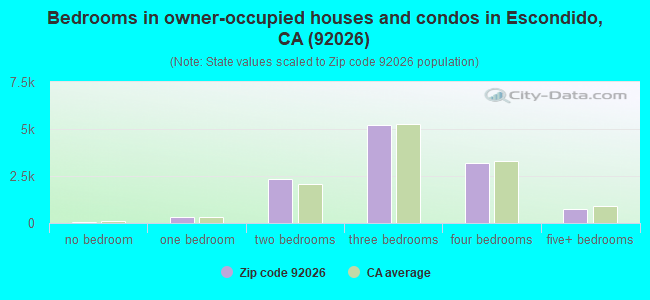
Median number of rooms in houses and condos:
Here:
5.8
State:
6.0
Median number of rooms in apartments:
Here:
4.4
State:
3.9
Notable locations in this zip code not listed on our city pages
Notable locations in zip code 92026: Old Castle Ranch (A), Escondido Recreational Vehicle Park (B), Escondido Country Club (C), Lawrence Welk Resort Golf Course (D), Deer Park Vineyard (E), Circle R Golf Resort (F), All Seasons Recreational Vehicle Park and Campground (G), Circle R Ranch (H), The Meadows Country Club (I), Golden Circle Valley Country Club (J), Lawrence Welk Theater (K), California Department of Forestry and Fire Protection Station 12 Escondido (L), California Department of Forestry and Fire Protection Station 13 - Deer Springs Station 3 (M), Escondido Fire Department Station 3 Escondido Hills (N), California Department of Forestry and Fire Protection Station 11 - Deer Springs Station 1 (O), California Department of Forestry and Fire Protection Station 15 Miller (P). Display/hide their locations on the map
Churches in zip code 92026 include: Apostolic Temple (A), Broadway Baptist Church (B), Christian Reformed Church (C), First Congregational Church of Escondido (D), Fundamental Baptist Church (E), Gloria Dei Lutheran Church (F), Kingdom Hall of Jehovahs Witnesses (G). Display/hide their locations on the map
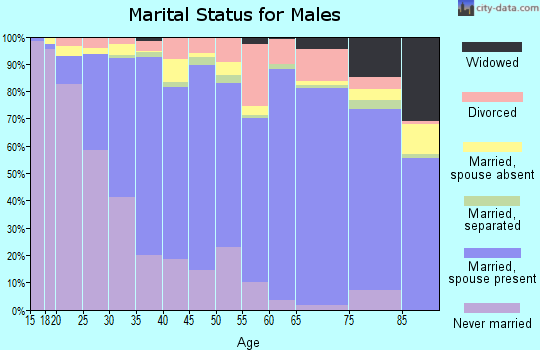
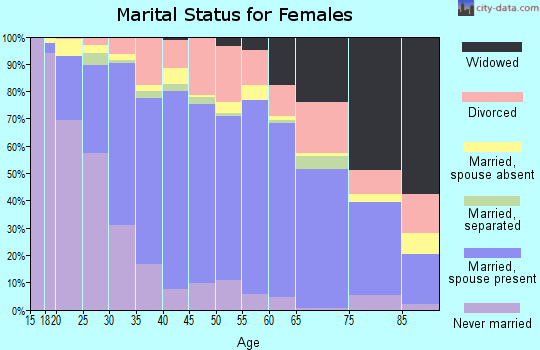
7,363 married couples with children.
2,179 single-parent households (717 men, 1,462 women).
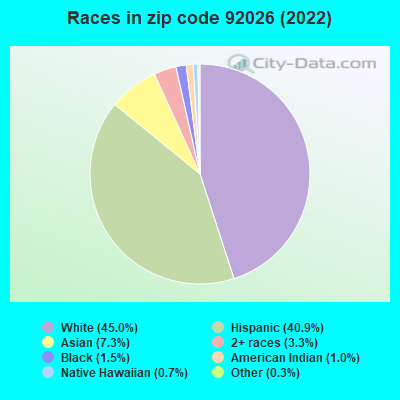
67.3% of residents of 92026 zip code speak English at home.
25.6% of residents speak Spanish at home (59% very well, 14% well, 17% not well, 10% not at all).
1.6% of residents speak other Indo-European language at home (76% very well, 15% well, 9% not well).
4.9% of residents speak Asian or Pacific Island language at home (51% very well, 29% well, 15% not well, 5% not at all).
0.5% of residents speak other language at home (59% very well, 41% well).
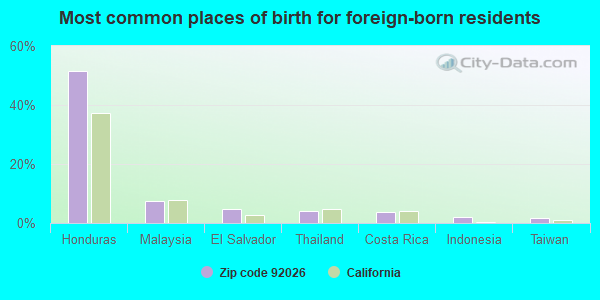
Foreign born population: 12,062 (22.9%) (54.6% of them are naturalized citizens)
This zip code:
22.9%
Whole state:
26.7%
51%Honduras
7%Malaysia
5%El Salvador
4%Thailand
4%Costa Rica
2%Indonesia
2%Taiwan
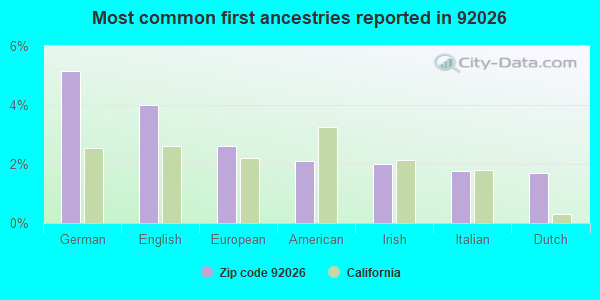
5%German
4%English
3%European
2%American
2%Irish
2%Italian
2%Dutch
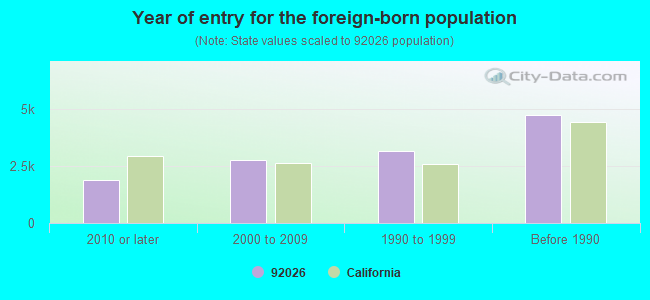
Year of entry for the foreign-born population
1,8892010 or later
2,7902000 to 2009
3,1681990 to 1999
4,755Before 1990
Major facilities with environmental interests located in this zip code:
HIDDEN MEADOWS (HOMES) (HIDDEN MEADOWS ROAD AT MTN in ESCONDIDO, CA)
ENFORCEMENT/COMPLIANCE ACTIVITY (Integrated Compliance Information System) - ICIS-09-2003-0083, FORMAL ENFORCEMENT ACTION (Integrated Compliance Information System) - ICIS-09-2003-0083, FORMAL ENFORCEMENT ACTION National Pollutant Discharge Elimination System NON-MAJOR (Tracking pollutant discharge elimination systems) - permit Business SIC classification: GENERAL CONTRACTORS-SINGLE-FAMILY HOUSES
LINCOLN INTERMEDIATE (1029 N. BROADWAY in ESCONDIDO, CA)
(National Center for Education Statistics) - STATE ID-6118004 Small Quantity Generators, between 100 kg and 1000 kg of hazardous waste/month (Resource Conservation and Recovery Act (tracking hazardous waste)) - notification Organizations: ESC UNION SCHOOL DIST (CONTACT/OWNER)
, ESCONDIDO UNION ELEMENTARY (SCHOOL DISTRICT)
Alternative names: ESC USD LINCOLN ELEMENTARY SCHOOL
ESCONDIDO UNION SCH DIST (150 W LINCOLN AVE in ESCONDIDO, CA)
STATE MASTER (California - Hazardous Waste Tracking) - HAZARDOU WASTE PROGRAM Small Quantity Generators, between 100 kg and 1000 kg of hazardous waste/month (Resource Conservation and Recovery Act (tracking hazardous waste)) - notification Organizations: BOARD OF EDUCATION (CONTACT/OWNER)
GEORGE AND KROGH WELDING INC (1357 LAS VILLAS WY in ESCONDIDO, CA)
STATE MASTER (California - Hazardous Waste Tracking) - HAZARDOU WASTE PROGRAM Small Quantity Generators, between 100 kg and 1000 kg of hazardous waste/month (Resource Conservation and Recovery Act (tracking hazardous waste)) - notification Business NAICS classification: OTHER COMMERCIAL AND SERVICE INDUSTRY MACHINERY MANUFACTURING.
GLIDDEN CO DBA ICI PAINTS (735 N ESCONDIDO in ESCONDIDO, CA)
STATE MASTER (California - Hazardous Waste Tracking) - HAZARDOU WASTE PROGRAM Small Quantity Generators, between 100 kg and 1000 kg of hazardous waste/month (Resource Conservation and Recovery Act (tracking hazardous waste)) Organizations: CHARLES P GOULD TRUSTEE (CONTACT/OWNER)
J R STANLEY COMPANY (28957 MOUNTAIN MEADOW RD in ESCONDIDO, CA)
STATE MASTER (California - Hazardous Waste Tracking) - HAZARDOU WASTE PROGRAM TRANSPORTER (Resource Conservation and Recovery Act (tracking hazardous waste)) - notification Organizations: ROBERT AND JACQUELINE STANLEY (CONTACT/OWNER)
EL NORTE FAMILY MEDICAL GROUP (306 W EL NORTE PKWY STE S in ESCONDIDO, CA)
STATE MASTER (California - Hazardous Waste Tracking) - HAZARDOU WASTE PROGRAM Small Quantity Generators, between 100 kg and 1000 kg of hazardous waste/month (Resource Conservation and Recovery Act (tracking hazardous waste)) - notification Business NAICS classification: OFFICES OF PHYSICIANS, MENTAL HEALTH SPECIALISTS. Organizations: EL NORTE FAMILY MEDICAL GROUP INC (CONTACT/OWNER)
JIFFY LUBE (314 W EL NORTE PKWY in ESCONDIDO, CA)
Small Quantity Generators, between 100 kg and 1000 kg of hazardous waste/month (Resource Conservation and Recovery Act (tracking hazardous waste)) STATE MASTER (California - Used Oil Recycling System ) - USED OIL RECYCLING, USED OIL PROGRAM Alternative names: JIFFY LUBE #415
ESCONDIDO HIGH (1535 N. BROADWAY in ESCONDIDO, CA)
(National Center for Education Statistics) - STATE ID-3732062 Organizations: ESCONDIDO UNION HIGH (SCHOOL DISTRICT)
GRANT MIDDLE (939 E. MISSION AVE. in ESCONDIDO, CA)
(National Center for Education Statistics) - STATE ID-6038210 Organizations: ESCONDIDO UNION ELEMENTARY (SCHOOL DISTRICT)
LINCOLN PRIMARY (1029 N. BROADWAY in ESCONDIDO, CA)
(National Center for Education Statistics) - STATE ID-6038236 Organizations: ESCONDIDO UNION ELEMENTARY (SCHOOL DISTRICT)
NORTH BROADWAY ELEMENTARY (2301 N. BROADWAY in ESCONDIDO, CA)
(National Center for Education Statistics) - STATE ID-6102750 Organizations: ESCONDIDO UNION ELEMENTARY (SCHOOL DISTRICT)
ESCONDIDO ONE HOUR PHOTO (306 W EL NORTE PARKWAY in ESCONDIDO, CA)
Small Quantity Generators, between 100 kg and 1000 kg of hazardous waste/month (Resource Conservation and Recovery Act (tracking hazardous waste)) Organizations: GARBERICK THOMAS (CONTACT/OWNER)
Housing units lacking complete plumbing facilities: 0.9% Housing units lacking complete kitchen facilities: 1.2%
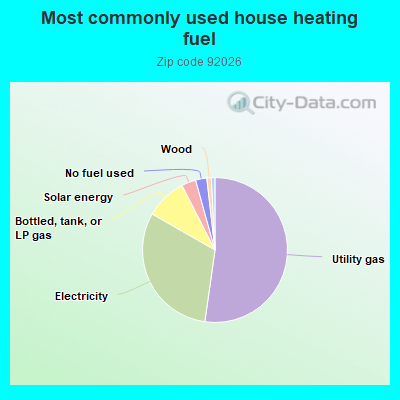
52.2%Utility gas
31.0%Electricity
9.2%Bottled, tank, or LP gas
3.2%Solar energy
2.5%No fuel used
1.0%Wood
Population in 1990: 37,176. Population change in the 1990s: +6,250 (+16.8%).
Place of birth for U.S.-born residents:
This state: 27,688
Northeast: 2,919
Midwest: 4,433
South: 2,858
West: 1,719
47% of the 92026 zip code residents lived in the same house 5 years ago. Out of people who lived in different houses, 75% lived in this county. Out of people who lived in different counties, 50% lived in California.
89% of the 92026 zip code residents lived in the same house 1 year ago. Out of people who lived in different houses, 69% moved from this county. Out of people who lived in different houses, 13% moved from different county within same state. Out of people who lived in different houses, 14% moved from different state. Out of people who lived in different houses, 3% moved from abroad.
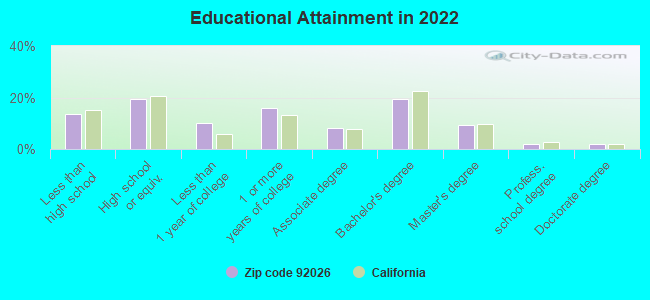
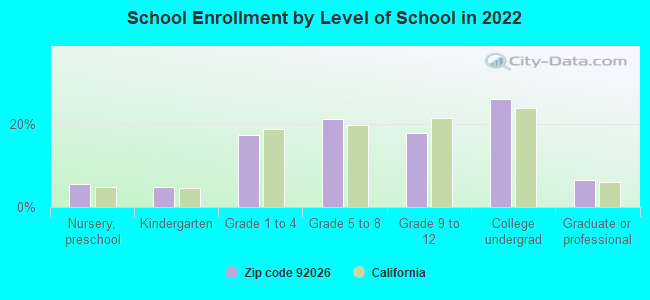
Private vs. public school enrollment:
Students in private schools in grades 1 to 8 (elementary and middle school): 574
Here:
12.8%
California:
10.5%
Students in private schools in grades 9 to 12 (high school): 68
Here:
3.3%
California:
8.5%
Students in private undergraduate colleges: 517
Here:
17.1%
California:
15.9%
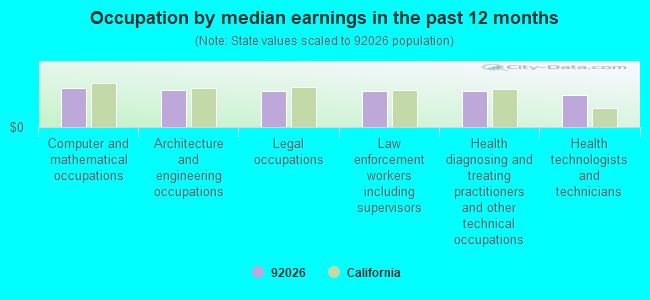
Occupation by median earnings in the past 12 months ($)
113,173Computer and mathematical occupations
107,121Architecture and engineering occupations
105,489Legal occupations
105,363Law enforcement workers including supervisors
103,672Health diagnosing and treating practitioners and other technical occupations
91,626Health technologists and technicians
Companies with federal contracts located in this zip code (ESCONDIDO, CA):
PALOMAR GRADING & PAVING INC (2150 N CENTRE CITY PKWY; small business) : $30,428,294 in 182 contractsfrom 1999 to 2006
Contracts for Maintenance, Repair or Alteration of Real Property -- Miscellaneous Buildings, Maintenance, Repair or Alteration of Real Property -- Highways, Roads, Streets, Bridges, and Railways (includes resurfacing), Maintenance, Repair or Alteration of Real Property -- Maintenance Buildings, Maintenance, Repair or Alteration of Real Property -- Other Administrative Facilities and Service Buildings, and moreby Air Force, Navy, Army Signed by year:2000: $4,594,036; 2001: $1,873,782; 2002: $6,927,470; 2003: $11,351,605; 2004: $2,276,366; 2005: $2,429,988; 2006: $236,914.
Biggest contracts:
$3,400,000 with Air Force for Maintenance, Repair or Alteration of Real Property -- Miscellaneous Buildings. Signed on 2003-07-23. Completion date: 2004-07-23.
$3,300,000, same as above.Signed on 2002-09-19. Completion date: 2002-09-29.
$1,500,000, same as above.Signed on 2003-07-23. Completion date: 2004-07-23.
$980,000, same as above.Signed on 2002-11-14. Completion date: 2003-07-14.
TIERRA DATA SYSTEMS (10110WEST LILAC ROAD; small business) : $4,780,879 in 122 contractsfrom 2000 to 2006
Contracts for Architect - Engineer Services (including landscaping, interior layout, and designing), Other Special Studies and Analyses, Natural Resource Studies, Other Environmental Services, Studies, and Analytical Support, and moreby Navy, Natural Resources Conservation Service, Federal Technology Service Signed by year:2000: $689,907; 2001: $1,103,038; 2002: $501,757; 2003: $656,199; 2004: $633,896; 2005: $880,240; 2006: $315,842.
Biggest contracts:
$289,988 with Navy for Architect - Engineer Services (including landscaping, interior layout, and designing). Signed on 2005-09-15. Completion date: 2006-09-17.
$287,058 with Navy for Other Special Studies and Analyses. Signed on 2001-10-09. Completion date: 2009-09-30.
$250,245 with Navy for Natural Resource Studies. Signed on 2003-10-01. Completion date: 2004-08-27.
$178,950 with Navy for Other Special Studies and Analyses. Signed on 2002-01-28. Completion date: 2009-09-30.
ROMERO GENERAL CONSTRUCTION CO (2150 N CENTRE CITY PKWY ST; small business) : $1,342,566 in 10 contractsfrom 2005 to 2006
Contracts for Maintenance, Repair or Alteration of Real Property -- Highways, Roads, Streets, Bridges, and Railways (includes resurfacing), Construction of Structures and Facilities -- Highways, Roads, Streets, Bridges, and Railways (includes resurfacing), Purchase of Structures and Facilities -- Parking Facilities Conservation, Maintenance, Repair or Alteration of Real Property -- Miscellaneous Buildings, and moreby Air Force, Navy, Army Signed by year:2000: $0; 2001: $0; 2002: $0; 2003: $0; 2004: $0; 2005: $353,023; 2006: $989,543.
Biggest contracts:
$699,982 with Air Force for Maintenance, Repair or Alteration of Real Property -- Highways, Roads, Streets, Bridges, and Railways (includes resurfacing). Taking place in ID. Signed on 2006-06-28. Completion date: 2006-09-29.
$239,634 with Navy for Construction of Structures and Facilities -- Highways, Roads, Streets, Bridges, and Railways (includes resurfacing). Signed on 2005-09-21. Completion date: 2006-01-04.
$101,323 with Air Force for Maintenance, Repair or Alteration of Real Property -- Highways, Roads, Streets, Bridges, and Railways (includes resurfacing). Taking place in ID. Signed on 2006-04-24. Completion date: 2006-07-31.
$99,726 with Army for Purchase of Structures and Facilities -- Parking Facilities Conservation. Signed on 2006-02-06. Completion date: 2005-09-30.
HARVEY BERLINGER (443 WEST EL NORTE PARKWAY; small business) : $276,404 in 7 contractsfrom 1999 to 2003
Contracts for Pharmacology Services, Dentistry Services, Other Medical Services by Navy Signed by year:2000: $66,560; 2001: $70,720; 2002: $49,808; 2003: $26,676; 2004: $0; 2005: $0; 2006: $0.
Biggest contracts:
$70,720 with Navy for Pharmacology Services. Signed on 2001-10-01. Completion date: 2001-09-30.
$66,560 with Navy for Dentistry Services. Signed on 2000-10-01. Completion date: 2001-09-30.
$62,640 with Navy for Other Medical Services. Signed on 1999-11-29. Completion date: 2000-09-30.
$49,536 with Navy for Pharmacology Services. Signed on 2002-10-01. Completion date: 2003-05-31.
ANDREW P THRASH (1371 GILMORE PLACE; small business) : $263,490 in 7 contractsfrom 1999 to 2003
Contracts for Pharmacology Services, Other Medical Services, Dentistry Services by Navy Signed by year:2000: $64,480; 2001: $66,312; 2002: $67,458; 2003: $512; 2004: $0; 2005: $0; 2006: $0.
Biggest contracts:
$66,560 with Navy for Pharmacology Services. Signed on 2001-10-01. Completion date: 2001-09-30.
$64,728 with Navy for Other Medical Services. Signed on 1999-11-15. Completion date: 2000-09-30.
$64,480 with Navy for Dentistry Services. Signed on 2000-10-01. Completion date: 2001-09-30.
$44,032 with Navy for Pharmacology Services. Signed on 2002-10-01. Completion date: 2001-09-30.
TANGENT ENTERPRISES (26208 JESMOND DENE RD; small business) : $207,653 in 7 contractsfrom 2003 to 2005
Contracts for Maintenance, Repair and Rebuilding of Equipment -- Service and Trade Equipment by Navy Signed by year:2000: $0; 2001: $0; 2002: $0; 2003: $61,526; 2004: $63,446; 2005: $82,681; 2006: $0.
Biggest contracts:
$63,446 with Navy for Maintenance, Repair and Rebuilding of Equipment -- Service and Trade Equipment. Signed on 2004-04-23. Completion date: 2005-04-30.
$61,526, same as above.Signed on 2003-06-13. Completion date: 2004-04-30.
$43,941, same as above.Signed on 2005-05-03. Completion date: 2006-04-30.
$38,740, same as above.Signed on 2005-09-10. Completion date: 2005-09-30.
UNIVERSAL CONTAINER INC (32549 MESA LILAC RD; small business) : $86,056 in 4 contractsfrom 2000 to 2005
$46,636 with Navy for Specialized Shipping and Storage Containers. Signed on 2001-03-16. Completion date: 2001-04-23.
$29,491, same as above.Signed on 2000-09-08. Completion date: 2000-10-27.
$5,930, same as above.Signed on 2005-08-19. Completion date: 2005-09-06.
$3,999 with Navy for Plastics Fabricated Materials. Signed on 2005-01-10. Completion date: 2005-01-31.
J&M CONSULTING (1498 VIA SALERNO; small business)
$26,215 with Navy for Facilities Operations Support Services. Signed on 1999-10-01. Completion date: 2000-01-31.
2004 - 2018 National Fire Incident Reporting System (NFIRS) incidents
According to the data from the years 2004 - 2018 the average number of fires per year is 80. The highest number of reported fire incidents - 111 took place in 2007, and the least - 9 in 2004. The data has an increasing trend.
When looking into fire subcategories, the most reports belonged to: Outside Fires (38.9%), and Mobile Property/Vehicle Fires (28.6%).
Fire incident types reported to NFIRS in Zip Code 92026


 Nearest zip codes: 92069, 92084, 92003, 92078, 92025, 92082.


 According to the data from the years 2004 - 2018 the average number of fires per year is 80. The highest number of reported fire incidents - 111 took place in 2007, and the least - 9 in 2004. The data has an increasing trend.
 When looking into fire subcategories, the most reports belonged to: Outside Fires (38.9%), and Mobile Property/Vehicle Fires (28.6%).