Escondido, California Submit your own pictures of this city and show them to the world
OSM Map
General Map
Google Map
MSN Map
OSM Map
General Map
Google Map
MSN Map
OSM Map
General Map
Google Map
MSN Map
OSM Map
General Map
Google Map
MSN Map
Please wait while loading the map...
Population in 2022: 150,270 (100% urban, 0% rural). Population change since 2000: +12.5%Males: 75,524 Females: 74,746
March 2022 cost of living index in Escondido: 124.4 (high, U.S. average is 100) Percentage of residents living in poverty in 2022: 11.8%for White Non-Hispanic residents , 25.8% for Black residents , 13.5% for Hispanic or Latino residents , 2.9% for American Indian residents , 5.6% for Native Hawaiian and other Pacific Islander residents , 11.6% for other race residents , 15.3% for two or more races residents )
Profiles of local businesses
Business Search - 14 Million verified businesses
Data:
Median household income ($)
Median household income (% change since 2000)
Household income diversity
Ratio of average income to average house value (%)
Ratio of average income to average rent
Median household income ($) - White
Median household income ($) - Black or African American
Median household income ($) - Asian
Median household income ($) - Hispanic or Latino
Median household income ($) - American Indian and Alaska Native
Median household income ($) - Multirace
Median household income ($) - Other Race
Median household income for houses/condos with a mortgage ($)
Median household income for apartments without a mortgage ($)
Races - White alone (%)
Races - White alone (% change since 2000)
Races - Black alone (%)
Races - Black alone (% change since 2000)
Races - American Indian alone (%)
Races - American Indian alone (% change since 2000)
Races - Asian alone (%)
Races - Asian alone (% change since 2000)
Races - Hispanic (%)
Races - Hispanic (% change since 2000)
Races - Native Hawaiian and Other Pacific Islander alone (%)
Races - Native Hawaiian and Other Pacific Islander alone (% change since 2000)
Races - Two or more races (%)
Races - Two or more races (% change since 2000)
Races - Other race alone (%)
Races - Other race alone (% change since 2000)
Racial diversity
Unemployment (%)
Unemployment (% change since 2000)
Unemployment (%) - White
Unemployment (%) - Black or African American
Unemployment (%) - Asian
Unemployment (%) - Hispanic or Latino
Unemployment (%) - American Indian and Alaska Native
Unemployment (%) - Multirace
Unemployment (%) - Other Race
Population density (people per square mile)
Population - Males (%)
Population - Females (%)
Population - Males (%) - White
Population - Males (%) - Black or African American
Population - Males (%) - Asian
Population - Males (%) - Hispanic or Latino
Population - Males (%) - American Indian and Alaska Native
Population - Males (%) - Multirace
Population - Males (%) - Other Race
Population - Females (%) - White
Population - Females (%) - Black or African American
Population - Females (%) - Asian
Population - Females (%) - Hispanic or Latino
Population - Females (%) - American Indian and Alaska Native
Population - Females (%) - Multirace
Population - Females (%) - Other Race
Coronavirus confirmed cases (Apr 27, 2024)
Deaths caused by coronavirus (Apr 27, 2024)
Coronavirus confirmed cases (per 100k population) (Apr 27, 2024)
Deaths caused by coronavirus (per 100k population) (Apr 27, 2024)
Daily increase in number of cases (Apr 27, 2024)
Weekly increase in number of cases (Apr 27, 2024)
Cases doubled (in days) (Apr 27, 2024)
Hospitalized patients (Apr 18, 2022)
Negative test results (Apr 18, 2022)
Total test results (Apr 18, 2022)
COVID Vaccine doses distributed (per 100k population) (Sep 19, 2023)
COVID Vaccine doses administered (per 100k population) (Sep 19, 2023)
COVID Vaccine doses distributed (Sep 19, 2023)
COVID Vaccine doses administered (Sep 19, 2023)
Likely homosexual households (%)
Likely homosexual households (% change since 2000)
Likely homosexual households - Lesbian couples (%)
Likely homosexual households - Lesbian couples (% change since 2000)
Likely homosexual households - Gay men (%)
Likely homosexual households - Gay men (% change since 2000)
Cost of living index
Median gross rent ($)
Median contract rent ($)
Median monthly housing costs ($)
Median house or condo value ($)
Median house or condo value ($ change since 2000)
Mean house or condo value by units in structure - 1, detached ($)
Mean house or condo value by units in structure - 1, attached ($)
Mean house or condo value by units in structure - 2 ($)
Mean house or condo value by units in structure by units in structure - 3 or 4 ($)
Mean house or condo value by units in structure - 5 or more ($)
Mean house or condo value by units in structure - Boat, RV, van, etc. ($)
Mean house or condo value by units in structure - Mobile home ($)
Median house or condo value ($) - White
Median house or condo value ($) - Black or African American
Median house or condo value ($) - Asian
Median house or condo value ($) - Hispanic or Latino
Median house or condo value ($) - American Indian and Alaska Native
Median house or condo value ($) - Multirace
Median house or condo value ($) - Other Race
Median resident age
Resident age diversity
Median resident age - Males
Median resident age - Females
Median resident age - White
Median resident age - Black or African American
Median resident age - Asian
Median resident age - Hispanic or Latino
Median resident age - American Indian and Alaska Native
Median resident age - Multirace
Median resident age - Other Race
Median resident age - Males - White
Median resident age - Males - Black or African American
Median resident age - Males - Asian
Median resident age - Males - Hispanic or Latino
Median resident age - Males - American Indian and Alaska Native
Median resident age - Males - Multirace
Median resident age - Males - Other Race
Median resident age - Females - White
Median resident age - Females - Black or African American
Median resident age - Females - Asian
Median resident age - Females - Hispanic or Latino
Median resident age - Females - American Indian and Alaska Native
Median resident age - Females - Multirace
Median resident age - Females - Other Race
Commute - mean travel time to work (minutes)
Travel time to work - Less than 5 minutes (%)
Travel time to work - Less than 5 minutes (% change since 2000)
Travel time to work - 5 to 9 minutes (%)
Travel time to work - 5 to 9 minutes (% change since 2000)
Travel time to work - 10 to 19 minutes (%)
Travel time to work - 10 to 19 minutes (% change since 2000)
Travel time to work - 20 to 29 minutes (%)
Travel time to work - 20 to 29 minutes (% change since 2000)
Travel time to work - 30 to 39 minutes (%)
Travel time to work - 30 to 39 minutes (% change since 2000)
Travel time to work - 40 to 59 minutes (%)
Travel time to work - 40 to 59 minutes (% change since 2000)
Travel time to work - 60 to 89 minutes (%)
Travel time to work - 60 to 89 minutes (% change since 2000)
Travel time to work - 90 or more minutes (%)
Travel time to work - 90 or more minutes (% change since 2000)
Marital status - Never married (%)
Marital status - Now married (%)
Marital status - Separated (%)
Marital status - Widowed (%)
Marital status - Divorced (%)
Median family income ($)
Median family income (% change since 2000)
Median non-family income ($)
Median non-family income (% change since 2000)
Median per capita income ($)
Median per capita income (% change since 2000)
Median family income ($) - White
Median family income ($) - Black or African American
Median family income ($) - Asian
Median family income ($) - Hispanic or Latino
Median family income ($) - American Indian and Alaska Native
Median family income ($) - Multirace
Median family income ($) - Other Race
Median year house/condo built
Median year apartment built
Year house built - Built 2005 or later (%)
Year house built - Built 2000 to 2004 (%)
Year house built - Built 1990 to 1999 (%)
Year house built - Built 1980 to 1989 (%)
Year house built - Built 1970 to 1979 (%)
Year house built - Built 1960 to 1969 (%)
Year house built - Built 1950 to 1959 (%)
Year house built - Built 1940 to 1949 (%)
Year house built - Built 1939 or earlier (%)
Average household size
Household density (households per square mile)
Average household size - White
Average household size - Black or African American
Average household size - Asian
Average household size - Hispanic or Latino
Average household size - American Indian and Alaska Native
Average household size - Multirace
Average household size - Other Race
Occupied housing units (%)
Vacant housing units (%)
Owner occupied housing units (%)
Renter occupied housing units (%)
Vacancy status - For rent (%)
Vacancy status - For sale only (%)
Vacancy status - Rented or sold, not occupied (%)
Vacancy status - For seasonal, recreational, or occasional use (%)
Vacancy status - For migrant workers (%)
Vacancy status - Other vacant (%)
Residents with income below the poverty level (%)
Residents with income below 50% of the poverty level (%)
Children below poverty level (%)
Poor families by family type - Married-couple family (%)
Poor families by family type - Male, no wife present (%)
Poor families by family type - Female, no husband present (%)
Poverty status for native-born residents (%)
Poverty status for foreign-born residents (%)
Poverty among high school graduates not in families (%)
Poverty among people who did not graduate high school not in families (%)
Residents with income below the poverty level (%) - White
Residents with income below the poverty level (%) - Black or African American
Residents with income below the poverty level (%) - Asian
Residents with income below the poverty level (%) - Hispanic or Latino
Residents with income below the poverty level (%) - American Indian and Alaska Native
Residents with income below the poverty level (%) - Multirace
Residents with income below the poverty level (%) - Other Race
Air pollution - Air Quality Index (AQI)
Air pollution - CO
Air pollution - NO2
Air pollution - SO2
Air pollution - Ozone
Air pollution - PM10
Air pollution - PM25
Air pollution - Pb
Crime - Murders per 100,000 population
Crime - Rapes per 100,000 population
Crime - Robberies per 100,000 population
Crime - Assaults per 100,000 population
Crime - Burglaries per 100,000 population
Crime - Thefts per 100,000 population
Crime - Auto thefts per 100,000 population
Crime - Arson per 100,000 population
Crime - City-data.com crime index
Crime - Violent crime index
Crime - Property crime index
Crime - Murders per 100,000 population (5 year average)
Crime - Rapes per 100,000 population (5 year average)
Crime - Robberies per 100,000 population (5 year average)
Crime - Assaults per 100,000 population (5 year average)
Crime - Burglaries per 100,000 population (5 year average)
Crime - Thefts per 100,000 population (5 year average)
Crime - Auto thefts per 100,000 population (5 year average)
Crime - Arson per 100,000 population (5 year average)
Crime - City-data.com crime index (5 year average)
Crime - Violent crime index (5 year average)
Crime - Property crime index (5 year average)
1996 Presidential Elections Results (%) - Democratic Party (Clinton)
1996 Presidential Elections Results (%) - Republican Party (Dole)
1996 Presidential Elections Results (%) - Other
2000 Presidential Elections Results (%) - Democratic Party (Gore)
2000 Presidential Elections Results (%) - Republican Party (Bush)
2000 Presidential Elections Results (%) - Other
2004 Presidential Elections Results (%) - Democratic Party (Kerry)
2004 Presidential Elections Results (%) - Republican Party (Bush)
2004 Presidential Elections Results (%) - Other
2008 Presidential Elections Results (%) - Democratic Party (Obama)
2008 Presidential Elections Results (%) - Republican Party (McCain)
2008 Presidential Elections Results (%) - Other
2012 Presidential Elections Results (%) - Democratic Party (Obama)
2012 Presidential Elections Results (%) - Republican Party (Romney)
2012 Presidential Elections Results (%) - Other
2016 Presidential Elections Results (%) - Democratic Party (Clinton)
2016 Presidential Elections Results (%) - Republican Party (Trump)
2016 Presidential Elections Results (%) - Other
2020 Presidential Elections Results (%) - Democratic Party (Biden)
2020 Presidential Elections Results (%) - Republican Party (Trump)
2020 Presidential Elections Results (%) - Other
Ancestries Reported - Arab (%)
Ancestries Reported - Czech (%)
Ancestries Reported - Danish (%)
Ancestries Reported - Dutch (%)
Ancestries Reported - English (%)
Ancestries Reported - French (%)
Ancestries Reported - French Canadian (%)
Ancestries Reported - German (%)
Ancestries Reported - Greek (%)
Ancestries Reported - Hungarian (%)
Ancestries Reported - Irish (%)
Ancestries Reported - Italian (%)
Ancestries Reported - Lithuanian (%)
Ancestries Reported - Norwegian (%)
Ancestries Reported - Polish (%)
Ancestries Reported - Portuguese (%)
Ancestries Reported - Russian (%)
Ancestries Reported - Scotch-Irish (%)
Ancestries Reported - Scottish (%)
Ancestries Reported - Slovak (%)
Ancestries Reported - Subsaharan African (%)
Ancestries Reported - Swedish (%)
Ancestries Reported - Swiss (%)
Ancestries Reported - Ukrainian (%)
Ancestries Reported - United States (%)
Ancestries Reported - Welsh (%)
Ancestries Reported - West Indian (%)
Ancestries Reported - Other (%)
Educational Attainment - No schooling completed (%)
Educational Attainment - Less than high school (%)
Educational Attainment - High school or equivalent (%)
Educational Attainment - Less than 1 year of college (%)
Educational Attainment - 1 or more years of college (%)
Educational Attainment - Associate degree (%)
Educational Attainment - Bachelor's degree (%)
Educational Attainment - Master's degree (%)
Educational Attainment - Professional school degree (%)
Educational Attainment - Doctorate degree (%)
School Enrollment - Nursery, preschool (%)
School Enrollment - Kindergarten (%)
School Enrollment - Grade 1 to 4 (%)
School Enrollment - Grade 5 to 8 (%)
School Enrollment - Grade 9 to 12 (%)
School Enrollment - College undergrad (%)
School Enrollment - Graduate or professional (%)
School Enrollment - Not enrolled in school (%)
School enrollment - Public schools (%)
School enrollment - Private schools (%)
School enrollment - Not enrolled (%)
Median number of rooms in houses and condos
Median number of rooms in apartments
Housing units lacking complete plumbing facilities (%)
Housing units lacking complete kitchen facilities (%)
Density of houses
Urban houses (%)
Rural houses (%)
Households with people 60 years and over (%)
Households with people 65 years and over (%)
Households with people 75 years and over (%)
Households with one or more nonrelatives (%)
Households with no nonrelatives (%)
Population in households (%)
Family households (%)
Nonfamily households (%)
Population in families (%)
Family households with own children (%)
Median number of bedrooms in owner occupied houses
Mean number of bedrooms in owner occupied houses
Median number of bedrooms in renter occupied houses
Mean number of bedrooms in renter occupied houses
Median number of vehichles in owner occupied houses
Mean number of vehichles in owner occupied houses
Median number of vehichles in renter occupied houses
Mean number of vehichles in renter occupied houses
Mortgage status - with mortgage (%)
Mortgage status - with second mortgage (%)
Mortgage status - with home equity loan (%)
Mortgage status - with both second mortgage and home equity loan (%)
Mortgage status - without a mortgage (%)
Average family size
Average family size - White
Average family size - Black or African American
Average family size - Asian
Average family size - Hispanic or Latino
Average family size - American Indian and Alaska Native
Average family size - Multirace
Average family size - Other Race
Geographical mobility - Same house 1 year ago (%)
Geographical mobility - Moved within same county (%)
Geographical mobility - Moved from different county within same state (%)
Geographical mobility - Moved from different state (%)
Geographical mobility - Moved from abroad (%)
Place of birth - Born in state of residence (%)
Place of birth - Born in other state (%)
Place of birth - Native, outside of US (%)
Place of birth - Foreign born (%)
Housing units in structures - 1, detached (%)
Housing units in structures - 1, attached (%)
Housing units in structures - 2 (%)
Housing units in structures - 3 or 4 (%)
Housing units in structures - 5 to 9 (%)
Housing units in structures - 10 to 19 (%)
Housing units in structures - 20 to 49 (%)
Housing units in structures - 50 or more (%)
Housing units in structures - Mobile home (%)
Housing units in structures - Boat, RV, van, etc. (%)
House/condo owner moved in on average (years ago)
Renter moved in on average (years ago)
Year householder moved into unit - Moved in 1999 to March 2000 (%)
Year householder moved into unit - Moved in 1995 to 1998 (%)
Year householder moved into unit - Moved in 1990 to 1994 (%)
Year householder moved into unit - Moved in 1980 to 1989 (%)
Year householder moved into unit - Moved in 1970 to 1979 (%)
Year householder moved into unit - Moved in 1969 or earlier (%)
Means of transportation to work - Drove car alone (%)
Means of transportation to work - Carpooled (%)
Means of transportation to work - Public transportation (%)
Means of transportation to work - Bus or trolley bus (%)
Means of transportation to work - Streetcar or trolley car (%)
Means of transportation to work - Subway or elevated (%)
Means of transportation to work - Railroad (%)
Means of transportation to work - Ferryboat (%)
Means of transportation to work - Taxicab (%)
Means of transportation to work - Motorcycle (%)
Means of transportation to work - Bicycle (%)
Means of transportation to work - Walked (%)
Means of transportation to work - Other means (%)
Working at home (%)
Industry diversity
Most Common Industries - Agriculture, forestry, fishing and hunting, and mining (%)
Most Common Industries - Agriculture, forestry, fishing and hunting (%)
Most Common Industries - Mining, quarrying, and oil and gas extraction (%)
Most Common Industries - Construction (%)
Most Common Industries - Manufacturing (%)
Most Common Industries - Wholesale trade (%)
Most Common Industries - Retail trade (%)
Most Common Industries - Transportation and warehousing, and utilities (%)
Most Common Industries - Transportation and warehousing (%)
Most Common Industries - Utilities (%)
Most Common Industries - Information (%)
Most Common Industries - Finance and insurance, and real estate and rental and leasing (%)
Most Common Industries - Finance and insurance (%)
Most Common Industries - Real estate and rental and leasing (%)
Most Common Industries - Professional, scientific, and management, and administrative and waste management services (%)
Most Common Industries - Professional, scientific, and technical services (%)
Most Common Industries - Management of companies and enterprises (%)
Most Common Industries - Administrative and support and waste management services (%)
Most Common Industries - Educational services, and health care and social assistance (%)
Most Common Industries - Educational services (%)
Most Common Industries - Health care and social assistance (%)
Most Common Industries - Arts, entertainment, and recreation, and accommodation and food services (%)
Most Common Industries - Arts, entertainment, and recreation (%)
Most Common Industries - Accommodation and food services (%)
Most Common Industries - Other services, except public administration (%)
Most Common Industries - Public administration (%)
Occupation diversity
Most Common Occupations - Management, business, science, and arts occupations (%)
Most Common Occupations - Management, business, and financial occupations (%)
Most Common Occupations - Management occupations (%)
Most Common Occupations - Business and financial operations occupations (%)
Most Common Occupations - Computer, engineering, and science occupations (%)
Most Common Occupations - Computer and mathematical occupations (%)
Most Common Occupations - Architecture and engineering occupations (%)
Most Common Occupations - Life, physical, and social science occupations (%)
Most Common Occupations - Education, legal, community service, arts, and media occupations (%)
Most Common Occupations - Community and social service occupations (%)
Most Common Occupations - Legal occupations (%)
Most Common Occupations - Education, training, and library occupations (%)
Most Common Occupations - Arts, design, entertainment, sports, and media occupations (%)
Most Common Occupations - Healthcare practitioners and technical occupations (%)
Most Common Occupations - Health diagnosing and treating practitioners and other technical occupations (%)
Most Common Occupations - Health technologists and technicians (%)
Most Common Occupations - Service occupations (%)
Most Common Occupations - Healthcare support occupations (%)
Most Common Occupations - Protective service occupations (%)
Most Common Occupations - Fire fighting and prevention, and other protective service workers including supervisors (%)
Most Common Occupations - Law enforcement workers including supervisors (%)
Most Common Occupations - Food preparation and serving related occupations (%)
Most Common Occupations - Building and grounds cleaning and maintenance occupations (%)
Most Common Occupations - Personal care and service occupations (%)
Most Common Occupations - Sales and office occupations (%)
Most Common Occupations - Sales and related occupations (%)
Most Common Occupations - Office and administrative support occupations (%)
Most Common Occupations - Natural resources, construction, and maintenance occupations (%)
Most Common Occupations - Farming, fishing, and forestry occupations (%)
Most Common Occupations - Construction and extraction occupations (%)
Most Common Occupations - Installation, maintenance, and repair occupations (%)
Most Common Occupations - Production, transportation, and material moving occupations (%)
Most Common Occupations - Production occupations (%)
Most Common Occupations - Transportation occupations (%)
Most Common Occupations - Material moving occupations (%)
People in Group quarters - Institutionalized population (%)
People in Group quarters - Correctional institutions (%)
People in Group quarters - Federal prisons and detention centers (%)
People in Group quarters - Halfway houses (%)
People in Group quarters - Local jails and other confinement facilities (including police lockups) (%)
People in Group quarters - Military disciplinary barracks (%)
People in Group quarters - State prisons (%)
People in Group quarters - Other types of correctional institutions (%)
People in Group quarters - Nursing homes (%)
People in Group quarters - Hospitals/wards, hospices, and schools for the handicapped (%)
People in Group quarters - Hospitals/wards and hospices for chronically ill (%)
People in Group quarters - Hospices or homes for chronically ill (%)
People in Group quarters - Military hospitals or wards for chronically ill (%)
People in Group quarters - Other hospitals or wards for chronically ill (%)
People in Group quarters - Hospitals or wards for drug/alcohol abuse (%)
People in Group quarters - Mental (Psychiatric) hospitals or wards (%)
People in Group quarters - Schools, hospitals, or wards for the mentally retarded (%)
People in Group quarters - Schools, hospitals, or wards for the physically handicapped (%)
People in Group quarters - Institutions for the deaf (%)
People in Group quarters - Institutions for the blind (%)
People in Group quarters - Orthopedic wards and institutions for the physically handicapped (%)
People in Group quarters - Wards in general hospitals for patients who have no usual home elsewhere (%)
People in Group quarters - Wards in military hospitals for patients who have no usual home elsewhere (%)
People in Group quarters - Juvenile institutions (%)
People in Group quarters - Long-term care (%)
People in Group quarters - Homes for abused, dependent, and neglected children (%)
People in Group quarters - Residential treatment centers for emotionally disturbed children (%)
People in Group quarters - Training schools for juvenile delinquents (%)
People in Group quarters - Short-term care, detention or diagnostic centers for delinquent children (%)
People in Group quarters - Type of juvenile institution unknown (%)
People in Group quarters - Noninstitutionalized population (%)
People in Group quarters - College dormitories (includes college quarters off campus) (%)
People in Group quarters - Military quarters (%)
People in Group quarters - On base (%)
People in Group quarters - Barracks, unaccompanied personnel housing (UPH), (Enlisted/Officer), ;and similar group living quarters for military personnel (%)
People in Group quarters - Transient quarters for temporary residents (%)
People in Group quarters - Military ships (%)
People in Group quarters - Group homes (%)
People in Group quarters - Homes or halfway houses for drug/alcohol abuse (%)
People in Group quarters - Homes for the mentally ill (%)
People in Group quarters - Homes for the mentally retarded (%)
People in Group quarters - Homes for the physically handicapped (%)
People in Group quarters - Other group homes (%)
People in Group quarters - Religious group quarters (%)
People in Group quarters - Dormitories (%)
People in Group quarters - Agriculture workers' dormitories on farms (%)
People in Group quarters - Job Corps and vocational training facilities (%)
People in Group quarters - Other workers' dormitories (%)
People in Group quarters - Crews of maritime vessels (%)
People in Group quarters - Other nonhousehold living situations (%)
People in Group quarters - Other noninstitutional group quarters (%)
Residents speaking English at home (%)
Residents speaking English at home - Born in the United States (%)
Residents speaking English at home - Native, born elsewhere (%)
Residents speaking English at home - Foreign born (%)
Residents speaking Spanish at home (%)
Residents speaking Spanish at home - Born in the United States (%)
Residents speaking Spanish at home - Native, born elsewhere (%)
Residents speaking Spanish at home - Foreign born (%)
Residents speaking other language at home (%)
Residents speaking other language at home - Born in the United States (%)
Residents speaking other language at home - Native, born elsewhere (%)
Residents speaking other language at home - Foreign born (%)
Class of Workers - Employee of private company (%)
Class of Workers - Self-employed in own incorporated business (%)
Class of Workers - Private not-for-profit wage and salary workers (%)
Class of Workers - Local government workers (%)
Class of Workers - State government workers (%)
Class of Workers - Federal government workers (%)
Class of Workers - Self-employed workers in own not incorporated business and Unpaid family workers (%)
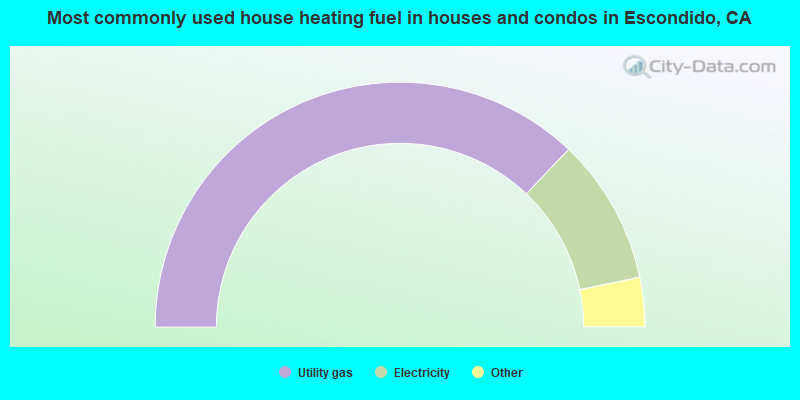
House heating fuel used in houses and condos - Utility gas (%)
House heating fuel used in houses and condos - Bottled, tank, or LP gas (%)
House heating fuel used in houses and condos - Electricity (%)
House heating fuel used in houses and condos - Fuel oil, kerosene, etc. (%)
House heating fuel used in houses and condos - Coal or coke (%)
House heating fuel used in houses and condos - Wood (%)
House heating fuel used in houses and condos - Solar energy (%)
House heating fuel used in houses and condos - Other fuel (%)
House heating fuel used in houses and condos - No fuel used (%)
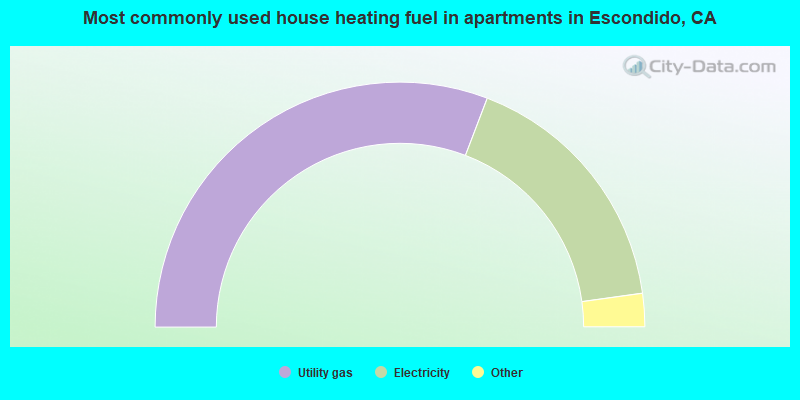
House heating fuel used in apartments - Utility gas (%)
House heating fuel used in apartments - Bottled, tank, or LP gas (%)
House heating fuel used in apartments - Electricity (%)
House heating fuel used in apartments - Fuel oil, kerosene, etc. (%)
House heating fuel used in apartments - Coal or coke (%)
House heating fuel used in apartments - Wood (%)
House heating fuel used in apartments - Solar energy (%)
House heating fuel used in apartments - Other fuel (%)
House heating fuel used in apartments - No fuel used (%)
Armed forces status - In Armed Forces (%)
Armed forces status - Civilian (%)
Armed forces status - Civilian - Veteran (%)
Armed forces status - Civilian - Nonveteran (%)
Fatal accidents locations in years 2005-2021
Fatal accidents locations in 2005
Fatal accidents locations in 2006
Fatal accidents locations in 2007
Fatal accidents locations in 2008
Fatal accidents locations in 2009
Fatal accidents locations in 2010
Fatal accidents locations in 2011
Fatal accidents locations in 2012
Fatal accidents locations in 2013
Fatal accidents locations in 2014
Fatal accidents locations in 2015
Fatal accidents locations in 2016
Fatal accidents locations in 2017
Fatal accidents locations in 2018
Fatal accidents locations in 2019
Fatal accidents locations in 2020
Fatal accidents locations in 2021
Alcohol use - People drinking some alcohol every month (%)
Alcohol use - People not drinking at all (%)
Alcohol use - Average days/month drinking alcohol
Alcohol use - Average drinks/week
Alcohol use - Average days/year people drink much
Audiometry - Average condition of hearing (%)
Audiometry - People that can hear a whisper from across a quiet room (%)
Audiometry - People that can hear normal voice from across a quiet room (%)
Audiometry - Ears ringing, roaring, buzzing (%)
Audiometry - Had a job exposure to loud noise (%)
Audiometry - Had off-work exposure to loud noise (%)
Blood Pressure & Cholesterol - Has high blood pressure (%)
Blood Pressure & Cholesterol - Checking blood pressure at home (%)
Blood Pressure & Cholesterol - Frequently checking blood cholesterol (%)
Blood Pressure & Cholesterol - Has high cholesterol level (%)
Consumer Behavior - Money monthly spent on food at supermarket/grocery store
Consumer Behavior - Money monthly spent on food at other stores
Consumer Behavior - Money monthly spent on eating out
Consumer Behavior - Money monthly spent on carryout/delivered foods
Consumer Behavior - Income spent on food at supermarket/grocery store (%)
Consumer Behavior - Income spent on food at other stores (%)
Consumer Behavior - Income spent on eating out (%)
Consumer Behavior - Income spent on carryout/delivered foods (%)
Current Health Status - General health condition (%)
Current Health Status - Blood donors (%)
Current Health Status - Has blood ever tested for HIV virus (%)
Current Health Status - Left-handed people (%)
Dermatology - People using sunscreen (%)
Diabetes - Diabetics (%)
Diabetes - Had a blood test for high blood sugar (%)
Diabetes - People taking insulin (%)
Diet Behavior & Nutrition - Diet health (%)
Diet Behavior & Nutrition - Milk product consumption (# of products/month)
Diet Behavior & Nutrition - Meals not home prepared (#/week)
Diet Behavior & Nutrition - Meals from fast food or pizza place (#/week)
Diet Behavior & Nutrition - Ready-to-eat foods (#/month)
Diet Behavior & Nutrition - Frozen meals/pizza (#/month)
Drug Use - People that ever used marijuana or hashish (%)
Drug Use - Ever used hard drugs (%)
Drug Use - Ever used any form of cocaine (%)
Drug Use - Ever used heroin (%)
Drug Use - Ever used methamphetamine (%)
Health Insurance - People covered by health insurance (%)
Kidney Conditions-Urology - Avg. # of times urinating at night
Medical Conditions - People with asthma (%)
Medical Conditions - People with anemia (%)
Medical Conditions - People with psoriasis (%)
Medical Conditions - People with overweight (%)
Medical Conditions - Elderly people having difficulties in thinking or remembering (%)
Medical Conditions - People who ever received blood transfusion (%)
Medical Conditions - People having trouble seeing even with glass/contacts (%)
Medical Conditions - People with arthritis (%)
Medical Conditions - People with gout (%)
Medical Conditions - People with congestive heart failure (%)
Medical Conditions - People with coronary heart disease (%)
Medical Conditions - People with angina pectoris (%)
Medical Conditions - People who ever had heart attack (%)
Medical Conditions - People who ever had stroke (%)
Medical Conditions - People with emphysema (%)
Medical Conditions - People with thyroid problem (%)
Medical Conditions - People with chronic bronchitis (%)
Medical Conditions - People with any liver condition (%)
Medical Conditions - People who ever had cancer or malignancy (%)
Mental Health - People who have little interest in doing things (%)
Mental Health - People feeling down, depressed, or hopeless (%)
Mental Health - People who have trouble sleeping or sleeping too much (%)
Mental Health - People feeling tired or having little energy (%)
Mental Health - People with poor appetite or overeating (%)
Mental Health - People feeling bad about themself (%)
Mental Health - People who have trouble concentrating on things (%)
Mental Health - People moving or speaking slowly or too fast (%)
Mental Health - People having thoughts they would be better off dead (%)
Oral Health - Average years since last visit a dentist
Oral Health - People embarrassed because of mouth (%)
Oral Health - People with gum disease (%)
Oral Health - General health of teeth and gums (%)
Oral Health - Average days a week using dental floss/device
Oral Health - Average days a week using mouthwash for dental problem
Oral Health - Average number of teeth
Pesticide Use - Households using pesticides to control insects (%)
Pesticide Use - Households using pesticides to kill weeds (%)
Physical Activity - People doing vigorous-intensity work activities (%)
Physical Activity - People doing moderate-intensity work activities (%)
Physical Activity - People walking or bicycling (%)
Physical Activity - People doing vigorous-intensity recreational activities (%)
Physical Activity - People doing moderate-intensity recreational activities (%)
Physical Activity - Average hours a day doing sedentary activities
Physical Activity - Average hours a day watching TV or videos
Physical Activity - Average hours a day using computer
Physical Functioning - People having limitations keeping them from working (%)
Physical Functioning - People limited in amount of work they can do (%)
Physical Functioning - People that need special equipment to walk (%)
Physical Functioning - People experiencing confusion/memory problems (%)
Physical Functioning - People requiring special healthcare equipment (%)
Prescription Medications - Average number of prescription medicines taking
Preventive Aspirin Use - Adults 40+ taking low-dose aspirin (%)
Reproductive Health - Vaginal deliveries (%)
Reproductive Health - Cesarean deliveries (%)
Reproductive Health - Deliveries resulted in a live birth (%)
Reproductive Health - Pregnancies resulted in a delivery (%)
Reproductive Health - Women breastfeeding newborns (%)
Reproductive Health - Women that had a hysterectomy (%)
Reproductive Health - Women that had both ovaries removed (%)
Reproductive Health - Women that have ever taken birth control pills (%)
Reproductive Health - Women taking birth control pills (%)
Reproductive Health - Women that have ever used Depo-Provera or injectables (%)
Reproductive Health - Women that have ever used female hormones (%)
Sexual Behavior - People 18+ that ever had sex (vaginal, anal, or oral) (%)
Sexual Behavior - Males 18+ that ever had vaginal sex with a woman (%)
Sexual Behavior - Males 18+ that ever performed oral sex on a woman (%)
Sexual Behavior - Males 18+ that ever had anal sex with a woman (%)
Sexual Behavior - Males 18+ that ever had any sex with a man (%)
Sexual Behavior - Females 18+ that ever had vaginal sex with a man (%)
Sexual Behavior - Females 18+ that ever performed oral sex on a man (%)
Sexual Behavior - Females 18+ that ever had anal sex with a man (%)
Sexual Behavior - Females 18+ that ever had any kind of sex with a woman (%)
Sexual Behavior - Average age people first had sex
Sexual Behavior - Average number of female sex partners in lifetime (males 18+)
Sexual Behavior - Average number of female vaginal sex partners in lifetime (males 18+)
Sexual Behavior - Average age people first performed oral sex on a woman (18+)
Sexual Behavior - Average number of woman performed oral sex on in lifetime (18+)
Sexual Behavior - Average number of male sex partners in lifetime (males 18+)
Sexual Behavior - Average number of male anal sex partners in lifetime (males 18+)
Sexual Behavior - Average age people first performed oral sex on a man (18+)
Sexual Behavior - Average number of male oral sex partners in lifetime (18+)
Sexual Behavior - People using protection when performing oral sex (%)
Sexual Behavior - Average number of times people have vaginal or anal sex a year
Sexual Behavior - People having sex without condom (%)
Sexual Behavior - Average number of male sex partners in lifetime (females 18+)
Sexual Behavior - Average number of male vaginal sex partners in lifetime (females 18+)
Sexual Behavior - Average number of female sex partners in lifetime (females 18+)
Sexual Behavior - Circumcised males 18+ (%)
Sleep Disorders - Average hours sleeping at night
Sleep Disorders - People that has trouble sleeping (%)
Smoking-Cigarette Use - People smoking cigarettes (%)
Taste & Smell - People 40+ having problems with smell (%)
Taste & Smell - People 40+ having problems with taste (%)
Taste & Smell - People 40+ that ever had wisdom teeth removed (%)
Taste & Smell - People 40+ that ever had tonsils teeth removed (%)
Taste & Smell - People 40+ that ever had a loss of consciousness because of a head injury (%)
Taste & Smell - People 40+ that ever had a broken nose or other serious injury to face or skull (%)
Taste & Smell - People 40+ that ever had two or more sinus infections (%)
Weight - Average height (inches)
Weight - Average weight (pounds)
Weight - Average BMI
Weight - People that are obese (%)
Weight - People that ever were obese (%)
Weight - People trying to lose weight (%)
76,851 51.1% Hispanic 51,977 34.6% White alone 9,130 6.1% Asian alone 5,589 3.7% Two or more races 4,560 3.0% Black alone 1,670 1.1% Other race alone 249 0.2% American Indian alone 232 0.2% Native Hawaiian and Other
The City-Data.com crime index weighs serious crimes and violent crimes more heavily. Higher means more crime, U.S. average is 246.1. It adjusts for the number of visitors and daily workers commuting into cities.
- means the value is smaller than the state average.
- means the value is about the same as the state average.
- means the value is bigger than the state average.
- means the value is much bigger than the state average.
Crime rate in Escondido detailed stats: murders, rapes, robberies, assaults, burglaries, thefts, arson Officers per 1,000 residents here:
0.96California average:
2.30
Latest news from Escondido, CA collected exclusively by city-data.com from local newspapers, TV, and radio stations
Escondido, CA City Guides: Ancestries: German (3.3%), English (2.6%), American (2.4%), European (2.1%), Irish (1.8%), Italian (1.4%).
Current Local Time:
Land area: 36.3 square miles.
Population density: 4,142 people per square mile (average).
41,022 residents are foreign born (21.0% Latin America , 4.8% Asia ).
This city:
27.3%California:
26.5%
Median real estate property taxes paid for housing units with mortgages in 2022: $5,290 (0.7%)Median real estate property taxes paid for housing units with no mortgage in 2022: $3,439 (0.5%)
Nearest city with pop. 200,000+: San Diego, CA
Nearest cities:
Latitude: 33.12 N, Longitude: 117.08 W
Daytime population change due to commuting: -16,387 (-10.9%)Workers who live and work in this city: 28,897 (36.9%)
Escondido tourist attractions:
Single-family new house construction building permits:
2022: 165 buildings , average cost: $253,1002021: 338 buildings , average cost: $310,6002020: 240 buildings , average cost: $194,0002019: 23 buildings , average cost: $166,9002018: 20 buildings , average cost: $224,0002017: 235 buildings , average cost: $278,1002016: 81 buildings , average cost: $271,1002015: 20 buildings , average cost: $221,4002014: 17 buildings , average cost: $170,4002013: 8 buildings , average cost: $215,3002012: 6 buildings , average cost: $180,2002011: 32 buildings , average cost: $276,6002010: 84 buildings , average cost: $258,4002009: 114 buildings , average cost: $274,4002008: 120 buildings , average cost: $256,2002007: 131 buildings , average cost: $269,1002006: 386 buildings , average cost: $232,4002005: 239 buildings , average cost: $197,6002004: 224 buildings , average cost: $235,7002003: 494 buildings , average cost: $235,0002002: 348 buildings , average cost: $216,3002001: 244 buildings , average cost: $204,2002000: 282 buildings , average cost: $220,1001999: 220 buildings , average cost: $221,7001998: 371 buildings , average cost: $204,8001997: 430 buildings , average cost: $197,400Unemployment in December 2023:
Population change in the 1990s: +23,849 (+21.7%).
Most common industries in Escondido, CA (%)
Both Males Females
Health care (10.0%)
Accommodation & food services (8.9%)
Administrative & support & waste management services (8.5%)
Construction (8.2%)
Professional, scientific, technical services (6.7%)
Educational services (6.6%)
Agriculture, forestry, fishing & hunting (3.9%)
Construction (13.7%)
Administrative & support & waste management services (11.7%)
Professional, scientific, technical services (6.7%)
Accommodation & food services (6.5%)
Agriculture, forestry, fishing & hunting (6.3%)
Health care (3.9%)
Educational services (3.4%)
Health care (18.0%)
Accommodation & food services (12.1%)
Educational services (10.9%)
Professional, scientific, technical services (6.7%)
Administrative & support & waste management services (4.4%)
Finance & insurance (3.7%)
Private households (3.5%)
Most common occupations in Escondido, CA (%)
Both Males Females
Building and grounds cleaning and maintenance occupations (10.1%)
Cooks and food preparation workers (6.4%)
Other management occupations, except farmers and farm managers (4.3%)
Agricultural workers, including supervisors (3.3%)
Retail sales workers, except cashiers (3.1%)
Material recording, scheduling, dispatching, and distributing workers (2.6%)
Supervisors and other personal care and service workers, except child care workers (2.5%)
Building and grounds cleaning and maintenance occupations (11.5%)
Cooks and food preparation workers (5.4%)
Agricultural workers, including supervisors (5.2%)
Other management occupations, except farmers and farm managers (4.0%)
Construction laborers (4.0%)
Computer specialists (3.9%)
Driver/sales workers and truck drivers (3.9%)
Building and grounds cleaning and maintenance occupations (8.2%)
Cooks and food preparation workers (7.9%)
Other management occupations, except farmers and farm managers (4.8%)
Supervisors and other personal care and service workers, except child care workers (4.8%)
Information and record clerks, except customer service representatives (4.6%)
Cashiers (4.2%)
Retail sales workers, except cashiers (3.9%)
Earthquake activity:
Escondido-area historical earthquake activity is significantly above California state average. It is 6265% greater than the overall U.S. average. On 6/28/1992 at 11:57:34, a magnitude 7.6 (6.2 MB, 7.6 MS, 7.3 MW, Depth: 0.7 mi, Class: Major, Intensity: VIII - XII) earthquake occurred 79.8 miles away from Escondido center, causing 3 deaths ( 1 shaking deaths, 2 other deaths) and 400 injuries, causing $100,000,000 total damage and $40,000,000 insured lossesOn 7/21/1952 at 11:52:14, a magnitude 7.7 (7.7 UK) earthquake occurred 170.0 miles away from Escondido center, causing $50,000,000 total damage On 10/16/1999 at 09:46:44, a magnitude 7.4 (6.3 MB, 7.4 MS, 7.2 MW, 7.3 ML) earthquake occurred 103.1 miles away from Escondido center On 5/19/1940 at 04:36:40, a magnitude 7.2 (7.2 UK) earthquake occurred 80.4 miles away from Escondido center, causing $33,000,000 total damage On 12/31/1934 at 18:45:56, a magnitude 7.1 (7.1 UK) earthquake occurred 82.5 miles away from Escondido center On 10/15/1979 at 23:16:54, a magnitude 7.0 (5.7 MB, 6.9 MS, 7.0 ML, 6.4 MW) earthquake occurred 86.4 miles away from Escondido center Magnitude types: body-wave magnitude (MB), local magnitude (ML), surface-wave magnitude (MS), moment magnitude (MW) Natural disasters: The number of natural disasters in San Diego County (39) is a lot greater than the US average (15).Major Disasters (Presidential) Declared: 21Emergencies Declared: 2Fires: 21, Floods: 17, Storms: 9, Winter Storms: 6, Landslides: 5, Mudslides: 4, Freeze: 1, Heavy Rain: 1, Hurricane: 1, Tornado: 1, Other: 1 (Note: some incidents may be assigned to more than one category). Main business address for: REALTY INCOME CORP REAL ESTATE INVESTMENT TRUSTS ).
Hospitals in Escondido: ELIZABETH HOSPICE (150 W CREST STREET) PALOMAR HEALTH DOWNTOWN CAMPUS (Government - Hospital District or Authority, 555 E VALLEY PARKWAY) Nursing Homes in Escondido: ESCONDIDO POST ACUTE REHAB (421 E MISSION AVE) LAS VILLAS DEL NORTE HEALTH CENTER (1335 LAS VILLAS WAY) LIFE CARE CENTER OF ESCONDIDO (1980 FELICITA ROAD) PALOMAR CONTINUING CARE CENTER D/P SNF (1817 AVE DEL DIABLO) PALOMAR CONVALESCENT CENTER (1817 AVENIDA DEL DIABLO) PALOMAR HEIGHTS POST ACUTE REHAB (1260 E OHIO AVENUE) PALOMAR VISTA HEALTHCARE CENTER (201 N FIG STREET) REDWOOD TERRACE HEALTH CENTER (710 W 13TH AVE) REGENCY NURSING CENTER (1980 FELICITA RD) VALLE VISTA CONVALESCENT HOSPITAL (1025 W. SECOND AVENUE) Dialysis Facilities in Escondido: ESCONDIDO DIALYSIS (203 E. SECOND AVENUE) Home Health Centers in Escondido: INTERIM HEALTHCARE OF SAN DIEGO COUNTY (425 W 5TH AVENUE, SUITE 101 & 104) PALOMAR POMERADO HOME HEALTH (975 SOUTH ANDREASEN DRIVE) Amtrak stations near Escondido: 15 miles: SOLANA BEACH (105 S. CEDROS AVE.) Services: ticket office, fully wheelchair accessible, enclosed waiting area, public restrooms, public payphones, full-service food facilities, free short-term parking, free long-term parking, call for car rental service, taxi stand, public transit connection.
18 miles: OCEANSIDE (235 S. TREMONT ST.) Services: ticket office, fully wheelchair accessible, enclosed waiting area, public restrooms, public payphones, snack bar, free short-term parking, free long-term parking, call for car rental service, taxi stand, intercity bus service, public transit connection.
Colleges/Universities in Escondido: John Paul the Great Catholic University Full-time enrollment: 182; Location: 155 W. Grand Ave; Private, not-for-profit; Website: www.jpcatholic.com/; Offers Master's degree )
Westminster Theological Seminary in California Full-time enrollment: 171; Location: 1725 Bear Valley Parkway; Private, not-for-profit; Website: www.wscal.edu; Offers Master's degree )
Healing Hands School of Holistic Health Full-time enrollment: 161; Location: 125 W Mission Ave Ste 212; Private, for-profit; Website: www.healinghandsschool.com)
Colleges/universities with over 2000 students nearest to Escondido:
California State University-San Marcos (about 5 miles; San Marcos, CA ; Full-time enrollment: 8,070)
Palomar College (about 7 miles; San Marcos, CA ; FT enrollment: 15,037)
MiraCosta College (about 14 miles; Oceanside, CA ; FT enrollment: 11,189)
San Diego Miramar College (about 16 miles; San Diego, CA ; FT enrollment: 5,128)
Alliant International University (about 16 miles; San Diego, CA ; FT enrollment: 3,155)
National University (about 18 miles; La Jolla, CA ; FT enrollment: 24,215)
University of California-San Diego (about 20 miles; La Jolla, CA ; FT enrollment: 29,297)
Biggest public high schools in Escondido: ESCONDIDO HIGH Students: 1,951, Location: 1535 N. BRD.WAY, Grades: 9-12)SAN PASQUAL HIGH Students: 1,782, Location: 3300 BEAR VALLEY PKWY., Grades: 9-12)ORANGE GLEN HIGH Students: 1,564, Location: 2200 GLEN RIDGE RD., Grades: 9-12)ESCONDIDO CHARTER HIGH Students: 469, Location: 1868 E. VALLEY PKWY., Grades: 9-12, Charter school )DEHESA CHARTER Students: 437, Location: 1441 MONTIEL RD., STE. 143, Grades: KG-12, Charter school )COMMUNITY MONTESSORI CHARTER Students: 237, Location: 1441 MONTIEL RD., STE 143, Grades: KG-12, Charter school )CLASSICAL ACADEMY HIGH Students: 175, Location: 144 W. WOODWARD AVE, Grades: 9-12, Charter school )VALLEY HIGH (CONTINUATION) Students: 87, Location: 410 N. HIDDEN TRAILS RD., Grades: 9-12)SAN PASQUAL ACADEMY Students: 64, Location: 17701 SAN PASQUAL VALLEY RD., Grades: 9-12)DEL LAGO ACADEMY - CAMPUS OF APPLIED SCIENCE Location: 1740 SCENIC TRAIL WAY, Grades: 9-12)
Private high schools in Escondido: CALVIN CHRISTIAN SCHOOL Students: 475, Location: 2000 N BROADWAY, Grades: PK-12)
KINGS ACADEMY Students: 44, Location: 1717 E LINCOLN AVE, Grades: PK-12)
SUMMERHILL SCHOOL Students: 13, Location: 329 E VALLEY PKWY, Grades: 9-12, Boys only )
Biggest public elementary/middle schools in Escondido: RINCON MIDDLE Students: 1,279, Location: 925 LEHNER AVE., Grades: 6-8)HIDDEN VALLEY MIDDLE Students: 1,202, Location: 2700 REED RD., Grades: 6-8)BEAR VALLEY MIDDLE Students: 1,137, Location: 3003 BEAR VALLEY PKWY., Grades: 6-8)CLASSICAL ACADEMY Students: 595, Location: 2950 S. BEAR VALLEY PKWY., Grades: KG-8, Charter school )L. R. GREEN ELEMENTARY Students: 527, Location: 3115 LAS PALMAS AVE., Grades: KG-5)ORANGE GLEN ELEMENTARY Students: 493, Location: 2861 VALLEY PKWY., Grades: KG-5)FARR AVENUE ELEMENTARY Students: 485, Location: 933 FARR AVE., Grades: KG-5)REIDY CREEK ELEMENTARY Students: 464, Location: 2869 N. BRD.WAY, Grades: KG-5)CONWAY ELEMENTARY Students: 455, Location: 1325 CONWAY DR., Grades: KG-5)SAN PASQUAL UNION ELEMENTARY Students: 450, Location: 15305 ROCKWOOD RD., Grades: KG-8)Private elementary/middle schools in Escondido: ESCONDIDO CHRISTIAN SCHOOL Students: 404, Location: 923 IDAHO AVE, Grades: PK-8)GRACE LUTHERAN CHURCH & SCHOOLS Students: 315, Location: 643 W 13TH AVE, Grades: PK-8)
LIGHT & LIFE CHRISTIAN SCHOOL Students: 259, Location: 120 N ASH ST, Grades: PK-8)
ST MARY'S SCHOOL Students: 243, Location: 130 E 13TH AVE, Grades: KG-8)
ASCENSION LUTHERAN SCHOOL Students: 42, Location: 1140 N MIDWAY DR, Grades: KG-8)
ROCKY VIEW Students: 8, Location: 2436 FAWN CREEK LN, Grades: 2-8)
See full list of schools located in Escondido Library in Escondido: ESCONDIDO PUBLIC LIBRARY Operating income: $4,453,761; Location: 239 S. KALMIA ST.; 225,242 books ; 12,376 audio materials ; 28,574 video materials ; 15 local licensed databases ; 1 other licensed databases ; 387 print serial subscriptions ; 1 electronic serial subscriptions )
User-submitted facts and corrections:
When I visited last weekend, I learned that 92.1 is now assigned to KSON also.
Notable locations in Escondido: (A) , Vineyard Golf Course (B) , El Arroyo Picnic Area (C) , Ferrara Winery (D) , Escondido Recreational Vehicle Park (E) , Escondido Country Club (F) , Golden Circle Valley Country Club (G) , Escondido City Hall (H) , Mathes Community Cultural Center (I) , Ice Floe Ice Center (J) , Escondido Public Library (K) , Escondido Museum (L) , California Center for the Arts Escondido (M) , Escondido Chamber of Commerce and Visitors Bureau (N) , Americare Ambulance Service Escondido (O) , Escondido Fire Department Station 3 Escondido Hills (P) , Escondido Fire Department Station 2 East Valley (Q) , Escondido Fire Department Station 1 Center City (R) , Escondido Fire Department Station 4 Bear Valley (S) . Display/hide their locations on the map
Shopping Centers: (1) , North County Fair Shopping Center (2) , Felicita Village Shopping Center (3) , Felicita Town Center Shopping Center (4) , Felicita Plaza Shopping Center (5) , Plaza las Palmas Shopping Center (6) , Mission Village Shopping Center (7) , Lucky Shopping Center (8) , Escondido Promenade Shopping Center (9) . Display/hide their locations on the map
Main business address in Escondido: (A) . Display/hide its location on the map
Churches in Escondido include: (A) , Ascension Evangelical Lutheran Church (B) , Bethel Assembly Christian Evangelistic Church (C) , Broadway Baptist Church (D) , Calvary Assembly of God Church (E) , Christian Reformed Church (F) , Church of Christ (G) , Church of the Resurrection (H) , First Congregational Church of Escondido (I) . Display/hide their locations on the map
Cemetery: (1) . Display/hide its location on the map
Reservoir: (A) . Display/hide its location on the map
Streams, rivers, and creeks: (A) . Display/hide its location on the map
Parks in Escondido include: (1) , Dixon Dam and Lake City Park (2) , Mountain View Park (3) , Oak Hill City Park (4) , Conway City Park (5) , El Norte Park (6) , Grape Day Park (7) , Jesmond Dene Park (8) , Rod McLeod Park (9) . Display/hide their locations on the map
Tourist attractions: (1) , Boomers (Amusement & Theme Parks; 830 Dan Way) (2) . Display/hide their approximate locations on the map
Hotels: (1) , Best Value Inn & Suites (555 North Centre City Parkway) (2) , Alma Plaza Motel (450 West 13th Avenue) (3) . Display/hide their approximate locations on the map
Birthplace of: Gavvy Cravath - Baseball player, Kevin Craft - Former college football quarterback, Lester Bangs - (died 1982), music journalist, author, musician, Pete Coscarart - Baseball player, Denise White - Chief executive officer of EAG Sports Management, Joey Martinez - Soccer player, John Mallinger - PGA Tour Golf player (born : 9/25/79), Mark Wyland - Californian politician, Paul Withington - Football player and coach, Bryan Wagner (American football) - Former NFL punter.
San Diego County has a predicted average indoor radon screening level less than 2 pCi/L (pico curies per liter) - Low Potential Drinking water stations with addresses in Escondido and their reported violations in the past:
DOLLAR GENERAL LAKE HILLS (Serves TX, Population served: 27, Groundwater):
Past monitoring violations:
Monitoring, Source Water (GWR) - In SEP-01-2013, Contaminant: E. COLI. Follow-up actions: St Public Notif received (NOV-15-2013), St Public Notif requested (DEC-18-2013), St Violation/Reminder Notice (DEC-18-2013)
14 routine major monitoring violations
2 minor monitoring violations
Serves FL, Population served: 25, Groundwater):
Past monitoring violations:
Failure to Conduct Assessment Monitoring - Between APR-2013 and JUN-2013, Contaminant: E. COLI. Follow-up actions: St Violation/Reminder Notice (AUG-01-2013), St Public Notif received (AUG-16-2013), St Compliance achieved (AUG-21-2013)
One routine major monitoring violation
Population served: 25, Groundwater):
Past monitoring violations:
4 routine major monitoring violations
Population served: 25, Groundwater):
Past monitoring violations:
2 routine major monitoring violations
Drinking water stations with addresses in Escondido that have no violations reported:
WAWA MECHANICSVILLE #583 (Serves MD, Population served: 206, Primary Water Source Type: Groundwater)
Average household size: This city:
3.1 peopleCalifornia:
2.9 people
Percentage of family households: This city:
72.0%Whole state:
68.7%
Percentage of households with unmarried partners: This city:
7.6%Whole state:
7.2%
Likely homosexual households (counted as self-reported same-sex unmarried-partner households)
Lesbian couples: 0.4% of all households Gay men: 0.3% of all households
People in group quarters in Escondido in 2010:
657 people in nursing facilities/skilled-nursing facilities
451 people in other noninstitutional facilities
362 people in group homes intended for adults
295 people in residential treatment centers for adults
143 people in emergency and transitional shelters (with sleeping facilities) for people experiencing homelessness
103 people in group homes for juveniles (non-correctional)
82 people in workers' group living quarters and job corps centers
18 people in residential treatment centers for juveniles (non-correctional)
5 people in correctional residential facilities
3 people in in-patient hospice facilities
People in group quarters in Escondido in 2000:
696 people in nursing homes
639 people in other noninstitutional group quarters
194 people in homes or halfway houses for drug/alcohol abuse
104 people in homes for the mentally retarded
94 people in homes for the physically handicapped
22 people in other nonhousehold living situations
11 people in other group homes
3 people in religious group quarters
2 people in homes for the mentally ill
Banks with most branches in Escondido (2011 data):
Wells Fargo Bank, National Association: Escondido Fifth Street Branch, East Escondido Branch, West Valley Parkway Branch, Escondido Main Branch, El Norte Plaza Branch. Info updated 2011/04/05: Bank assets: $1,161,490.0 mil, Deposits: $905,653.0 mil, headquarters in Sioux Falls, SD, positive income , 6395 total offices , Holding Company: Wells Fargo & Company
JPMorgan Chase Bank, National Association: Escondido South Branch, Escondido Valley Parkway Banking Cen, Del Norte Branch, Escondido State Brothers Banking Cen, Escondido Branch. Info updated 2011/11/10: Bank assets: $1,811,678.0 mil, Deposits: $1,190,738.0 mil, headquarters in Columbus, OH, positive income , International Specialization, 5577 total offices , Holding Company: Jpmorgan Chase & Co.
Bank of America, National Association: West Mission Branch, Escondido Branch, East Escondido Branch. Info updated 2009/11/18: Bank assets: $1,451,969.3 mil, Deposits: $1,077,176.8 mil, headquarters in Charlotte, NC, positive income , 5782 total offices , Holding Company: Bank Of America Corporation
U.S. Bank National Association: Escondido Albertsons Branch, Escondido Valley Parkway Branch, Escondido Branch. Info updated 2012/01/30: Bank assets: $330,470.8 mil, Deposits: $236,091.5 mil, headquarters in Cincinnati, OH, positive income , 3121 total offices , Holding Company: U.S. Bancorp
California Community Bank: Escondido Branch at 1334 West Valley Parkway, Suite 402, branch established on 2007/05/28; at 1320 West Valley Parkway, Suite 301, branch established on 2003/08/11. Info updated 2007/05/30: Bank assets: $243.8 mil, Deposits: $217.1 mil, local headquarters , positive income , Commercial Lending Specialization, 5 total offices
Union Bank, National Association: Escondido Branch at 303 West Grand Avenue, branch established on 1957/09/16. Info updated 2011/09/01: Bank assets: $88,967.5 mil, Deposits: $65,286.4 mil, headquarters in San Francisco, CA, positive income , Commercial Lending Specialization, 403 total offices , Holding Company: Mitsubishi Ufj Financial Group, Inc.
Security Business Bank of San Diego: Escondido Branch at 800 La Terazza Blvd., branch established on 2011/08/15. Info updated 2006/11/03: Bank assets: $233.4 mil, Deposits: $181.1 mil, headquarters in San Diego, CA, positive income , Commercial Lending Specialization, 4 total offices , Holding Company: Security Business Bancorp
First-Citizens Bank & Trust Company: Escondido Branch at 300 West Grand Ave., branch established on 1999/10/04. Info updated 2011/10/11: Bank assets: $20,566.4 mil, Deposits: $17,596.8 mil, headquarters in Raleigh, NC, positive income , Commercial Lending Specialization, 433 total offices , Holding Company: First Citizens Bancshares, Inc.
Pacific Western Bank: Escondido Branch at 900 Canterbury Place Ste 100, branch established on 2001/04/02. Info updated 2011/03/14: Bank assets: $5,513.1 mil, Deposits: $4,614.5 mil, headquarters in Los Angeles, CA, positive income , Commercial Lending Specialization, 78 total offices , Holding Company: Capgen Capital Group Ii Lp
8 other banks with 8 local branches
For population 15 years and over in Escondido:
Never married: 36.0%Now married: 48.5%Separated: 2.3%Widowed: 3.8%Divorced: 9.4% For population 25 years and over in Escondido:
High school or higher: 83.1%Bachelor's degree or higher: 28.5%Graduate or professional degree: 9.9%Unemployed: 2.6%Mean travel time to work (commute): 24.8 minutes
Education Gini index (Inequality in education) Here:
17.3California average:
15.5
Religion statistics for Escondido, CA (based on San Diego County data)
Religion Adherents Congregations Catholic 801,850 115 Evangelical Protestant 302,320 974 Other 161,530 349 Mainline Protestant 74,992 211 Black Protestant 10,857 52 Orthodox 7,828 19 None 1,735,936 -
Source: Clifford Grammich, Kirk Hadaway, Richard Houseal, Dale E.Jones, Alexei Krindatch, Richie Stanley and Richard H.Taylor. 2012. 2010 U.S.Religion Census: Religious Congregations & Membership Study. Association of Statisticians of American Religious Bodies. Jones, Dale E., et al. 2002. Congregations and Membership in the United States 2000. Nashville, TN: Glenmary Research Center. Graphs represent county-level data
Food Environment Statistics: Number of grocery stores : 574San Diego County :
1.94 / 10,000 pop.State :
2.14 / 10,000 pop.
Number of supercenters and club stores : 17Here :
0.06 / 10,000 pop.State :
0.04 / 10,000 pop.
Number of convenience stores (no gas) : 227San Diego County :
0.77 / 10,000 pop.State :
0.62 / 10,000 pop.
Number of convenience stores (with gas) : 487This county :
1.65 / 10,000 pop.California :
1.49 / 10,000 pop.
Number of full-service restaurants : 2,238Here :
7.56 / 10,000 pop.State :
7.42 / 10,000 pop.
Adult diabetes rate : This county :
6.5%California :
7.3%
Adult obesity rate : This county :
22.2%California :
21.3%
Low-income preschool obesity rate : Here :
16.0%California :
17.9%
Health and Nutrition: Healthy diet rate : Escondido:
48.1%California:
49.4%
Average overall health of teeth and gums : Average BMI : Escondido:
28.2California:
28.1
People feeling badly about themselves : This city:
21.1%State:
20.2%
People not drinking alcohol at all : Escondido:
10.2%California:
11.2%
Average hours sleeping at night : This city:
6.8California:
6.8
Overweight people : This city:
31.7%California:
31.5%
General health condition : Escondido:
56.0%California:
56.4%
Average condition of hearing : Escondido:
80.4%California:
80.9%
More about Health and Nutrition of Escondido, CA Residents
Local government employment and payroll (March 2022)
Function
Full-time employees
Monthly full-time payroll
Average yearly full-time wage
Part-time employees
Monthly part-time payroll
Police Protection - Officers
147 $1,397,360 $114,070 3 $6,967 Firefighters
103 $872,682 $101,672 0 $0 Water Supply
71 $500,223 $84,545 1 $2,879 Streets and Highways
69 $417,697 $72,643 11 $15,258 Sewerage
67 $526,141 $94,234 2 $2,825 Police - Other
57 $333,377 $70,185 31 $55,239 Financial Administration
52 $317,817 $73,342 1 $1,847 Other Government Administration
39 $265,050 $81,554 5 $10,126 Other and Unallocable
38 $212,663 $67,157 23 $40,255 Housing and Community Development (Local)
26 $167,577 $77,343 4 $11,007 Natural Resources
25 $124,914 $59,959 1 $1,394 Parks and Recreation
23 $123,113 $64,233 103 $157,309 Fire - Other
12 $67,454 $67,454 1 $1,300 Health
10 $62,447 $74,936 0 $0 Judicial and Legal
10 $97,924 $117,509 1 $2,767 Welfare
3 $15,724 $62,896 4 $5,372 Solid Waste Management
3 $12,821 $51,284 0 $0
Totals for Government
755 $5,514,984 $87,655 191 $314,545
Escondido government finances - Expenditure in 2018 (per resident):
Construction - Sewerage: $18,312,000 ($121.86)
Water Utilities: $11,309,000 ($75.26)Current Operations - Water Utilities: $55,437,000 ($368.92)
Police Protection: $43,207,000 ($287.53)Sewerage: $24,866,000 ($165.48)Local Fire Protection: $24,536,000 ($163.28)Regular Highways: $13,685,000 ($91.07)Parks and Recreation: $9,468,000 ($63.01)Central Staff Services: $8,307,000 ($55.28)Protective Inspection and Regulation - Other: $5,486,000 ($36.51)Libraries: $3,512,000 ($23.37)Financial Administration: $1,805,000 ($12.01)Health - Other: $1,559,000 ($10.37)Housing and Community Development: $1,420,000 ($9.45)Judicial and Legal Services: $40,000 ($0.27)General - Other: $14,000 ($0.09)General - Interest on Debt: $13,313,000 ($88.59)
Intergovernmental to Local - Other - Water Utilities: $21,373,000 ($142.23)
Other - General - Other: $471,000 ($3.13)Other - Natural Resources - Other: $110,000 ($0.73)Water Utilities - Interest on Debt: $2,634,000 ($17.53)
Escondido government finances - Revenue in 2018 (per resident):
Charges - Sewerage: $38,268,000 ($254.66)
Other: $28,734,000 ($191.22)Parks and Recreation: $2,591,000 ($17.24)Regular Highways: $3,000 ($0.02)Housing and Community Development: $1,000 ($0.01)Federal Intergovernmental - Other: $1,959,000 ($13.04)
Housing and Community Development: $1,595,000 ($10.61)Local Intergovernmental - Highways: $5,527,000 ($36.78)
Sewerage: $4,186,000 ($27.86)Other: $124,000 ($0.83)Miscellaneous - General Revenue - Other: $5,688,000 ($37.85)
Rents: $5,392,000 ($35.88)Sale of Property: $1,725,000 ($11.48)Fines and Forfeits: $1,266,000 ($8.42)Interest Earnings: $587,000 ($3.91)Donations From Private Sources: $106,000 ($0.71)Revenue - Water Utilities: $61,551,000 ($409.60)
State Intergovernmental - Other: $6,412,000 ($42.67)
General Local Government Support: $5,768,000 ($38.38)Highways: $3,936,000 ($26.19)Water Utilities: $382,000 ($2.54)Tax - General Sales and Gross Receipts: $36,870,000 ($245.36)
Property: $32,244,000 ($214.57)Public Utilities Sales: $6,684,000 ($44.48)Other License: $3,669,000 ($24.42)Occupation and Business License - Other: $1,828,000 ($12.16)Other Selective Sales: $1,765,000 ($11.75)Documentary and Stock Transfer: $759,000 ($5.05)
Escondido government finances - Debt in 2018 (per resident):
Long Term Debt - Beginning Outstanding - Unspecified Public Purpose: $318,857,000 ($2121.89)
Outstanding Unspecified Public Purpose: $297,017,000 ($1976.56)Retired Unspecified Public Purpose: $21,852,000 ($145.42)Beginning Outstanding - Public Debt for Private Purpose: $7,070,000 ($47.05)Outstanding Nonguaranteed - Industrial Revenue: $7,070,000 ($47.05)Issue, Unspecified Public Purpose: $13,000 ($0.09)
Escondido government finances - Cash and Securities in 2018 (per resident):
Bond Funds - Cash and Securities: $12,120,000 ($80.65)
Other Funds - Cash and Securities: $113,483,000 ($755.19)
Sinking Funds - Cash and Securities: $11,165,000 ($74.30)
5.18% of this county's 2021 resident taxpayers lived in other counties in 2020 ($90,734 average adjusted gross income )
Here:
5.18%California average:
5.19%
0.14% of residents moved from foreign countries ($1,493 average AGI )San Diego County:
0.14%California average:
0.03%
Top counties from which taxpayers relocated into this county between 2020 and 2021:
5.71% of this county's 2020 resident taxpayers moved to other counties in 2021 ($83,556 average adjusted gross income )
Here:
5.71%California average:
6.14%
0.09% of residents moved to foreign countries ($1,067 average AGI )San Diego County:
0.09%California average:
0.02%
Top counties to which taxpayers relocated from this county between 2020 and 2021:
Businesses in Escondido, CA
Name Count Name Count
24 Hour Fitness 2 Journeys 1 7-Eleven 12 Justice 2 99 Cents Only Stores 1 KFC 3 ALDO 1 Kroger 2 AT&T 4 LA Fitness 1 Abercrombie & Fitch 1 Lane Furniture 1 Abercrombie Kids 1 LensCrafters 2 Aeropostale 1 Little Caesars Pizza 3 Albertsons 2 Lowe's 1 American Eagle Outfitters 1 Macy's 1 Ann Taylor 1 MasterBrand Cabinets 5 Apple Store 1 Mazda 1 Applebee's 1 McDonald's 6 Arby's 1 Men's Wearhouse 1 Audi 1 Motel 6 1 AutoZone 3 Motherhood Maternity 2 Avenue 1 New Balance 2 BMW 1 New York & Co 1 Banana Republic 1 Nike 16 Barnes & Noble 1 Nissan 1 Baskin-Robbins 1 Nordstrom 1 Bath & Body Works 1 Office Depot 1 Bebe 1 Old Navy 1 Best Western 1 Olive Garden 1 Big O Tires 1 On The Border 1 Blockbuster 2 Pac Sun 1 Brookstone 1 Panda Express 5 Burger King 4 Panera Bread 2 CVS 5 Papa John's Pizza 2 Cache 1 Payless 4 Carl\s Jr. 4 Penske 2 Casual Male XL 1 PetSmart 1 Charlotte Russe 1 Pier 1 Imports 1 Chevrolet 1 Pizza Hut 2 Chipotle 1 Plato's Closet 1 Chuck E. Cheese's 1 Quiznos 2 Cinnabon 1 RadioShack 3 Circle K 2 Red Robin 1 Cold Stone Creamery 1 Rite Aid 2 Coldwater Creek 1 Rodeway Inn 1 Comfort Inn 1 Ryder Rental & Truck Leasing 1 Cricket Wireless 6 SAS Shoes 1 Curves 2 Safeway 2 DHL 5 Sears 2 Dairy Queen 1 Sephora 1 Dennys 1 Soma Intimates 1 Discount Tire 2 Spencer Gifts 1 Domino's Pizza 2 Sprint Nextel 3 El Pollo Loco 1 Staples 1 Express 1 Starbucks 13 FedEx 13 Subway 1 Foot Locker 1 Super 8 1 Forever 21 1 T-Mobile 6 Fredericks Of Hollywood 1 T.J.Maxx 1 GNC 2 Taco Bell 2 GameStop 3 Target 1 Gap 2 Torrid 1 Goodwill 2 Toyota 1 Gymboree 1 Toys"R"Us 1 H&M 1 Trader Joe's 1 H&R Block 4 True Value 1 Holiday Inn 1 U-Haul 4 Hollister Co. 1 UPS 23 Home Depot 2 Vans 9 Honda 1 Verizon Wireless 2 Hot Topic 1 Victoria's Secret 1 Howard Johnson 1 Volkswagen 1 IHOP 2 Vons 4 JCPenney 1 Walgreens 3 Jack In The Box 4 Wendy's 2 Jamba Juice 2 YMCA 1 Jones New York 5
Strongest AM radio stations in Escondido:
KPRZ (1210 AM; 20 kW; SAN MARCOS, CA; Owner: RADIO 1210, INC.)
KFMB (760 AM; 50 kW; SAN DIEGO, CA; Owner: MIDWEST TELEVISION, INC.)
KFSD (1450 AM; 1 kW; ESCONDIDO, CA; Owner: NORTH COUNTY BROADCASTING CORP.)
KCBQ (1170 AM; 50 kW; SAN DIEGO, CA; Owner: RADIO 1210, INC.)
KSDO (1130 AM; 10 kW; SAN DIEGO, CA; Owner: HI-FAVOR BROADCASTING, LLC)
KECR (910 AM; 5 kW; EL CAJON, CA; Owner: FAMILY STATIONS, INC.)
KPLS (830 AM; 50 kW; ORANGE, CA; Owner: CRN LICENSES, LLC)
KCEO (1000 AM; 2 kW; VISTA, CA; Owner: NORTH COUNTY BROADCASTING CORPORATIO)
KFI (640 AM; 50 kW; LOS ANGELES, CA; Owner: CAPSTAR TX LIMITED PARTNERSHIP)
KLAC (570 AM; 50 kW; LOS ANGELES, CA; Owner: AMFM RADIO LICENSES, L.L.C.)
KOGO (600 AM; 5 kW; SAN DIEGO, CA; Owner: CITICASTERS LICENSES, L.P.)
KTNQ (1020 AM; 50 kW; LOS ANGELES, CA; Owner: KTNQ-AM LICENSE CORP.)
KXTA (1150 AM; 50 kW; LOS ANGELES, CA; Owner: CITICASTERS LICENSES, L.P.)
Strongest FM radio stations in Escondido:
KFSD-FM (92.1 FM; ESCONDIDO, CA; Owner: NORTH COUNTY BROADCASTING CORP.)
KPRI (102.1 FM; ENCINITAS, CA; Owner: COMPASS RADIO OF SAN DIEGO, INC.)
KRTM (88.9 FM; TEMECULA, CA; Owner: PENFOLD COMMUNICATIONS, INC.)
KPBS-FM (89.5 FM; SAN DIEGO, CA; Owner: THE BD. OF TRUSTEES, CALIFORNIA STATE UNIVERSITY)
KWVE (107.9 FM; SAN CLEMENTE, CA; Owner: CALVARY CHAPEL OF COSTA MESA)
KLQV (102.9 FM; SAN DIEGO, CA; Owner: HBC LICENSE CORPORATION)
KLVJ (100.1 FM; JULIAN, CA; Owner: EDUCATIONAL MEDIA FOUNDATION)
KHTS-FM (93.3 FM; EL CAJON, CA; Owner: CITICASTERS LICENSES, L.P.)
KGB-FM (101.5 FM; SAN DIEGO, CA; Owner: CITICASTERS LICENSES, L.P.)
KSON-FM (97.3 FM; SAN DIEGO, CA; Owner: JEFFERSON-PILOT COMMUNICATIONS COMPANY OF CALIFORNIA)
K210CL (89.9 FM; LEMON GROVE, CA; Owner: SANTA MONICA COMMUNITY COLLEGE DISTRICT)
KLRD (90.1 FM; YUCAIPA, CA; Owner: EDUCATIONAL MEDIA FOUNDATION)
KLNV (106.5 FM; SAN DIEGO, CA; Owner: HBC LICENSE CORPORATION)
KBZT (94.9 FM; SAN DIEGO, CA; Owner: JEFFERSON-PILOT COMMUNICATIONS COMPANY OF CALIFORNIA)
KIFM (98.1 FM; SAN DIEGO, CA; Owner: JEFFERSON-PILOT COMMUNICATIONS COMPANY OF CALIFORNIA)
KYXY (96.5 FM; SAN DIEGO, CA; Owner: INFINITY RADIO OPERATIONS INC.)
KUOR-FM (89.1 FM; REDLANDS, CA; Owner: UNIVERSITY OF REDLANDS)
KGBB (103.3 FM; TEMECULA, CA; Owner: CLEAR CHANNEL BROADCASTING LICENSES, INC.)
KATY-FM (101.3 FM; IDYLLWILD, CA; Owner: ALL PRO BROADCASTING, INC.)
KOCL (95.7 FM; CARLSBAD, CA; Owner: CITICASTERS LICENSES, L.P.)
TV broadcast stations around Escondido:
K26FA (Channel 26; VISTA, CA; Owner: RICK D'AMICO)
KBOP-LP (Channel 25; SAN DIEGO, CA; Owner: COMMERCIAL BROADCASTING CORP.)
K63EN (Channel 63; SAN DIEGO, CA; Owner: CIVIC LIGHT, INC.)
KSZZ-LP (Channel 19; SAN DIEGO, CA; Owner: ENTRAVISION HOLDINGS, LLC)
KZDF-LP (Channel 41; SAN DIEGO, CA; Owner: LAURIE MINTZ)
KSKT-CA (Channel 43; SAN MARCOS, CA; Owner: BLUE SKIES BROADCASTING CORPORATION)
KFMB-TV (Channel 8; SAN DIEGO, CA; Owner: MIDWEST TELEVISION, INC.)
KHAX-LP (Channel 49; VISTA, CA; Owner: ENTRAVISION HOLDINGS, LLC)
KTCD-LP (Channel 46; SAN DIEGO, CA; Owner: ENTRAVISION HOLDINGS, LLC)
National Bridge Inventory (NBI) Statistics 144 Number of bridges1,919ft / 585m Total length6,131,208 Total average daily traffic366,625 Total average daily truck traffic
New bridges - historical statistics
3 1940-1949 2 1950-1959 30 1960-1969 86 1970-1979 11 1980-1989 5 1990-1999 4 2000-2009 3 2010-2019
See full National Bridge Inventory statistics for Escondido, CA
Home Mortgage Disclosure Act Aggregated Statistics For Year 2009(Based on 14 full and 16 partial tracts) A) FHA, FSA/RHS & VA B) Conventional C) Refinancings D) Home Improvement Loans E) Loans on Dwellings For 5+ Families F) Non-occupant Loans on G) Loans On Manufactured Number Average Value Number Average Value Number Average Value Number Average Value Number Average Value Number Average Value Number Average Value
LOANS ORIGINATED 602 $248,460 488 $205,031 1,117 $261,553 47 $114,347 12 $3,236,108 248 $165,803 27 $169,905 APPLICATIONS APPROVED, NOT ACCEPTED 79 $242,957 66 $207,384 131 $305,681 3 $58,263 2 $655,000 31 $202,645 9 $94,132 APPLICATIONS DENIED 139 $225,802 163 $190,129 456 $282,927 26 $79,813 0 $0 120 $174,131 26 $115,909 APPLICATIONS WITHDRAWN 110 $236,589 83 $177,545 296 $280,401 9 $111,041 0 $0 66 $168,832 7 $171,150 FILES CLOSED FOR INCOMPLETENESS 23 $259,192 22 $177,337 57 $272,843 2 $201,655 0 $0 13 $199,817 1 $56,270
Aggregated Statistics For Year 2008(Based on 14 full and 16 partial tracts) A) FHA, FSA/RHS & VA B) Conventional C) Refinancings D) Home Improvement Loans E) Loans on Dwellings For 5+ Families F) Non-occupant Loans on G) Loans On Manufactured Number Average Value Number Average Value Number Average Value Number Average Value Number Average Value Number Average Value Number Average Value
LOANS ORIGINATED 395 $265,547 728 $220,221 656 $251,352 44 $139,227 12 $961,532 328 $173,569 30 $108,673 APPLICATIONS APPROVED, NOT ACCEPTED 42 $267,580 186 $230,571 201 $289,404 11 $107,563 1 $1,302,620 72 $237,293 41 $85,647 APPLICATIONS DENIED 95 $242,934 315 $241,836 585 $307,922 90 $144,293 5 $1,883,858 137 $233,449 52 $115,471 APPLICATIONS WITHDRAWN 75 $248,043 174 $214,231 216 $304,188 30 $112,418 0 $0 62 $238,737 8 $125,639 FILES CLOSED FOR INCOMPLETENESS 20 $226,996 37 $263,773 62 $308,529 11 $175,521 0 $0 19 $193,085 0 $0
Aggregated Statistics For Year 2007(Based on 14 full and 16 partial tracts) A) FHA, FSA/RHS & VA B) Conventional C) Refinancings D) Home Improvement Loans E) Loans on Dwellings For 5+ Families F) Non-occupant Loans on G) Loans On Manufactured Number Average Value Number Average Value Number Average Value Number Average Value Number Average Value Number Average Value Number Average Value
LOANS ORIGINATED 21 $283,708 1,074 $263,435 1,844 $298,552 142 $205,722 25 $3,327,101 283 $275,297 57 $125,480 APPLICATIONS APPROVED, NOT ACCEPTED 1 $93,790 335 $270,765 576 $307,987 38 $160,629 0 $0 75 $336,302 38 $85,195 APPLICATIONS DENIED 6 $232,218 543 $263,458 1,643 $328,719 164 $194,034 2 $545,170 201 $305,974 90 $106,462 APPLICATIONS WITHDRAWN 3 $338,333 215 $271,347 579 $306,203 45 $230,459 2 $1,833,650 86 $283,396 14 $80,934 FILES CLOSED FOR INCOMPLETENESS 0 $0 52 $293,923 203 $340,591 13 $189,182 1 $741,000 30 $269,790 1 $227,930
Aggregated Statistics For Year 2006(Based on 14 full and 16 partial tracts) A) FHA, FSA/RHS & VA B) Conventional C) Refinancings D) Home Improvement Loans E) Loans on Dwellings For 5+ Families F) Non-occupant Loans on G) Loans On Manufactured Number Average Value Number Average Value Number Average Value Number Average Value Number Average Value Number Average Value Number Average Value
LOANS ORIGINATED 5 $336,100 2,300 $256,688 3,081 $295,539 270 $206,887 25 $2,319,584 454 $284,838 40 $135,611 APPLICATIONS APPROVED, NOT ACCEPTED 0 $0 547 $248,526 765 $292,006 69 $191,518 0 $0 118 $294,474 40 $81,387 APPLICATIONS DENIED 4 $235,298 1,013 $256,558 1,745 $320,852 201 $186,419 1 $335,360 196 $292,494 46 $120,092 APPLICATIONS WITHDRAWN 3 $306,787 439 $253,356 982 $316,315 99 $217,000 2 $978,000 114 $310,997 7 $249,457 FILES CLOSED FOR INCOMPLETENESS 0 $0 117 $271,127 306 $340,328 17 $212,456 2 $2,653,470 22 $330,426 3 $318,043
Aggregated Statistics For Year 2005(Based on 14 full and 16 partial tracts) A) FHA, FSA/RHS & VA B) Conventional C) Refinancings D) Home Improvement Loans E) Loans on Dwellings For 5+ Families F) Non-occupant Loans on G) Loans On Manufactured Number Average Value Number Average Value Number Average Value Number Average Value Number Average Value Number Average Value Number Average Value
LOANS ORIGINATED 15 $261,321 2,683 $265,253 3,818 $299,842 372 $219,083 35 $3,453,170 526 $292,523 59 $146,061 APPLICATIONS APPROVED, NOT ACCEPTED 2 $210,500 590 $254,458 663 $294,385 60 $207,248 0 $0 90 $304,795 56 $81,030 APPLICATIONS DENIED 6 $289,788 976 $251,972 1,503 $304,484 224 $172,832 1 $17,601,220 175 $280,602 93 $109,482 APPLICATIONS WITHDRAWN 5 $211,660 539 $267,918 1,071 $297,238 114 $216,253 4 $2,497,750 125 $258,276 35 $126,560 FILES CLOSED FOR INCOMPLETENESS 1 $171,000 122 $276,298 434 $319,482 17 $156,715 0 $0 34 $269,782 3 $294,627
Aggregated Statistics For Year 2004(Based on 14 full and 16 partial tracts) A) FHA, FSA/RHS & VA B) Conventional C) Refinancings D) Home Improvement Loans E) Loans on Dwellings For 5+ Families F) Non-occupant Loans on G) Loans On Manufactured Number Average Value Number Average Value Number Average Value Number Average Value Number Average Value Number Average Value Number Average Value
LOANS ORIGINATED 49 $217,392 2,970 $256,283 4,482 $254,324 295 $191,009 23 $2,260,241 674 $243,996 90 $109,229 APPLICATIONS APPROVED, NOT ACCEPTED 3 $208,333 586 $252,897 766 $252,015 43 $193,490 3 $720,940 102 $234,780 57 $103,695 APPLICATIONS DENIED 12 $186,411 799 $254,131 1,369 $262,477 223 $141,930 9 $859,166 156 $255,821 103 $102,180 APPLICATIONS WITHDRAWN 10 $217,950 488 $262,230 1,337 $252,560 121 $161,588 2 $1,618,930 94 $245,179 29 $217,846 FILES CLOSED FOR INCOMPLETENESS 1 $279,020 127 $241,157 262 $266,708 12 $139,588 0 $0 19 $253,056 11 $114,498
Aggregated Statistics For Year 2003(Based on 14 full and 16 partial tracts) A) FHA, FSA/RHS & VA B) Conventional C) Refinancings D) Home Improvement Loans E) Loans on Dwellings For 5+ Families F) Non-occupant Loans on Number Average Value Number Average Value Number Average Value Number Average Value Number Average Value Number Average Value
LOANS ORIGINATED 210 $220,840 2,406 $211,527 7,176 $204,157 138 $77,379 41 $2,230,600 747 $186,457 APPLICATIONS APPROVED, NOT ACCEPTED 20 $195,418 406 $197,502 982 $211,484 48 $71,988 0 $0 117 $204,424 APPLICATIONS DENIED 11 $216,810 609 $193,700 1,432 $199,272 137 $49,061 5 $1,193,526 140 $210,895 APPLICATIONS WITHDRAWN 32 $200,263 306 $211,888 1,543 $204,585 47 $83,743 1 $1,600,000 87 $193,277 FILES CLOSED FOR INCOMPLETENESS 3 $175,140 111 $223,960 210 $216,915 11 $70,001 1 $22,000,000 31 $182,039
Aggregated Statistics For Year 2002(Based on 3 full and 6 partial tracts) A) FHA, FSA/RHS & VA B) Conventional C) Refinancings D) Home Improvement Loans E) Loans on Dwellings For 5+ Families F) Non-occupant Loans on Number Average Value Number Average Value Number Average Value Number Average Value Number Average Value Number Average Value
LOANS ORIGINATED 51 $210,647 452 $198,189 1,318 $191,276 32 $66,291 17 $2,980,365 134 $209,084 APPLICATIONS APPROVED, NOT ACCEPTED 5 $163,764 65 $211,224 202 $188,303 15 $41,387 0 $0 18 $174,319 APPLICATIONS DENIED 9 $221,506 123 $168,140 293 $177,601 28 $67,074 0 $0 35 $175,135 APPLICATIONS WITHDRAWN 8 $173,779 61 $174,243 281 $192,135 16 $68,939 1 $202,000 17 $158,353 FILES CLOSED FOR INCOMPLETENESS 0 $0 17 $217,031 77 $207,152 3 $15,607 0 $0 6 $206,958
Aggregated Statistics For Year 2001(Based on 3 full and 6 partial tracts) A) FHA, FSA/RHS & VA B) Conventional C) Refinancings D) Home Improvement Loans E) Loans on Dwellings For 5+ Families F) Non-occupant Loans on Number Average Value Number Average Value Number Average Value Number Average Value Number Average Value Number Average Value
LOANS ORIGINATED 84 $189,355 350 $175,940 1,022 $170,753 44 $48,335 11 $1,138,334 123 $156,581 APPLICATIONS APPROVED, NOT ACCEPTED 5 $204,914 66 $175,442 142 $173,309 11 $58,010 1 $610,000 9 $162,790 APPLICATIONS DENIED 10 $164,635 86 $144,365 296 $165,661 32 $42,389 0 $0 22 $143,085 APPLICATIONS WITHDRAWN 10 $146,838 50 $165,390 234 $168,292 14 $49,097 1 $390,000 15 $142,673 FILES CLOSED FOR INCOMPLETENESS 3 $200,000 19 $175,411 58 $177,377 4 $38,628 1 $685,000 3 $202,220
Aggregated Statistics For Year 2000(Based on 3 full and 6 partial tracts) A) FHA, FSA/RHS & VA B) Conventional C) Refinancings D) Home Improvement Loans E) Loans on Dwellings For 5+ Families F) Non-occupant Loans on Number Average Value Number Average Value Number Average Value Number Average Value Number Average Value Number Average Value
LOANS ORIGINATED 117 $153,004 387 $146,814 271 $128,035 44 $41,028 10 $1,113,005 67 $130,268 APPLICATIONS APPROVED, NOT ACCEPTED 9 $152,756 51 $159,485 66 $123,079 14 $36,552 0 $0 8 $112,648 APPLICATIONS DENIED 16 $149,204 109 $125,096 120 $129,935 52 $33,181 8 $554,631 13 $101,325 APPLICATIONS WITHDRAWN 20 $149,800 59 $135,926 64 $119,400 7 $35,677 1 $148,000 8 $188,032 FILES CLOSED FOR INCOMPLETENESS 1 $108,710 17 $128,476 36 $152,991 1 $41,530 2 $2,414,390 2 $220,230
Aggregated Statistics For Year 1999(Based on 8 full and 13 partial tracts) A) FHA, FSA/RHS & VA B) Conventional C) Refinancings D) Home Improvement Loans E) Loans on Dwellings For 5+ Families F) Non-occupant Loans on Number Average Value Number Average Value Number Average Value Number Average Value Number Average Value Number Average Value
LOANS ORIGINATED 616 $138,703 1,265 $139,223 1,648 $134,588 158 $50,611 38 $1,588,494 250 $109,510 APPLICATIONS APPROVED, NOT ACCEPTED 27 $137,665 209 $130,768 378 $133,238 75 $29,922 3 $1,378,303 45 $113,575 APPLICATIONS DENIED 67 $134,174 351 $108,969 743 $116,942 118 $26,854 10 $1,003,833 76 $104,575 APPLICATIONS WITHDRAWN 60 $138,722 219 $130,041 460 $119,567 20 $64,545 2 $568,910 35 $107,286 FILES CLOSED FOR INCOMPLETENESS 14 $132,154 47 $151,490 145 $139,130 5 $28,724 10 $2,130,567 16 $111,666
Detailed mortgage data for all 30 tracts in Escondido, CA
Private Mortgage Insurance Companies Aggregated Statistics For Year 2009(Based on 13 full and 16 partial tracts) A) Conventional B) Refinancings C) Non-occupant Loans on Number Average Value Number Average Value Number Average Value
LOANS ORIGINATED 55 $230,502 8 $278,875 1 $173,000 APPLICATIONS APPROVED, NOT ACCEPTED 31 $252,042 5 $345,214 0 $0 APPLICATIONS DENIED 16 $252,457 5 $253,028 0 $0 APPLICATIONS WITHDRAWN 6 $184,633 0 $0 0 $0 FILES CLOSED FOR INCOMPLETENESS 2 $283,285 2 $123,245 0 $0
Aggregated Statistics For Year 2008(Based on 14 full and 16 partial tracts) A) Conventional B) Refinancings C) Non-occupant Loans on D) Loans On Manufactured Number Average Value Number Average Value Number Average Value Number Average Value
LOANS ORIGINATED 189 $293,850 44 $344,799 5 $269,550 1 $172,070 APPLICATIONS APPROVED, NOT ACCEPTED 93 $325,635 45 $374,650 8 $287,861 0 $0 APPLICATIONS DENIED 19 $330,140 11 $349,638 2 $567,165 2 $336,610 APPLICATIONS WITHDRAWN 14 $291,636 2 $364,505 0 $0 0 $0 FILES CLOSED FOR INCOMPLETENESS 3 $424,667 2 $354,500 2 $448,500 0 $0
Aggregated Statistics For Year 2007(Based on 14 full and 16 partial tracts) A) Conventional B) Refinancings C) Non-occupant Loans on D) Loans On Manufactured Number Average Value Number Average Value Number Average Value Number Average Value
LOANS ORIGINATED 95 $320,209 67 $389,882 7 $330,436 3 $228,507 APPLICATIONS APPROVED, NOT ACCEPTED 20 $352,368 35 $367,131 2 $312,845 1 $231,260 APPLICATIONS DENIED 6 $362,352 8 $374,242 0 $0 0 $0 APPLICATIONS WITHDRAWN 10 $338,503 13 $353,896 3 $276,333 0 $0 FILES CLOSED FOR INCOMPLETENESS 0 $0 0 $0 0 $0 0 $0
Aggregated Statistics For Year 2006(Based on 14 full and 14 partial tracts) A) Conventional B) Refinancings C) Non-occupant Loans on D) Loans On Manufactured Number Average Value Number Average Value Number Average Value Number Average Value
LOANS ORIGINATED 22 $388,495 39 $382,796 3 $324,140 2 $267,525 APPLICATIONS APPROVED, NOT ACCEPTED 9 $340,947 11 $448,118 2 $293,210 1 $445,700 APPLICATIONS DENIED 4 $441,732 7 $472,696 2 $546,390 0 $0 APPLICATIONS WITHDRAWN 3 $506,880 6 $310,405 0 $0 0 $0 FILES CLOSED FOR INCOMPLETENESS 0 $0 0 $0 0 $0 0 $0
Aggregated Statistics For Year 2005(Based on 14 full and 13 partial tracts) A) Conventional B) Refinancings C) Non-occupant Loans on D) Loans On Manufactured Number Average Value Number Average Value Number Average Value Number Average Value
LOANS ORIGINATED 36 $346,122 44 $342,986 5 $247,076 3 $219,543 APPLICATIONS APPROVED, NOT ACCEPTED 7 $339,419 10 $267,630 2 $187,000 0 $0 APPLICATIONS DENIED 1 $513,000 1 $547,200 0 $0 0 $0 APPLICATIONS WITHDRAWN 3 $301,173 3 $396,880 1 $260,520 0 $0 FILES CLOSED FOR INCOMPLETENESS 0 $0 0 $0 0 $0 0 $0
Aggregated Statistics For Year 2004(Based on 14 full and 16 partial tracts) A) Conventional B) Refinancings C) Non-occupant Loans on D) Loans On Manufactured Number Average Value Number Average Value Number Average Value Number Average Value
LOANS ORIGINATED 90 $296,164 56 $297,694 11 $284,510 4 $200,100 APPLICATIONS APPROVED, NOT ACCEPTED 24 $274,012 22 $300,543 2 $266,120 0 $0 APPLICATIONS DENIED 4 $170,785 0 $0 2 $135,500 0 $0 APPLICATIONS WITHDRAWN 5 $323,204 0 $0 2 $280,510 0 $0 FILES CLOSED FOR INCOMPLETENESS 1 $267,490 1 $209,350 0 $0 0 $0
Aggregated Statistics For Year 2003(Based on 14 full and 15 partial tracts) A) Conventional B) Refinancings C) Non-occupant Loans on Number Average Value Number Average Value Number Average Value
LOANS ORIGINATED 228 $245,363 118 $233,261 24 $185,075 APPLICATIONS APPROVED, NOT ACCEPTED 34 $224,571 54 $235,517 3 $185,933 APPLICATIONS DENIED 3 $314,183 2 $172,100 0 $0 APPLICATIONS WITHDRAWN 10 $255,127 6 $249,477 3 $161,560 FILES CLOSED FOR INCOMPLETENESS 1 $343,130 0 $0 0 $0
Aggregated Statistics For Year 2002(Based on 3 full and 6 partial tracts) A) Conventional B) Refinancings C) Non-occupant Loans on Number Average Value Number Average Value Number Average Value
LOANS ORIGINATED 68 $224,845 45 $221,916 3 $210,333 APPLICATIONS APPROVED, NOT ACCEPTED 12 $193,038 14 $255,502 0 $0 APPLICATIONS DENIED 3 $182,313 4 $214,258 0 $0 APPLICATIONS WITHDRAWN 9 $231,678 3 $222,970 0 $0 FILES CLOSED FOR INCOMPLETENESS 0 $0 0 $0 0 $0
Aggregated Statistics For Year 2001(Based on 3 full and 6 partial tracts) A) Conventional B) Refinancings C) Non-occupant Loans on Number Average Value Number Average Value Number Average Value
LOANS ORIGINATED 75 $195,039 56 $206,360 9 $178,444 APPLICATIONS APPROVED, NOT ACCEPTED 13 $200,662 19 $205,237 1 $280,780 APPLICATIONS DENIED 4 $201,470 3 $184,820 1 $260,570 APPLICATIONS WITHDRAWN 1 $310,650 3 $179,220 0 $0 FILES CLOSED FOR INCOMPLETENESS 0 $0 1 $241,560 0 $0
Aggregated Statistics For Year 2000(Based on 3 full and 6 partial tracts) A) Conventional B) Refinancings C) Non-occupant Loans on Number Average Value Number Average Value Number Average Value
LOANS ORIGINATED 73 $165,349 38 $178,509 6 $121,393 APPLICATIONS APPROVED, NOT ACCEPTED 10 $173,253 6 $171,538 2 $171,550 APPLICATIONS DENIED 2 $163,580 1 $185,040 1 $216,000 APPLICATIONS WITHDRAWN 1 $297,310 0 $0 0 $0 FILES CLOSED FOR INCOMPLETENESS 1 $113,680 0 $0 0 $0
Aggregated Statistics For Year 1999(Based on 8 full and 13 partial tracts) A) Conventional B) Refinancings C) Non-occupant Loans on Number Average Value Number Average Value Number Average Value
LOANS ORIGINATED 280 $163,038 165 $159,361 26 $121,401 APPLICATIONS APPROVED, NOT ACCEPTED 28 $161,150 41 $165,018 8 $136,666 APPLICATIONS DENIED 16 $173,915 17 $157,697 3 $131,073 APPLICATIONS WITHDRAWN 10 $123,543 14 $151,342 2 $114,465 FILES CLOSED FOR INCOMPLETENESS 7 $154,081 2 $166,605 0 $0
Fire-safe hotels and motels in Escondido, California:
Motel 6, #1047, 900 N Quince St, Escondido, California 92025 Phone: (760) 745-9252, Fax: (760) 745-4203
Castle Creek Resort & Spa, 28950 Cir R Way, Escondido, California 92026 Phone: (888) 723-3569
Golden Door Fitness Resort, PO Box 463057, Escondido, California 92046 Phone: (760) 744-6677, Fax: (760) 591-3048
Howard Johnson Inn, 515 W Washington Ave, Escondido, California 92025 Phone: (760) 743-1443, Fax: (760) 747-6915
Quality Inn & Suites, 555 North Ctr City Pkwy, Escondido, California 92025 Phone: (760) 743-3700, Fax: (760) 480-5887
SpringHill Suites San Diego Escondido/Downtown, 200 LaTerraza Blvd, Escondido, California 92025 Phone: (442) 286-8100
All 6 fire-safe hotels and motels in Escondido, California
Most common first names in Escondido, CA among deceased individuals Name Count Lived (average)
John 739 75.4 years Robert 638 73.7 years William 625 76.1 years Mary 594 80.4 years James 505 74.4 years Charles 418 76.9 years Dorothy 371 79.9 years George 343 78.6 years Helen 341 83.1 years Margaret 325 80.8 years
Most common last names in Escondido, CA among deceased individuals Last name Count Lived (average)
Smith 252 77.5 years Johnson 243 79.3 years Brown 145 77.9 years Miller 139 78.8 years Davis 120 77.3 years Williams 115 77.2 years Anderson 110 78.5 years Jones 106 78.2 years Martin 90 79.7 years Thompson 88 79.2 years
Escondido compared to California state average:
Unemployed percentage significantly below state average. Escondido, CA compared to other similar cities:
#6 on the list of "Top 101 cities with the largest city-data.com crime index increase from 2011 to 2012 (population 50,000+)"
#17 on the list of "Top 101 cities with largest percentage of females in industries: other services, except public administration (population 50,000+)"
#22 on the list of "Top 101 cities with largest percentage of males in occupations: construction and extraction occupations (population 50,000+)"
#23 on the list of "Top 101 cities with largest percentage of females in occupations: building and grounds cleaning and maintenance occupations (population 50,000+)"
#30 on the list of "Top 101 cities with largest percentage of males in occupations: building and grounds cleaning and maintenance occupations (population 50,000+)"
#31 on the list of "Top 101 cities with the smallest differences between morning and afternoon humidity (population 50,000+)"
#31 on the list of "Top 101 cities with the smallest humidity differences during a year (population 50,000+)"
#32 on the list of "Top 101 cities with largest percentage of males in industries: administrative and support and waste management services (population 50,000+)"
#36 on the list of "Top 101 cities with the most cars per house, population 50,000+"
#37 on the list of "Top 101 cities with the lowest average snowfall in a year (population 50,000+)"
#37 on the list of "Top 101 cities with largest percentage of males in industries: construction (population 50,000+)"
#38 on the list of "Top 101 cities with largest percentage of males in occupations: farming, fishing, and forestry occupations (population 50,000+)"
#46 on the list of "Top 101 cities with largest percentage of males in industries: agriculture, forestry, fishing and hunting (population 50,000+)"
#52 on the list of "Top 101 cities with largest percentage of males in occupations: personal care and service occupations (population 50,000+)"
#57 on the list of "Top 101 cities with fewest building permits per 10,000 residents (population 50,000+)"
#69 on the list of "Top 101 cities with largest percentage of females in industries: administrative and support and waste management services (population 50,000+)"
#74 on the list of "Top 101 cities with the lowest number of police officers per 1000 residents (population 50,000+)"
#78 on the list of "Top 101 cities with largest percentage of females in occupations: farming, fishing, and forestry occupations (population 50,000+)"
#82 on the list of "Top 101 cities with the lowest average wind speeds (population 50,000+)"
#86 on the list of "Top 101 cities with largest percentage of females in industries: agriculture, forestry, fishing and hunting (population 50,000+)"
#80 (92082) on the list of "Top 101 zip codes with the most casinos in 2005"
#4 on the list of "Top 101 counties with the most Catholic adherents"
#4 on the list of "Top 101 counties with the highest lead air pollution readings in 2012 (µg/m3 )"
#7 on the list of "Top 101 counties with the most Evangelical Protestant congregations"
#7 on the list of "Top 101 counties with the most Catholic congregations"
#7 on the list of "Top 101 counties with the highest surface withdrawal of fresh water for public supply (pop. 50,000+)"
Top Patent Applicants
Stephen William Edge (120)
Alexandros Manolakos (93)
Ling Jun Wong (72)
Robert Hardacker (58)
Bret H. Wahl (50)
David L. Felker (49)
Stephen W. Edge (44)
Scott A. Knutson (37)
Christopher D. Harvell (37)
Jason Frank Hunzinger (33)
Total of 2941 patent applications in 2008-2024.
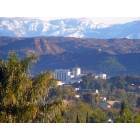
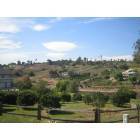

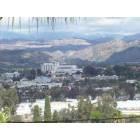
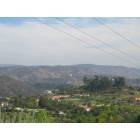
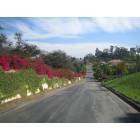
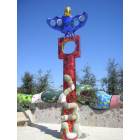
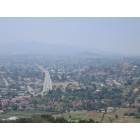
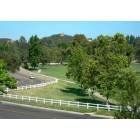
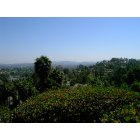
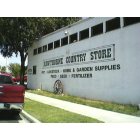
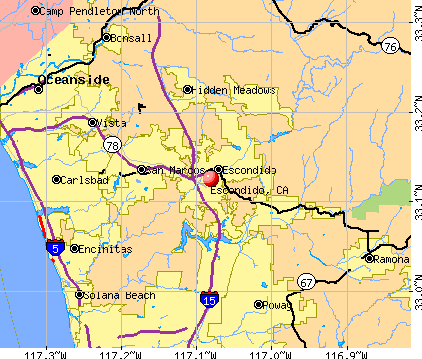


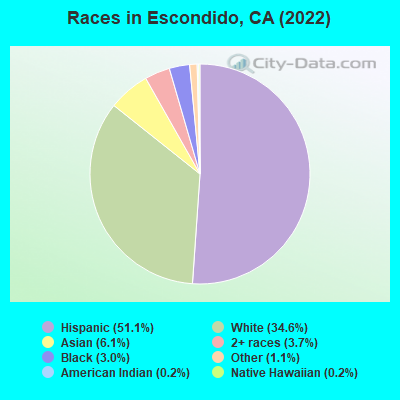
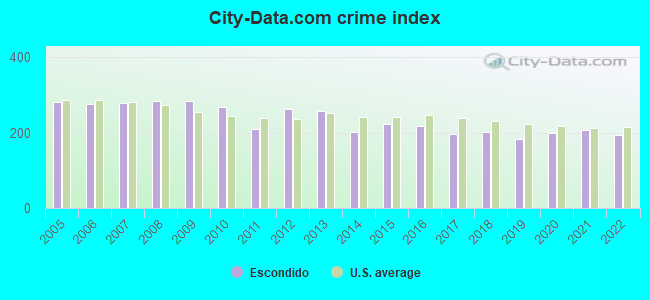
 Recent articles from our blog. Our writers, many of them Ph.D. graduates or candidates, create easy-to-read articles on a wide variety of topics.

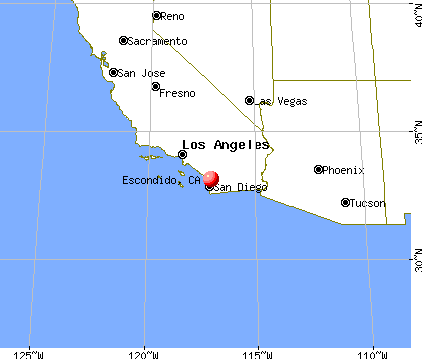
 (24.2 miles
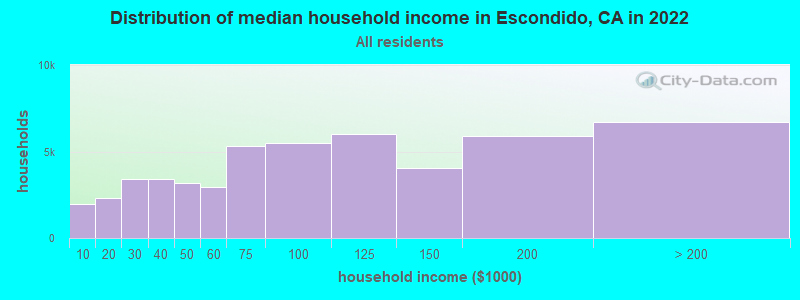
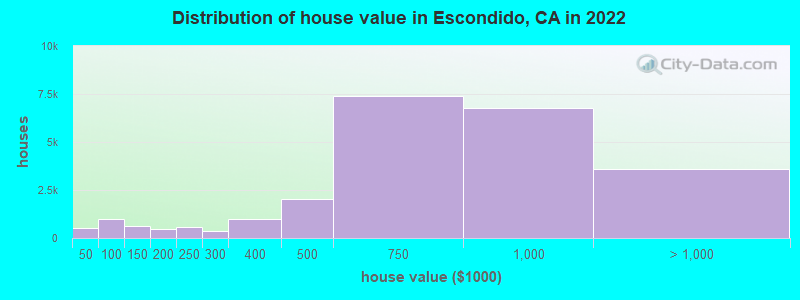
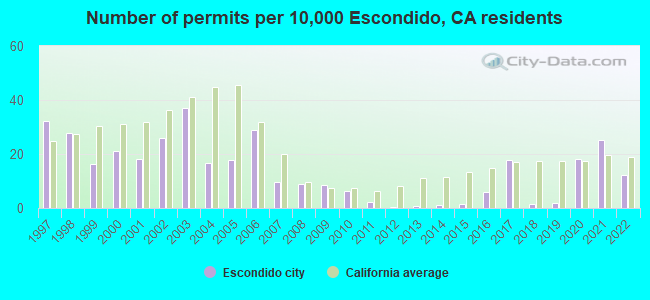
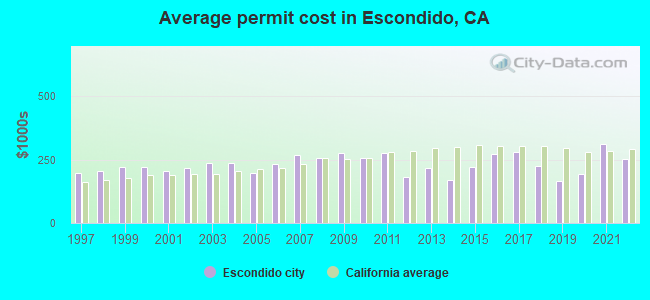
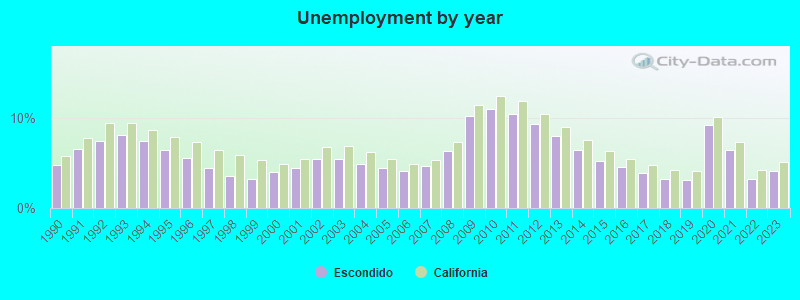
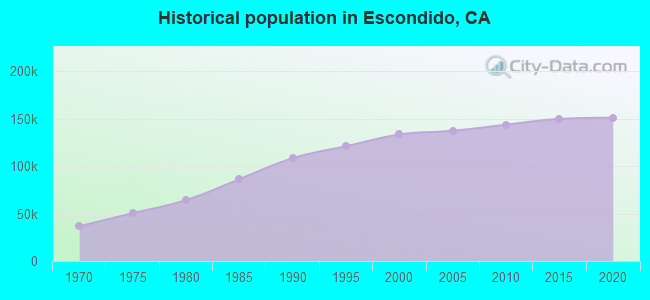
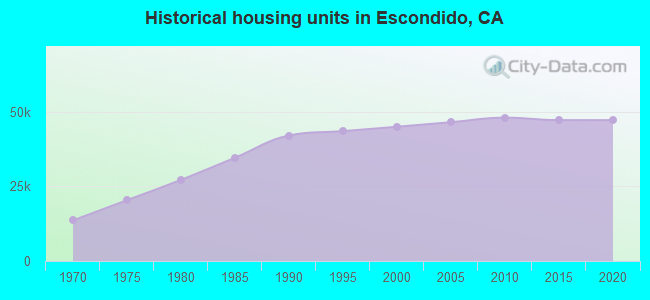
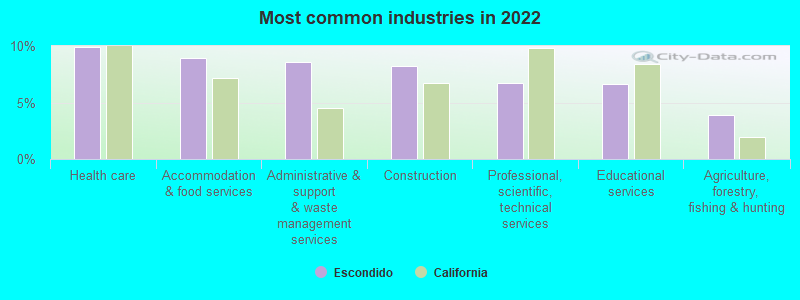
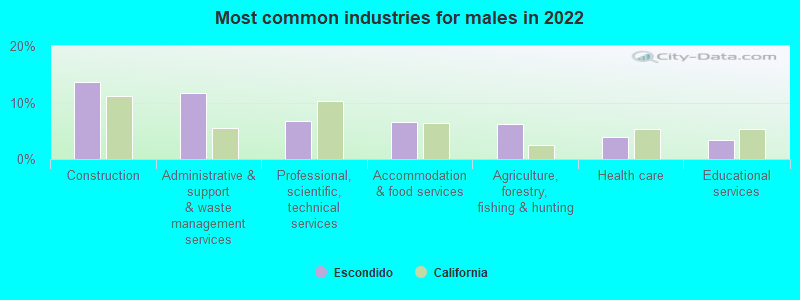
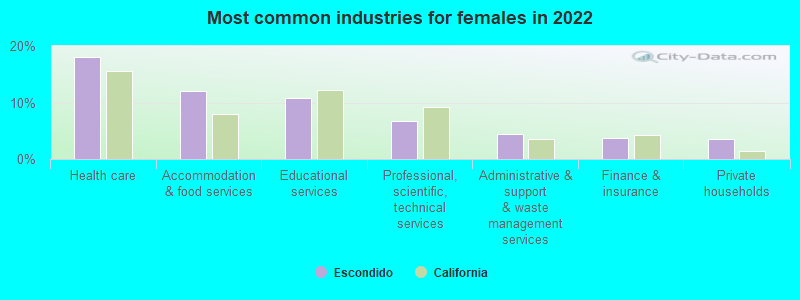
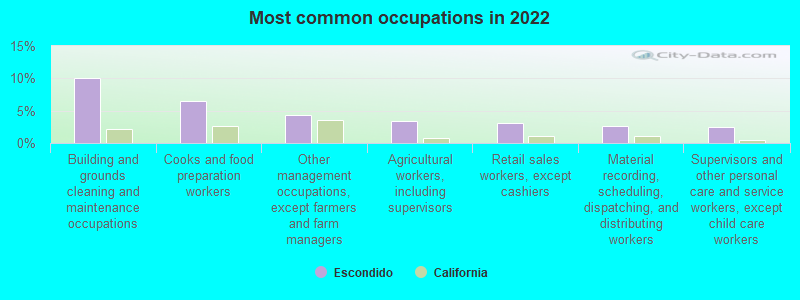
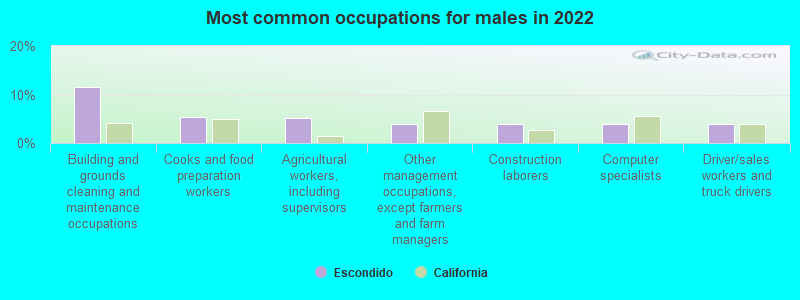
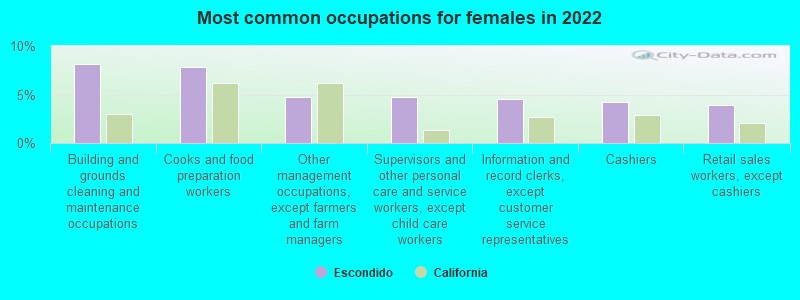
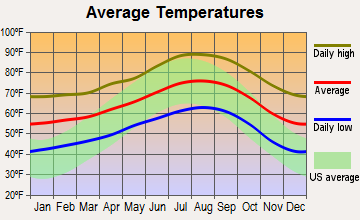
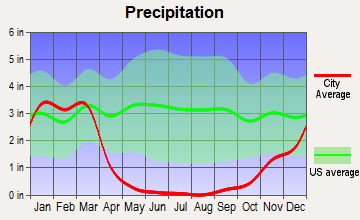
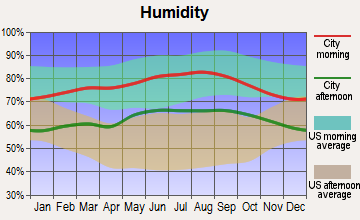
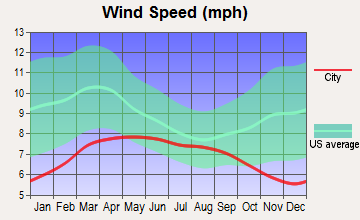
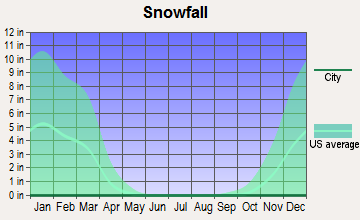
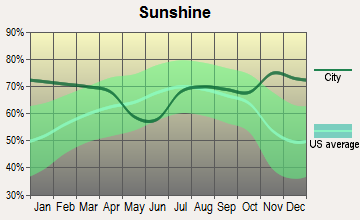
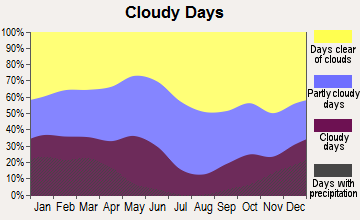
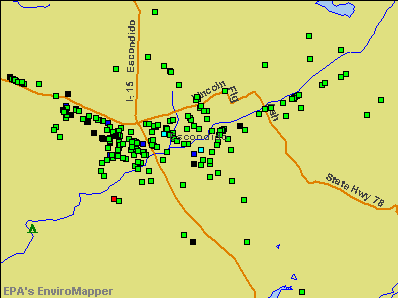

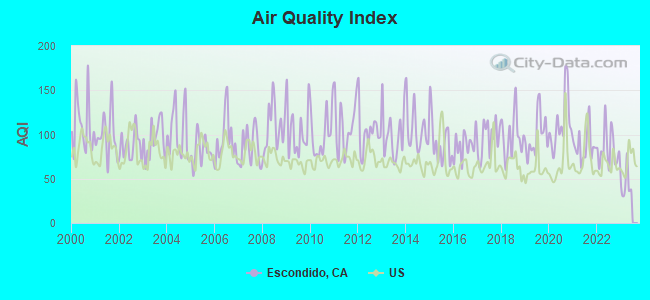
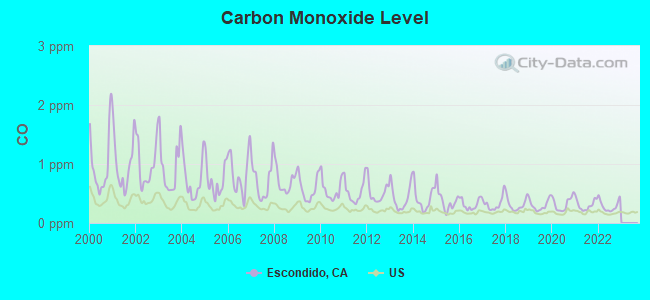
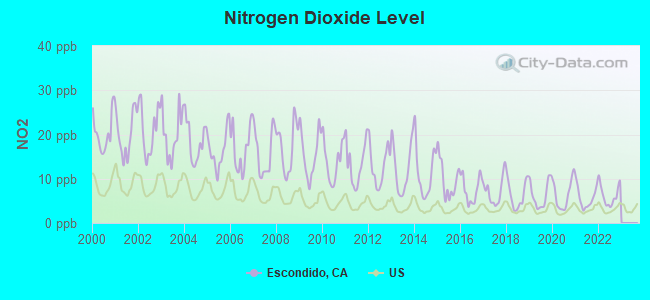
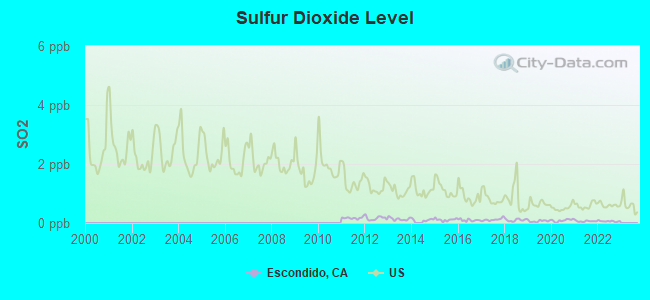
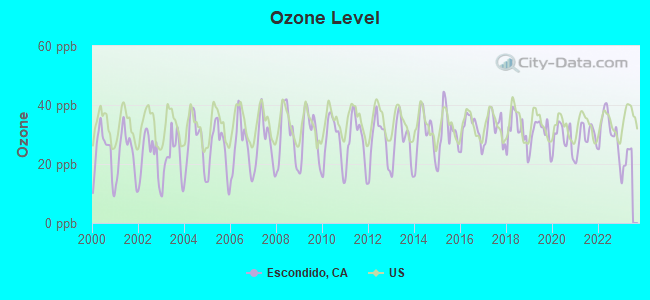
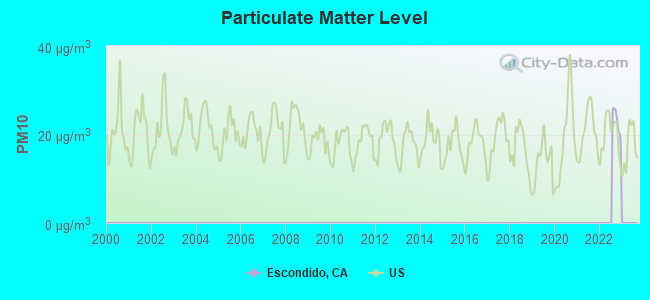

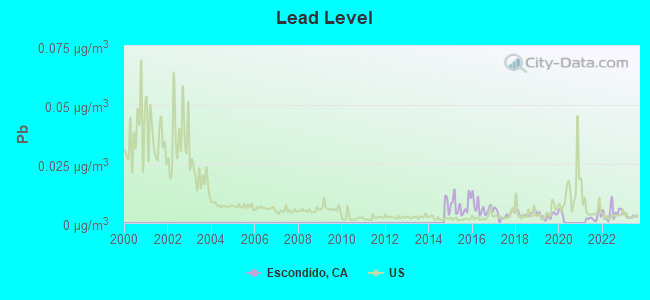

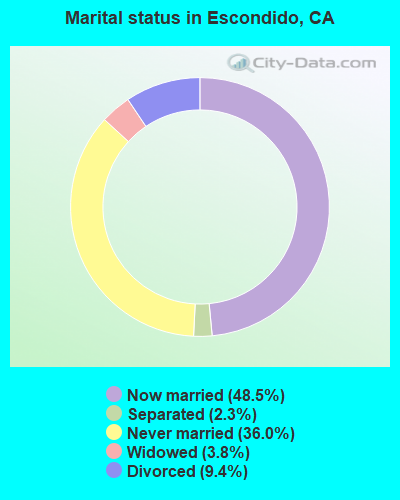
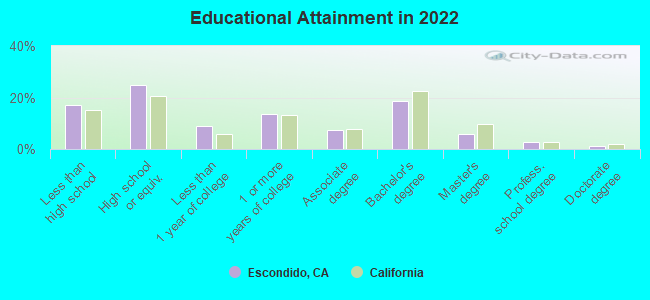
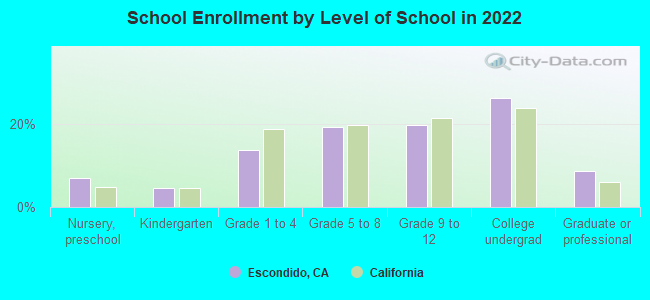
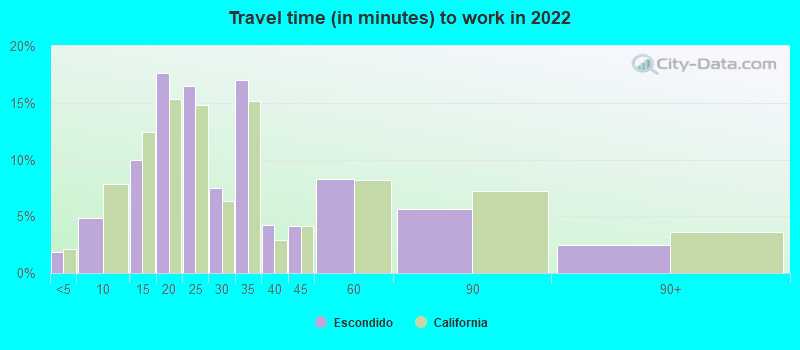
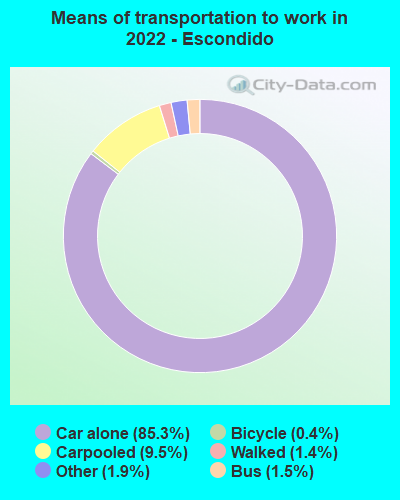
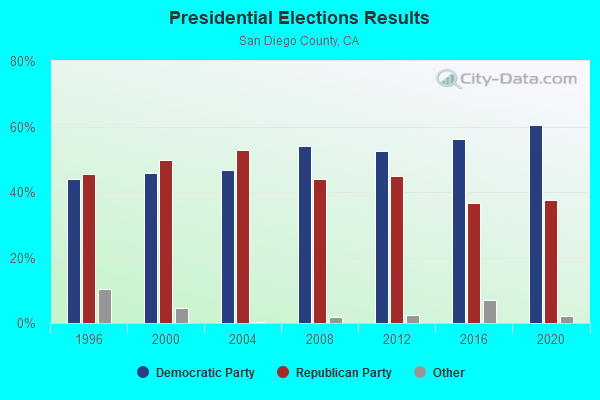
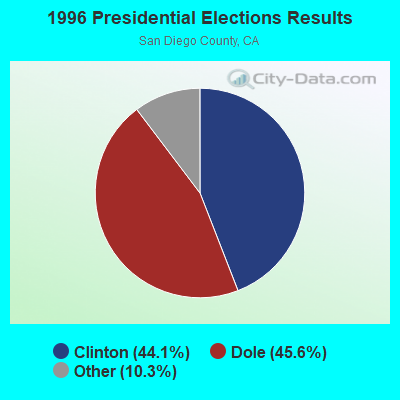
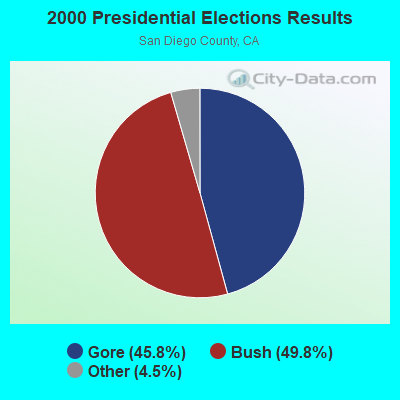
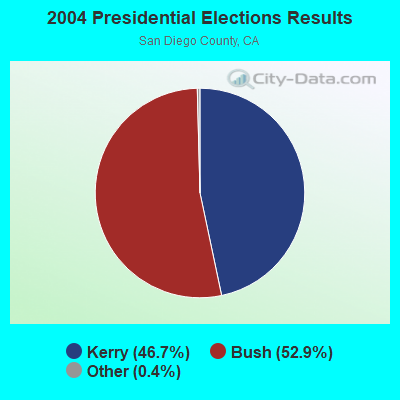
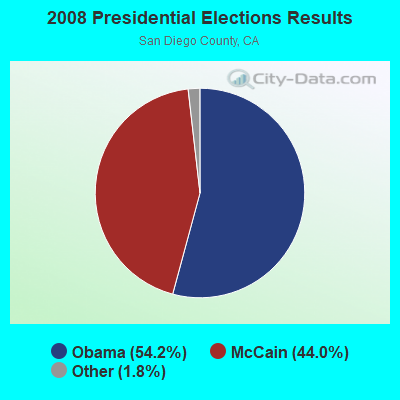
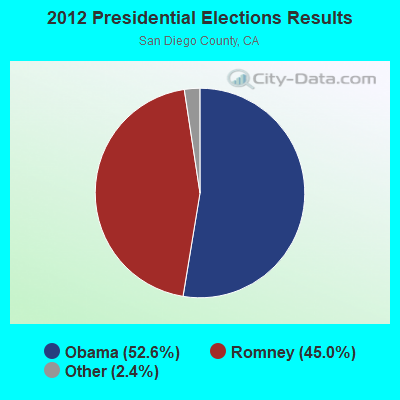
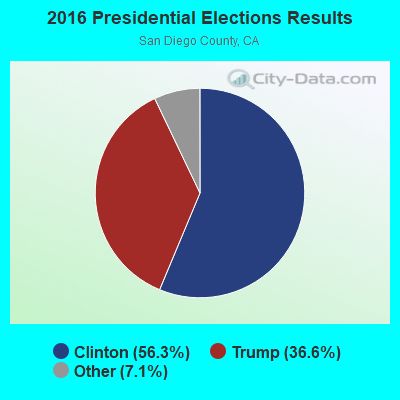
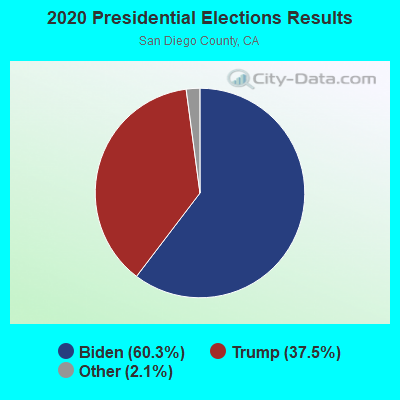
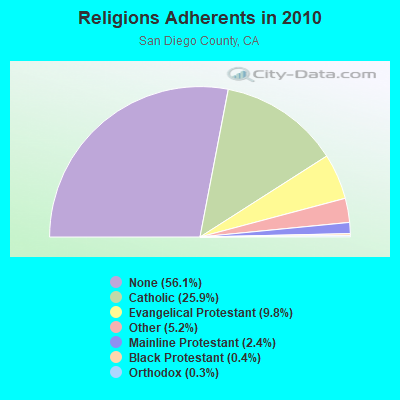
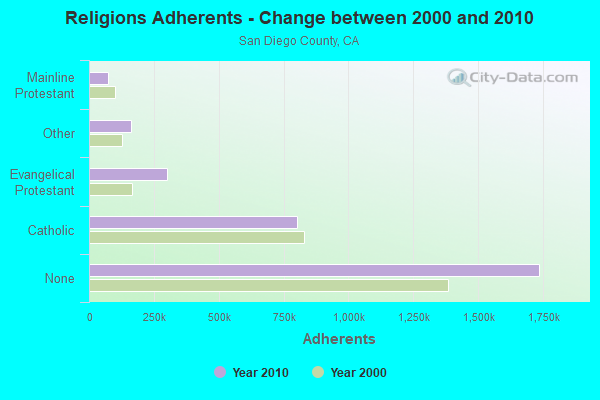
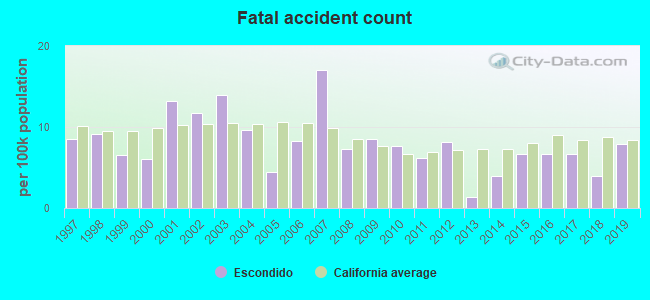
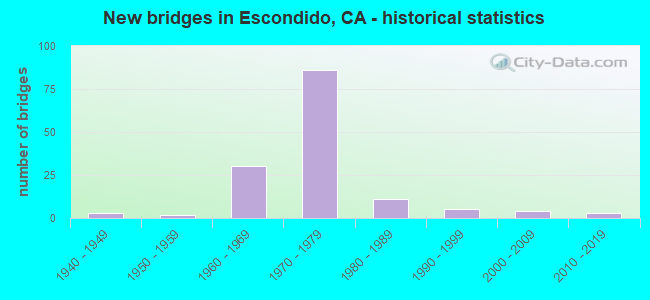
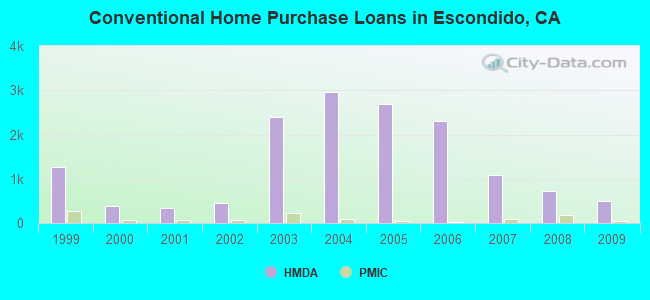
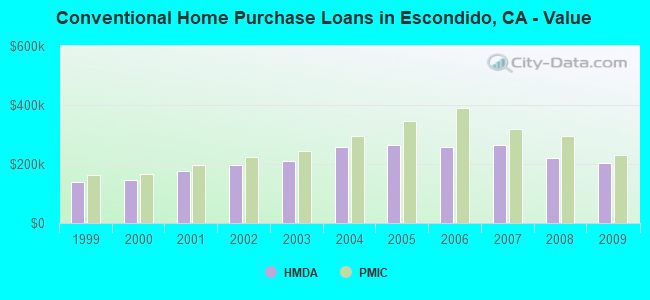
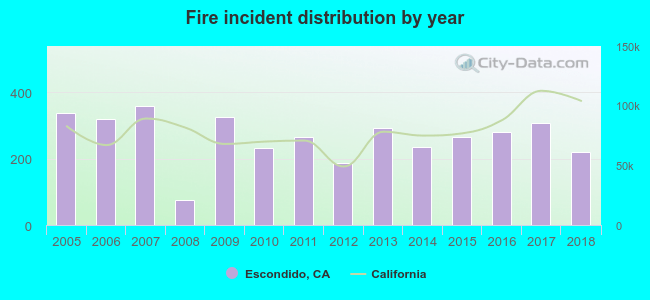 According to the data from the years 2005 - 2018 the average number of fires per year is 264. The highest number of reported fires - 359 took place in 2007, and the least - 75 in 2008. The data has a dropping trend.
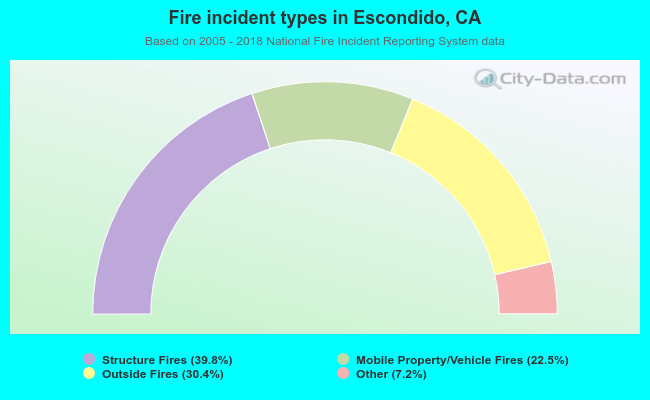 When looking into fire subcategories, the most incidents belonged to: Structure Fires (39.8%), and Outside Fires (30.4%).